
How Asset Class Dashboards Improve Portfolio Management
Asset class dashboards simplify portfolio management by consolidating data from multiple sources into a single, user-friendly platform. They provide real-time insights, visual tools, and customizable features that help professionals make faster, data-driven decisions. Key benefits include:
- Real-Time Data: Access up-to-the-minute metrics like occupancy rates, IRR, and maintenance costs.
- Customizable Views: Tailor dashboards to focus on specific asset types, regions, or KPIs.
- Automated Reporting: Save time by generating accurate, real-time reports for stakeholders.
- Proactive Alerts: Receive instant notifications about critical events like lease expirations or rising costs.
- Integrated Analysis: Compare performance across asset classes and track trends with ease.
These dashboards replace outdated spreadsheets and manual processes, reducing inefficiencies and improving decision-making. Tools like CoreCast offer advanced analytics, stakeholder communication features, and mobile accessibility, making them a go-to solution for modern real estate professionals.
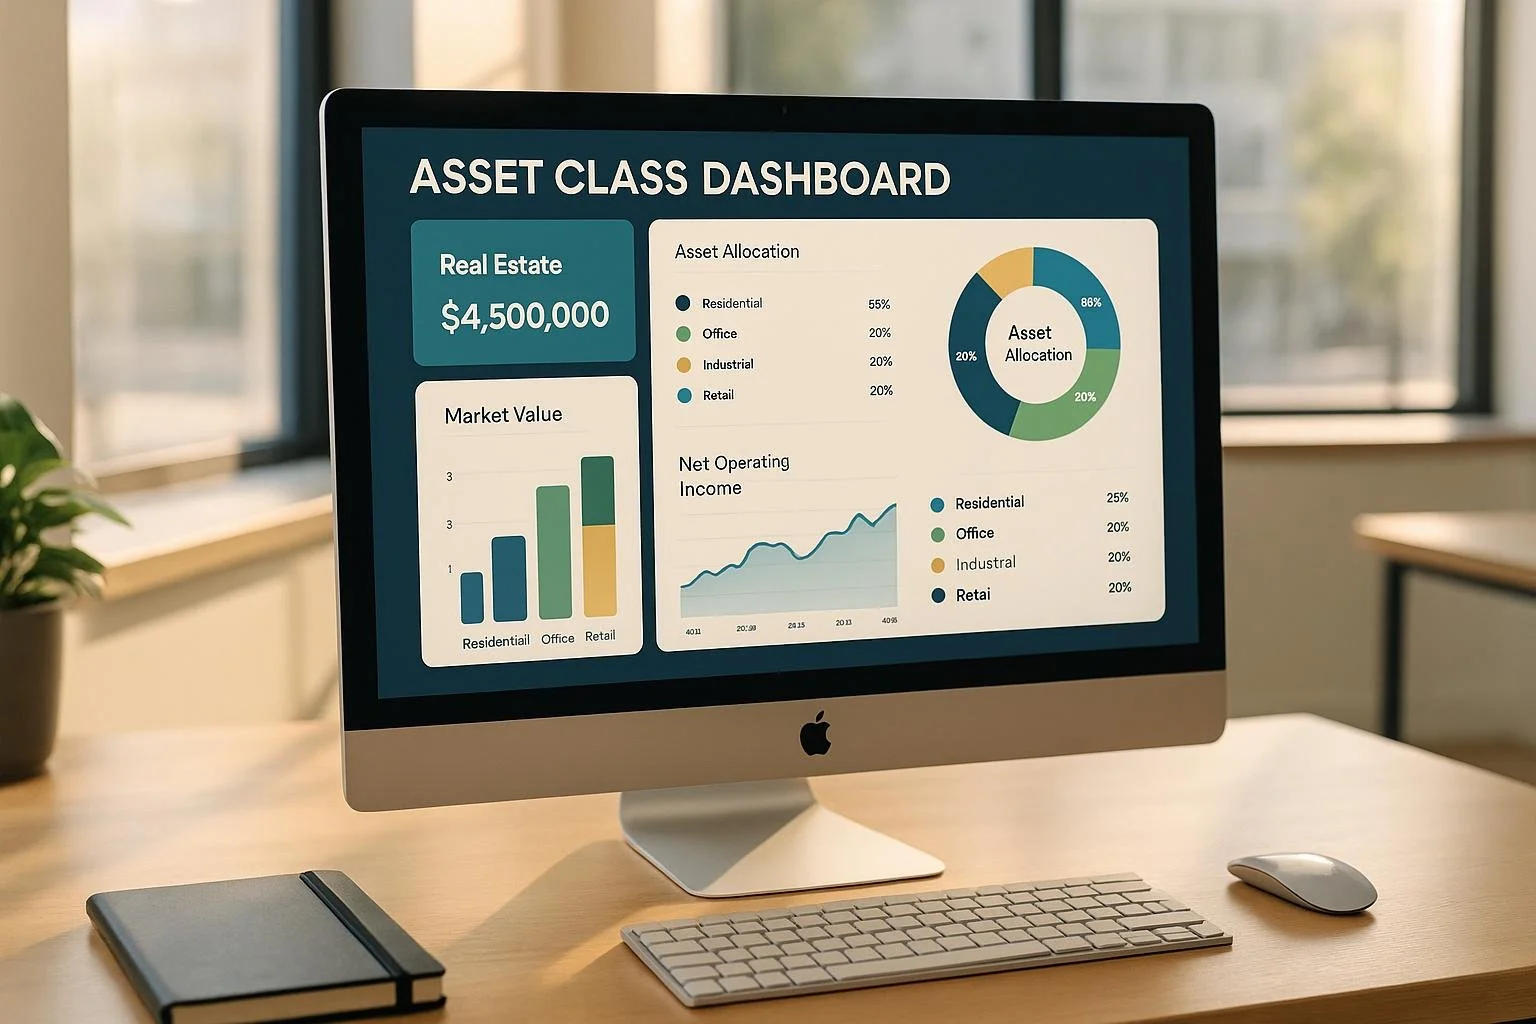
Strategic Portfolio Management Dashboards
How Customizable Dashboards Simplify Asset Class Analysis
Customizable dashboards have revolutionized how real estate professionals manage and analyze their portfolios. By consolidating scattered data into a single platform, they eliminate the inefficiencies of juggling multiple systems and spreadsheets, making workflows smoother and more intuitive.
Combined Data Across All Asset Classes
These dashboards bring together data from various asset types - office buildings, retail spaces, multifamily properties, and industrial facilities - into one comprehensive view. This centralized setup creates a "single source of truth", automatically updating and aggregating information at the individual asset, asset class, and portfolio levels. Beyond just aggregation, dashboards allow users to compare current performance against historical data, benchmarks, and even future projections. This makes it easier to pinpoint top-performing assets or identify those that may need attention. The result? A clear, unified perspective that simplifies the analysis process and supports in-depth, customizable filtering.
Flexible Filtering for Deeper Insights
One of the standout features of customizable dashboards is their ability to apply precise filters, letting users focus on specific areas of interest with just a click. Whether you’re narrowing down by geographic region, risk profile, or acquisition date, these filters provide unparalleled flexibility. The dashboards themselves can be tailored to fit unique needs, offering drag-and-drop design, adjustable card sizes, and the ability to group related metrics. This level of customization allows users to create role-specific dashboards that cater to the needs of different teams.
For instance, you can quickly identify underperforming properties acquired recently or zoom in on assets in markets experiencing significant demographic shifts. Such tailored filtering not only saves time but also ensures that insights are both relevant and actionable. This precision becomes even more powerful when paired with real-time data integration.
Real-Time Data Integration
Real-time data integration is another game-changer. By instantly capturing and processing data from multiple sources, these dashboards provide users with up-to-the-minute information. This immediacy enhances decision-making, reduces data silos, and ensures higher data quality, all while boosting operational efficiency. For example, timely insights can alert you to issues like sudden vacancy increases or rising maintenance costs, allowing you to address them before they escalate.
Finance educator Nolan Gouveia, also known as Professor G, highlighted the impact of modern portfolio tracking platforms, stating:
Quadratic is "life-changing" because it removes the two biggest hurdles in DIY portfolio tracking: knowing which formulas to write and carving out the time to write them.
The numbers back this up: 56% of investors believe advanced analytics improve portfolio performance, over 70% of asset managers are investing in these tools to enhance decision-making, and companies using such platforms see a 126% increase in profitability compared to their peers.
Improving Decision-Making with Real-Time Insights and Alerts
Real-time insights are changing the way portfolio managers handle market shifts and operational hurdles. Gone are the days of waiting for monthly reports or sifting through endless spreadsheets. Today’s dashboards offer instant access to crucial performance metrics and potential issues, empowering managers to act quickly and make smarter decisions across their portfolios. This level of immediacy ensures that key data is always within reach.
Key Performance Indicators (KPIs) at a Glance
With real-time insights, asset class dashboards present vital metrics - like IRR, occupancy rates, and benchmarks - in an easy-to-read format. Portfolio managers can immediately identify which properties are meeting targets and which ones require attention, without wading through lengthy reports. For instance, a privately owned development company uses its dashboard to monitor milestones, analyze trends, and fine-tune budgets. Similarly, a family-owned affordable housing developer relies on its multifamily dashboard to pinpoint strong markets and track rent trends, leading to more informed investment decisions. This instant access to performance data has reshaped how professionals seize market opportunities.
Real-Time Alerts for Critical Events
Beyond instant KPI visibility, automated alerts ensure that no critical event slips through the cracks. These alerts notify managers immediately about significant occurrences - like price changes, lease expirations, or market shifts that could affect asset performance. Instead of uncovering problems during routine reviews, managers can respond proactively. For example, a New York-based private investment firm specializing in real estate credit and equity uses its debt dashboard to monitor loan activity, enabling swift action and risk management. Similarly, family offices are moving away from monthly reports and spreadsheets, opting for dashboards that provide timely updates.
Visual Tools for Quick Assessments
To complement automated alerts, visual tools such as color-coded indicators and milestone trackers make it easier to spot trends and potential issues at a glance. These tools eliminate the need to manually sift through rows of data or compare multiple figures. Intuitive visual cues - like red flags signaling problems or green indicators showing strong performance - help managers quickly zero in on areas that need immediate attention. This visual clarity not only streamlines internal evaluations but also improves communication with stakeholders by clearly illustrating portfolio health and trends.
Integrated Reporting and Stakeholder Communication
Integrated reporting brings together real-time insights and alerts, simplifying how stakeholders stay informed. Clear and effective communication with stakeholders is essential, and asset class dashboards play a key role by consolidating data into a single, reliable source. This approach not only reduces manual errors but also saves teams up to 5 hours every week. With integrated reporting, stakeholders receive performance data that updates automatically, keeping everyone aligned and informed.
Automated Reports
Gone are the days of manually compiling reports. Modern dashboards now handle this task automatically, pulling in real-time data from various asset classes to create detailed, accurate reports. This ensures teams receive consistent updates without delays.
These dashboards also tailor reports to meet specific needs: executives get high-level KPIs, while project managers can dive into detailed metrics[12].
"Creating a dashboard with the right tool can greatly improve the management of complex project portfolios and can provide several key benefits. [The right tool provides] a cohesive view of project information for teams, stakeholders, and executives to stay aligned and up to speed on the latest developments; real-time visibility into timelines, budgets, statuses, resources, and performance metrics across multiple projects; and tracking and managing project risks, such as scope changes, cost increases, and major blockers, which allows you to proactively mitigate risks."
– Jillian Knoepfel, Content Operations Manager, Smartsheet [12]
Simplified Communication
Dashboards go beyond automated reporting by enabling teams to collaborate directly within the platform. This reduces reliance on email and eliminates the headaches of version control issues.
They also boost transparency in critical areas like risk management and resource allocation. Teams can easily spot underutilized resources, track risks like scope changes or cost increases, and measure performance against goals[12]. Cloud-based updates ensure that all stakeholders have access to the latest information in real time, speeding up decision-making and improving responsiveness to market shifts. These streamlined workflows make managing portfolios more efficient and proactive.
"Dashboards offer unparalleled transparency. They provide real-time insights into project health, enabling faster and better-informed decision-making."
– Vivian Au, Founder, Air Corporate [12]
Together, these integrated features form the backbone of platforms like CoreCast, offering comprehensive reporting solutions from start to finish.
sbb-itb-99d029f
CoreCast: An End-to-End Platform for Asset Class Dashboard Management
CoreCast is redefining how real estate professionals manage portfolios by offering real-time, customizable analytics in one integrated platform. Tailored for the fast-paced demands of the real estate industry, this SaaS platform equips users with the tools they need to make informed, data-driven decisions. With accuracy and timing being critical, CoreCast ensures professionals have immediate access to insights that matter.
One of the platform's standout features is its ability to process and deliver insights right after data is generated. This aligns with findings that businesses using real-time analytics see a 30% drop in decision delays and a 25% boost in forecast precision. For professionals juggling diverse asset classes and complex portfolios, these improvements can lead to better investment results.
Core Features of CoreCast
CoreCast offers a range of features designed to support every phase of the real estate investment process. Here’s what makes it indispensable:
- Underwriting for all asset classes: From multifamily to industrial, everything is handled within one platform.
- Deal pipeline management: Tracks deals at every stage, ensuring nothing falls through the cracks.
- Integrated mapping: Provides visual insights into properties and competitive landscapes.
- Comprehensive portfolio analysis: Aggregates data across holdings for a clear view of performance.
These features streamline portfolio management, cutting down on delays and consolidating insights to improve decision-making. The platform also includes a stakeholder center, a communication hub where investors, partners, and team members can access key data. Automated, branded reports enhance transparency, addressing a common concern - 57% of executives say their boards lack understanding of other stakeholders' priorities.
"Integrated reporting fosters transparency by providing stakeholders with a holistic view of organizational performance and value creation." - Integrated Hub
How CoreCast Supports Real Estate Professionals
CoreCast's real-time analytics empower users to monitor cash flow, track expenses, and even detect fraud instantly, contributing to financial stability and profitability. It also helps predict demand and refine investment strategies, reducing risks tied to decision-making.
Customizable dashboards provide the flexibility teams need. Users can set up alerts for critical data points, enabling proactive monitoring to spot trends and anticipate market changes. CoreCast’s cross-functional integration ensures seamless data flow across operations, whether it's evaluating acquisitions, tracking asset performance, or preparing investor updates. This eliminates the errors and delays often caused by disjointed systems.
Mobile accessibility is another game-changer. Whether you're in the office, inspecting properties, or meeting with stakeholders, CoreCast ensures you have real-time insights at your fingertips.
What CoreCast Is (and Is Not)
CoreCast is a real estate intelligence platform, not a property management or bookkeeping tool. While it integrates with property management systems, its primary focus is on advanced analytics and decision-making, not day-to-day tasks like rent collection or maintenance scheduling.
The platform excels at aggregating data from multiple sources to deliver strategic insights. Users rely on CoreCast for evaluating acquisitions, analyzing portfolio performance, and stakeholder communication - tasks that demand high-level analytics rather than basic operational management.
CoreCast also leverages AI-driven automation to enhance analytical processes, providing insights while preserving the critical role of human judgment in investment decisions.
Pricing Structure
CoreCast is currently in beta at $50 per user per month. Once fully launched, it will offer tiered pricing to suit different needs: a free option, Essentials at $75 per user per month, and Pro at $100 per user per month. This ensures that teams of all sizes can access advanced real estate analytics without sacrificing functionality.
Conclusion: The Impact of Asset Class Dashboards on Portfolio Management
Asset class dashboards have become game-changers for portfolio management, enhancing efficiency in analysis, speeding up decision-making, and improving communication with stakeholders. A striking example: 75% of top-performing investors rely on these advanced tools to keep a close watch on their investments.
By centralizing data, these dashboards eliminate the chaos of juggling multiple spreadsheets, reducing errors and ensuring that all information is up-to-date. Real-time analytics take forecasting to the next level, increasing accuracy by 20%, while machine learning adds another 30% boost in precision.
The ability to respond quickly to market changes is another major advantage. With 75% of organizations reporting better decision-making thanks to real-time dashboards, these tools are crucial when market prices fluctuate by the minute. They enable swift action to protect capital and seize opportunities. Additionally, shared digital tools enhance communication efficiency by over 40%, and automated rebalancing can lead to annual returns that are 2% higher compared to manual methods.
Integrated reporting features also transform stakeholder communication. Case studies show that centralized portals can increase investor engagement by up to 70%, while automating investor reporting can cut operational workloads by as much as 50%. Automated reporting further saves time, reducing data compilation efforts by up to 40% and improving accuracy.
Platforms that bring all these capabilities together are setting new standards. Take CoreCast, for example - it combines underwriting, pipeline management, portfolio analysis, and stakeholder communication into a single, seamless platform. By eliminating inefficiencies caused by disconnected tools, CoreCast dramatically reduces reporting time and offers pricing options that make it accessible. It’s a clear demonstration of how integrated dashboards can redefine portfolio management.
FAQs
How do customizable asset class dashboards improve portfolio management for real estate professionals?
Customizable asset class dashboards give real estate professionals a powerful way to bring all their critical data together in one simple, user-friendly platform. With these dashboards, users can monitor key metrics like valuations, occupancy rates, income, and sales as they happen, making it easier to make quick, well-informed decisions.
These tools also streamline portfolio analysis by providing a clear view of KPIs such as ROI, tenant turnover, and deal progress. They make it easy to spot trends and uncover opportunities across different asset classes. By centralizing this information, professionals can work more efficiently, plan strategically, and manage portfolios with less hassle - keeping them ahead in a fast-moving market.
How does real-time data integration enhance asset class dashboards?
Real-Time Data Integration: A Game-Changer for Asset Dashboards
Real-time data integration brings a new level of precision to asset class dashboards, offering insights that are always current. With immediate access to key metrics, you can track performance, spot emerging trends, and react to market shifts with greater agility.
This approach eliminates delays, sharpens decision-making, and supports proactive portfolio management. By tapping into real-time data, you gain the edge needed to navigate a fast-moving market and make well-informed investment decisions.
How can customizable dashboards help real estate teams focus on what matters most?
Customizable dashboards give real estate teams the tools to focus on the metrics and data that matter most to their objectives. Whether it’s keeping tabs on key performance indicators (KPIs), tracking deal pipelines, analyzing property portfolios, or managing stakeholder information, these dashboards bring everything together in one convenient place.
Teams can also personalize dashboards with their branding elements and integrate them smoothly with existing tools. This ensures workflows stay efficient while enabling data-driven decisions. By addressing the unique needs of each team, these dashboards simplify operations and support more effective strategic planning.