
How to Build CRE Portfolio Models
Building a Commercial Real Estate (CRE) portfolio model involves analyzing multiple properties together to assess risk, predict returns, and optimize performance. Unlike single-property analysis, portfolio modeling looks at how properties interact, uncovering risks and opportunities across the entire investment.
Key Takeaways:
Purpose: Combine property data for a full portfolio view to manage risk and improve decision-making.
Steps:
Collect and standardize property data.
Consolidate individual property models.
Perform scenario and sensitivity analyses.
Modern Tools: SaaS platforms like CoreCast simplify data aggregation, forecasting, and reporting compared to traditional spreadsheets.
Portfolio modeling is essential for investors managing multiple properties and seeking diversification. Below, we’ll explore the steps, tools, and methods to build effective CRE portfolio models.
Real Estate Portfolio Valuation Model
Core Elements of a CRE Portfolio Model
Creating a robust CRE portfolio model involves several key components that are essential for evaluating investment performance. These elements help provide a clear and actionable view of your commercial real estate investments.
Revenue and Expense Projections
An effective portfolio model starts with accurate revenue and expense forecasting. Revenue projections typically include base rents, reimbursements for NNN leases, parking fees, storage charges, and other ancillary income streams. To ensure reliability, these forecasts should be built using a mix of historical data, current market trends, and realistic expectations for the future.
When preparing revenue forecasts, comparing your proforma's proposed market rents with actual market comparables can help avoid overly optimistic assumptions. Factors like market rent levels, rent growth rates, and vacancy rates should be tested through sensitivity analyses to see how different scenarios might affect portfolio performance.
Expense projections should account for property taxes, insurance, utilities, maintenance, and management fees. Growth assumptions for these expenses should be carefully reviewed, often incorporating macroeconomic indicators such as inflation, interest rates, and exchange rates.
Reliable forecasts combine historical trends, real-time market insights, and customer behavior patterns. Using both static and dynamic forecasting methods can help reflect various growth scenarios.
Once revenue and expense projections are in place, the next step is to examine how financing structures and valuation metrics influence portfolio performance.
Financing and Valuation Metrics
Financing strategies in CRE largely depend on a property’s income, making accurate projections of Net Operating Income (NOI) and Debt Service Coverage Ratio (DSCR) essential.
To evaluate potential gains and risks, it’s crucial to look at a variety of return metrics. Relying on just one, like Internal Rate of Return (IRR) or Cash on Cash Return (CoC), can lead to an incomplete picture. Instead, incorporate a range of metrics such as Net Present Value (NPV), equity multiples, and risk profiles for a more thorough analysis. Other critical financial metrics include Capitalization Rate (Cap Rate), Loan-to-Value Ratio (LTV), and CoC. For strategies focused on cash flow, CoC and NOI are particularly important, while equity multiples and potential future value are better suited for appreciation-focused goals.
The timing and distribution of cash flows also play a big role in evaluating a property’s financial health. For instance, a high IRR might not accurately reflect the property’s condition if it doesn’t account for when cash flows occur. By combining multiple metrics and aligning them with your investment goals, you can gain a more complete understanding of your portfolio’s performance.
Another advantage of portfolio modeling is its ability to highlight the diversification benefits of CRE. Commercial real estate often has a low correlation with traditional asset classes like stocks and bonds, which can help balance risk when properties are analyzed collectively.
With financing and valuation parameters established, the focus shifts to defining exit strategies and assessing potential risks.
Exit Strategies and Risk Assessment
A strong portfolio model must include well-defined exit strategies. These strategies typically involve assumptions about sale or refinance scenarios, projected exit cap rates, and the use of sensitivity analyses to evaluate potential risks.
Exit cap rates require careful consideration, as they can vary widely depending on asset class, location, and market conditions. Using sensitivity analyses to model different exit cap rates can show how changes in the market might impact returns.
Risk assessment goes beyond basic sensitivity testing. It involves stress testing the portfolio under a variety of scenarios, such as economic downturns, interest rate changes, or market-specific challenges. This helps identify which properties or strategies might struggle in adverse conditions. Regularly revisiting return metrics is crucial, as the real estate market is constantly evolving. This iterative process helps investors adapt to new opportunities and challenges as they arise.
Financial models are invaluable for understanding the financial implications of potential investments. At the portfolio level, these models allow for comparing opportunities across different markets and asset types. The importance of such tools is underscored by the growth of the Portfolio Management & Investment Advice industry in the U.S., which has expanded at a compound annual growth rate of 6.1% over the past five years, reaching an estimated $543.9 billion in 2024. This growth highlights the increasing sophistication of real estate strategies and the role of comprehensive modeling in achieving investment success.
These foundational elements pave the way for deeper portfolio analysis using advanced tools and methodologies.
Step-by-Step Guide to Building a CRE Portfolio Model
Building a Commercial Real Estate (CRE) portfolio model involves turning property data into actionable insights. This process hinges on three main phases: collecting and standardizing data, consolidating property models, and running scenario and sensitivity analyses. Each phase plays a key role in creating a reliable framework for understanding and optimizing portfolio performance.
Data Collection and Standardization
The first step in creating an effective portfolio model is gathering and organizing property-level data. Consistency is crucial, regardless of property type.
Setting Data Standards
To ensure uniformity, standardize document formats and data fields across the portfolio. Use templates for rent rolls, operating statements, lease abstracts, and capital expenditure reports. Consistent naming conventions, date formats, and measurement units make it easier to combine data later on.
Improving Data Quality
Raw property documents often need processing to enhance quality. Techniques like image preprocessing can improve clarity, while tools such as Optical Character Recognition (OCR) and Intelligent Character Recognition (ICR) convert scanned documents into editable text formats.
Manual Data Checks
Even with automation, manual verification is critical. This step helps catch errors, redundancies, and inconsistencies, particularly in areas like lease terms, rent escalations, and expense reimbursement clauses - all of which directly affect cash flow projections.
Data collection often comes with challenges, such as handling high volumes of information, dealing with inconsistent formats, and integrating with existing systems. Technologies like Artificial Intelligence (AI), Machine Learning (ML), and Natural Language Processing (NLP) can help streamline these tasks, but human oversight remains vital for accuracy.
Consolidating Property-Level Models
Once data is standardized, the next step is to combine individual property models into a single portfolio view. This requires careful alignment of timing and calculation methods.
Standardizing Model Parameters
When all property models follow the same calculations and timeframes, consolidation becomes much simpler. For instance, using a consistent start date and analysis period allows for accurate comparisons across properties.
Key Cash Flow Metrics
At a minimum, each property model should include annual cash flows for effective gross revenue, net operating income, and capital expenditures. These metrics provide the foundation for portfolio-level calculations and insights.
Dynamic spreadsheets can make this process more flexible. Adding or removing property worksheets enables quick "what-if" analyses, allowing users to model various scenarios with ease.
Building a Unified Portfolio View
A well-designed portfolio model aggregates and analyzes multiple properties across asset types, locations, and strategies. This approach involves modeling cash flows at the property level and then combining them. The resulting view helps investors evaluate diversification, pinpoint underperforming assets, and make better capital allocation decisions.
Regular updates to the model ensure it reflects changing market conditions. Adjustments made to one property can automatically update the entire portfolio.
With the portfolio view in place, the next step is to test the model under different market conditions.
Running Scenario and Sensitivity Analysis
The final phase transforms static models into dynamic tools for decision-making by testing various assumptions and market scenarios.
Focusing on Key Variables
Sensitivity analysis examines how changes in key variables - like interest rates, property prices, rental income, operating expenses, cap rates, and construction costs - affect property values and returns. It's important to focus on variables with the most significant impact and to test realistic changes.
Developing Scenarios
Effective modeling includes multiple scenarios, such as best-case, worst-case, and base-case outcomes. Base assumptions should be grounded in reliable market data and historical trends, while scenario ranges should remain realistic and relevant.
Real-World Impact
Changes to key variables can significantly affect cash flows and returns. For example, if the cap rate increases from 6% to 7%, a property’s value could drop from $1,166,667 to $1,000,000. Conversely, a decrease to 5% might raise the value to $1,400,000.
Techniques for Analysis
Excel data tables are a practical way to analyze how different assumptions impact returns. Single-variable analysis focuses on one factor at a time, while two-variable analysis explores the combined effects of two inputs. Integrated cash flow models, which connect acquisition, operation, financing, and exit phases, further simplify this process.
Accurate and up-to-date input data is essential for meaningful sensitivity analysis. Presenting results clearly, while incorporating market knowledge, helps stakeholders make better decisions.
Modern platforms like CoreCast streamline this entire process, offering tools for portfolio analysis, scenario testing, and report generation - all within one system. This eliminates the need for manual data transfers and minimizes errors, making CRE modeling more efficient and reliable.
Transform Real Estate Data into Confident Decisions
Join Corecast to streamline your real estate operations, gain real-time insights, and make smarter investment decisions with a unified platform.
Tools and Methods for Portfolio Analysis
Modern analytical tools have revolutionized CRE portfolio management, turning what used to be tedious manual tasks into streamlined processes that deliver actionable insights. With the workflow automation market projected to hit $50 billion by 2028, growing annually by 33%, it's clear that automation is reshaping real estate operations. In fact, 90% of workers report increased productivity thanks to automation solutions.
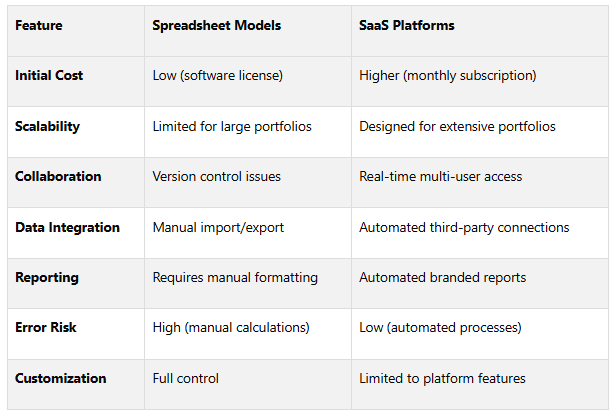
Spreadsheet Models vs. SaaS Platforms
For years, spreadsheet models have been a staple for CRE professionals. However, with the rise of SaaS platforms, many are rethinking their approach. Choosing between these options often depends on the size of your portfolio, its complexity, and how much collaboration is required.
Spreadsheet models offer complete control over calculations and formatting, making them highly customizable. But as portfolios grow, they can become cumbersome, prone to errors, and difficult to manage collaboratively. Version control issues and manual data entry only add to the challenges, and creating polished reports requires significant effort.
On the other hand, SaaS platforms like CoreCast provide an all-in-one solution. They handle everything from underwriting to stakeholder reporting, offering real-time collaboration, automated data updates, and built-in visualization tools. These platforms eliminate version control problems, reduce human errors, and simplify reporting.
Nearly 90% of professionals say automation tools help minimize errors and speed up decision-making. This comparison highlights how automation and data visualization can elevate portfolio analysis to the next level.
Automation and Data Visualization
Automation has fundamentally changed how CRE professionals approach portfolio analysis by removing repetitive tasks and delivering immediate insights. A reported 85% of users experience improved collaboration when using automated workflows.
Workflow automation simplifies repetitive processes, such as updating property valuations when market data shifts, generating alerts for metrics outside target ranges, or scheduling stakeholder reports. These efficiencies reduce manual work and ensure critical tasks are handled promptly.
AI tools are also making waves in CRE by processing vast amounts of data, automating tasks, and delivering insights. Spending on AI-powered applications has surged by over 75% in the past year, with 77.6% of IT leaders increasing investments in SaaS apps for their AI capabilities.
Data visualization is another game-changer. Interactive dashboards make it easier to grasp complex metrics, offering clear snapshots of portfolio performance. Integrated maps provide a geographic view of properties and competitive landscapes, helping professionals spot trends, outliers, and opportunities that might otherwise go unnoticed in traditional spreadsheets.
Modern platforms simplify data integration by automatically pulling information from property management systems, market data providers, and financial institutions. This eliminates the need for manual imports, ensures consistency, and reduces the time spent preparing data.
Key benefits of automation include faster decision-making and enhanced compliance tracking. AI tools can detect anomalies, enforce governance policies, and manage compliance automatically, helping portfolio managers address issues before they escalate.
Creating Stakeholder Reports
Once automated insights and visual dashboards are in place, effectively communicating results to stakeholders becomes crucial. Nearly two-thirds of CFOs rank task automation as a top priority, particularly for streamlining reporting processes that often drain time and resources.
Branded reporting allows organizations to present professional, polished reports that reflect their identity. These reports can include logos, color schemes, and custom formatting to reinforce brand recognition.
Automated report generation eliminates the need for manual data transfers and formatting. After templates are set up, reports update automatically with the latest portfolio data. This ensures stakeholders receive accurate, timely information without staff spending hours on preparation.
Customization is another major advantage. Different stakeholders have different priorities - investors might focus on returns and risks, lenders require cash flow projections, and property managers need operational metrics. Automated systems can generate tailored reports for each group, all based on the same underlying data.
Centralized stakeholder portals further enhance communication by providing secure, real-time access to reports and dashboards. Instead of emailing static files, stakeholders can log in to view current information and download reports as needed. This approach reduces administrative workload and increases transparency.
Conclusion
Create effective CRE portfolio models by focusing on standardized data, consolidating property-level models, conducting thorough scenario analyses, and leveraging modern technology to produce insightful stakeholder reports.
Summary of the Modeling Process
Ensure model accuracy by keeping market and property data up to date, applying variance and sensitivity analyses, and refining standardized templates to minimize errors.
"Best practices in real estate financial modeling maximize a project's potential success. The key to all best practices is their simplicity, clarity, accuracy, and efficiency. By focusing on these qualities, the model will provide investors with a reliable framework ensuring sound decision-making." - Corey Philip, Owner, Wisdify
By following these structured practices, you can establish a strong foundation for managing CRE portfolios effectively.
Future-Proofing CRE Portfolio Management
The landscape of CRE is shifting toward integrated, data-driven platforms that handle everything from underwriting to stakeholder reporting. Tools like CoreCast provide seamless data integration, advanced analytics, interactive dashboards, and automated KPI tracking, offering a complete view of portfolio performance. Scalable standardization ensures consistent data formats, enabling complex analyses across various property types and strategies.
Adopting these comprehensive platforms can streamline processes like underwriting, pipeline management, and stakeholder reporting - allowing teams to dedicate more time to strategic decision-making.
FAQs
-
SaaS platforms like CoreCast bring a host of advantages to managing commercial real estate (CRE) portfolios, leaving traditional spreadsheets in the dust. Unlike static spreadsheets, these platforms offer real-time data updates and dynamic analysis, which means decisions can be made faster and with greater accuracy. Plus, by automating data entry and calculations, they cut down on human errors, ensuring the information you rely on is consistent and trustworthy.
Another major perk is scalability. SaaS platforms are built to handle complex workflows, making them perfect for portfolios that are expanding or becoming more intricate. With features like portfolio insights, pipeline tracking, and integrated analytics, they simplify operations and save valuable time. Tools like CoreCast even let you manage everything - from underwriting to stakeholder reporting - all in one place, eliminating the chaos of bouncing between multiple spreadsheets.
-
Scenario and Sensitivity Analyses in CRE Portfolio Modeling
Scenario and sensitivity analyses play a crucial role in refining decision-making for commercial real estate (CRE) portfolio modeling. These methods allow investors and developers to explore how shifts in critical factors - like interest rates, occupancy rates, or construction expenses - can influence financial outcomes such as Net Present Value (NPV) and Internal Rate of Return (IRR).
By modeling various market scenarios and testing different assumptions, these techniques help stakeholders uncover potential risks, assess new opportunities, and fine-tune their strategies. The result? Better-informed decisions and a stronger ability to adapt to unpredictable market conditions.
-
To ensure accuracy and consistency in commercial real estate (CRE) portfolio models, begin by thoroughly validating all data inputs. Make sure the information is complete, precise, and reflects the most current details available. Regularly compare your data with actual performance metrics and market benchmarks to catch any inconsistencies early.
Where possible, simplify calculations to reduce the chance of errors and make data management smoother. Accurately integrating historical data with future projections is also crucial for dependable analysis. Additionally, using tools or platforms that centralize data and offer real-time insights can greatly improve both the consistency and efficiency of your portfolio modeling efforts.