
Property Investment Analysis: 5 Key Metrics to Track
Investing in real estate? To make smart decisions, you need to focus on five key metrics that reveal a property's financial performance:
Net Operating Income (NOI): Measures profitability by subtracting operating expenses from income. It's the foundation for evaluating property performance.
Cap Rate: Compares returns across properties by dividing NOI by market value. Helps assess risk and market trends.
Cash-on-Cash Return: Shows immediate returns on your cash investment, factoring in financing.
Internal Rate of Return (IRR): Evaluates long-term profitability, considering cash flow and property appreciation.
Debt Service Coverage Ratio (DSCR): Assesses whether a property's income can cover its debt payments.
Each metric offers unique insights, but together they provide a complete picture of an investment's potential. Platforms like CoreCast simplify tracking these metrics, making it easier to analyze opportunities and manage portfolios efficiently.
Key takeaway: Use these metrics to reduce risk, compare properties, and optimize financial performance.
12 Must-know Real Estate Investing Metrics For Success
Net Operating Income (NOI): Measuring Property Profitability
Net Operating Income (NOI) is a key metric in real estate investment analysis. It simplifies a property's financial performance by subtracting operating expenses from its income. Essentially, it reveals how much a property earns before considering financing or taxes. This makes NOI an essential tool for evaluating a property's profitability and comparing it to others.
The formula is simple:
NOI = Gross Rental Income − Operating Expenses
This straightforward calculation allows investors to directly compare properties without the influence of financing or tax strategies.
“Net operating income (NOI) is a formula that real estate professionals often use to quickly calculate the profitability of a particular investment.”
What sets NOI apart is its focus on the property's operational performance. Unlike other financial metrics that can be influenced by external factors, NOI provides a clear, unbiased view of how a property performs in the market.
How to Calculate NOI with U.S. Conventions
To calculate NOI, subtract the property's operating expenses - such as property taxes, insurance, utilities, and maintenance - from total revenue sources like rent, parking fees, and amenities. It's important to note that mortgage payments, capital expenditures, depreciation, amortization, and income taxes are not included in this calculation.
For example, consider Prologis' 2022 financials:
Rental Revenues: $4,913,000,000
Other Revenues: $21,000,000
Rental Expenses: $1,206,000,000
Other Expenses: $40,000,000
Using the NOI formula, the calculation looks like this:
$4,913,000,000 + $21,000,000 − ($1,206,000,000 + $40,000,000) = $3,688,000,000
This example shows how NOI translates financial data into actionable insights [Source: PLD 10-K].
Why NOI Matters for Investment Analysis
NOI plays a critical role in assessing property performance. It's the foundation for calculating important metrics like capitalization rates (cap rates), debt service coverage ratios (DSCR), and cash-on-cash returns. Accurate NOI figures are vital for making informed investment decisions.
Lenders also rely on NOI to evaluate loan applications. It helps determine whether a property generates enough income to cover its debt obligations through the debt coverage ratio. For investors, understanding NOI allows for effective benchmarking, helping to identify underperforming properties or areas for improvement. Properties with steady or increasing NOI are often seen as lower-risk investments, while declining NOI can signal potential problems with management, market conditions, or the property itself.
Investors often compare NOI ratios to industry benchmarks. For commercial properties, a healthy NOI is typically above 15% of the investment cost, while businesses may aim for ratios of 20% or higher.
The practical value of NOI lies in its ability to guide improvements. Property owners can increase NOI by adjusting rents to reflect market conditions, cutting costs through energy-efficient upgrades, or streamlining property management to reduce operating expenses. These strategies not only enhance NOI but also improve overall investment performance.
Cap Rate: Comparing Market Returns
The cap rate, calculated as Net Operating Income (NOI) divided by the current market value, is a key metric for comparing returns across real estate investments. Think of it as the real estate equivalent of earnings yield in the stock market - it shows the annual return you’d earn if you bought a property outright with cash.
Cap Rate = Net Operating Income (NOI) ÷ Current Market Value
This formula levels the playing field, allowing investors to compare properties of varying sizes, locations, and price points. For example, a property with an NOI of $100,000 and a market value of $1,250,000 would yield a cap rate of 8.0%.
In the U.S., average cap rates climbed from 6.4% in 2023 to 7.2% by late 2024, highlighting the metric’s importance in evaluating market trends and investment risks.
How Cap Rate Relates to Risk
Cap rates aren't just about returns - they also provide a snapshot of investment risk. Lower cap rates often signal a safer, more stable investment, while higher cap rates suggest greater risk but also the potential for higher returns.
For instance, a 4% cap rate might indicate a steady, low-risk property but could also mean a longer timeline to recoup your initial investment. Generally, cap rates between 5% and 10% are considered reasonable, though the ideal range depends on market conditions and specific property characteristics.
Location plays a significant role in cap rate variation. Properties in high-demand, stable areas tend to have lower cap rates, reflecting reduced risk. On the flip side, properties in transitional or less desirable neighborhoods often come with higher cap rates.
Different property types also influence cap rates due to varying risk profiles. Factors like supply and demand, operational complexity, and market performance all come into play. Between Q2 2023 and Q3 2024, cap rates for multifamily, industrial, and office properties rose by at least 0.4%, although this was a smaller jump compared to the previous year’s increases of 0.8% or more.
“We’re now in a post-pandemic interest rate and cap rate environment, very different from what existed in 2019 and for 10 or 20 years prior. The result has been significant value adjustments unrelated to a building’s intrinsic worth.”
External economic factors, such as interest rates, also shape cap rates. As of November 2024, the 10-year U.S. Treasury Rate stands at 4.321%, serving as a baseline for risk-free returns. When Treasury yields rise, investors often demand higher cap rates to justify the increased opportunity cost of investing in real estate.
Cap Rate Comparison Table
Here’s a snapshot of cap rates across major U.S. markets and property types:
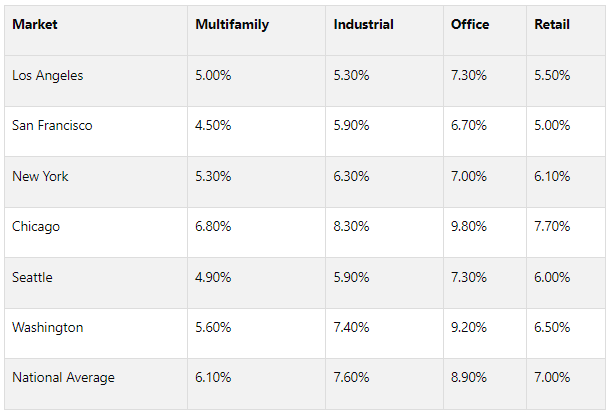
Source: Q3 2024 data [8]
A few key takeaways emerge from this data. Coastal cities like San Francisco and Los Angeles typically feature lower cap rates, reflecting their status as stable, high-demand markets. Meanwhile, Chicago shows higher cap rates, particularly for office properties at 9.80%, signaling either higher risk or potential value opportunities.
Office properties consistently show the highest cap rates across all markets, with a national average of 8.90%. This reflects ongoing challenges in the sector, such as high vacancy rates and uncertainty around future demand. Industrial properties, on the other hand, generally have lower cap rates (7.60% nationally), driven by strong demand from e-commerce.
Year-over-year changes reveal some interesting trends. Most markets experienced cap rate increases of 0.40% to 0.90%, with office properties seeing the largest jumps. A notable exception is Seattle retail properties, where cap rates remained steady, while Chicago office properties saw a sharp 0.90% rise.
For investors, these variations highlight opportunities and risks. For example, a multifamily property in Chicago with a 6.50% cap rate might warrant closer scrutiny, as it falls below the local average of 6.80% for that type of asset.
Cash-on-Cash Return: Measuring Immediate Equity Returns
While cap rates give you a broad view of a property's overall performance, cash-on-cash return zeroes in on the cash you’ve actually invested. This metric is especially useful for leveraged properties, where financing plays a big role in increasing your buying power.
Cash-on-cash return is calculated as the annual pre-tax cash flow divided by the total cash invested, expressed as a percentage. Unlike cap rates, this metric focuses on the mix of cash and debt financing rather than assuming an all-cash purchase.
Cash-on-Cash Return = (Annual Pre-Tax Cash Flow ÷ Total Cash Invested) × 100%
This formula tells you how much return you’re getting for every dollar you’ve put into the investment. For example, if you invest $250,000 (including your down payment, closing costs, and initial repairs) and the property generates $20,000 in annual pre-tax cash flow, your cash-on-cash return would be 8.0%.
This metric becomes particularly valuable when comparing various investment opportunities or financing structures. A property that might seem average based on its cap rate could stand out when favorable financing terms are factored in.
How to Calculate Cash-on-Cash Return
To calculate cash-on-cash return, you’ll need two main figures: your annual pre-tax cash flow and your total cash invested. Annual pre-tax cash flow is calculated by subtracting debt service payments from your net operating income (NOI). Total cash invested includes your down payment, closing costs, immediate repairs, and any other upfront expenses.
Here’s a real-world example: Let’s say you purchase a $1,500,000 multifamily property in Denver. You make a 25% down payment ($375,000), pay $15,000 in closing costs, and spend $35,000 on repairs, bringing your total cash invested to $425,000.
The property generates $180,000 in annual rental income and has $45,000 in operating expenses, leaving a net operating income (NOI) of $135,000. After accounting for $85,000 in annual mortgage payments (principal and interest), your pre-tax cash flow is $50,000.
Now, calculate the cash-on-cash return:
($50,000 ÷ $425,000) × 100% = 11.76%
This example highlights how leverage can enhance returns. A smaller down payment might increase your cash-on-cash return, though it comes with higher risk and debt obligations. Conversely, a larger down payment could lower your return percentage but offer more stability. This metric not only measures immediate equity performance but also informs your financing and investment decisions.
How Investors Use Cash-on-Cash Return
Cash-on-cash return, alongside cap rate and NOI, provides a well-rounded picture of both immediate cash flow and long-term value potential. Investors rely on this metric to compare different opportunities and assess the attractiveness of various deals. Typically, a higher cash-on-cash return signals a more appealing investment, though it’s crucial to weigh the risks involved.
For short-term rental properties, many investors aim for a minimum return of 10%, with some targeting 15% or higher for strong cash flow. Exceptional returns - 20% or more - are possible in high-demand areas. Traditional rental properties often target returns in the 8%-12% range.
This metric is also a powerful tool for evaluating financing options. It helps investors understand how much cash flow they can expect relative to the equity they’ve invested, and it aids in balancing debt and equity in their portfolios. Smart investors use cash-on-cash return to set performance goals and analyze a property’s expense structure, as higher expenses typically mean lower returns.
To improve cash-on-cash returns, investors can explore strategies like dynamic pricing, cutting costs, or refinancing to secure lower interest rates.
That said, cash-on-cash return shouldn’t be viewed in isolation. It’s important to pair it with other metrics, such as ROI and cap rate, for a more complete analysis.
Regularly monitoring cash-on-cash return is also crucial. Changes in rental income, expenses, or refinancing opportunities can all impact your returns. Keeping a close eye on this metric helps you spot underperforming properties or identify when market conditions call for strategic adjustments to your portfolio.
Transform Real Estate Data into Confident Decisions
Join Corecast to streamline your real estate operations, gain real-time insights, and make smarter investment decisions with a unified platform.
Internal Rate of Return (IRR): Measuring Long-Term Profitability
While cash-on-cash return focuses on your investment's current performance, Internal Rate of Return (IRR) is all about evaluating long-term results. In simple terms, IRR is the discount rate that makes the net present value (NPV) of all cash flows from your investment equal to zero. It essentially represents the annualized return over the entire lifespan of the investment.
What makes IRR particularly powerful is that it incorporates the time value of money - acknowledging that a dollar today holds more value than a dollar in the future. This feature makes IRR a go-to metric for comparing investments with different holding periods and cash flow patterns.
“IRR helps you compare your real estate investment to other opportunities. If this rate is higher than what you could get elsewhere, it’s a good investment. If not, you might want to reconsider.”
IRR calculations consider your initial investment, the yearly cash flow from rental income, and the final inflow when you sell the property. Unlike metrics that focus on a single period, IRR gives you an annualized return rate over the full investment timeline.
Let’s break it down with an example: Say you purchase an office building for $1,000,000. Over four years, you collect $125,000 annually in cash flow, and in the fifth year, you sell the property for $1,500,000. Using IRR, this investment would yield a 21.61% annual return - a strong result that reflects both steady income and property appreciation. This example shows how IRR brings together income and growth, making it an excellent tool for multi-year analysis.
IRR also shines when comparing investments across different asset classes. A higher IRR generally signals better profitability, but it’s essential to weigh it against your minimum acceptable return (hurdle rate) to decide if the investment meets your goals.
Using IRR for Multi-Year Investment Analysis
IRR goes beyond immediate returns, extending your analysis over the entire investment horizon. It’s particularly useful when assessing projects with different holding periods or cash flow patterns. For instance, it can help you evaluate how various exit strategies - like selling earlier or later - might impact your overall returns. IRR is also valuable for sensitivity analysis, showing how changes in assumptions can influence profitability.
Consider scenarios where rental income grows 3% annually instead of 2%, or where the property is sold two years ahead of schedule. These adjustments can highlight how resilient your investment is under changing conditions.
One thing to keep in mind: IRR assumes that cash flows can be reinvested at the same rate of return. For example, if your property generates a 20% IRR, the calculation assumes you can reinvest each year’s cash flow at 20%. This might not always be realistic, so it’s worth adjusting your analysis if reinvestment rates differ.
IRR Comparison Table
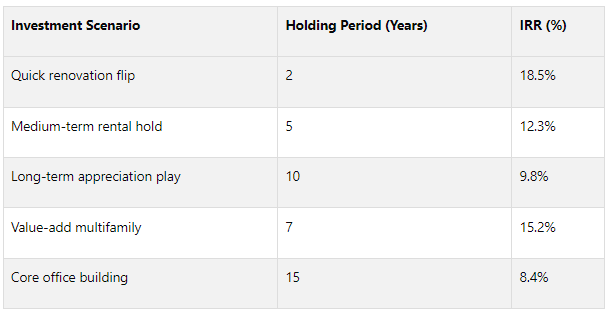
This table highlights how holding periods and strategies influence IRR outcomes. Short-term investments often achieve higher IRRs due to shorter timelines, while longer-term investments may deliver lower but steadier returns. The key is ensuring your IRR expectations align with your investment goals and risk tolerance.
Finally, it’s important to note that IRR doesn’t account for the size of your investment. For example, a $100,000 investment with a 15% IRR will generate less total profit than a $1,000,000 investment with a 12% IRR. By combining IRR with other metrics like NOI and cap rate, you can get a well-rounded view of your financial performance and make more informed decisions.
Debt Service Coverage Ratio (DSCR): Measuring Debt Sustainability
The Debt Service Coverage Ratio (DSCR) is a key metric that evaluates whether a property's income is sufficient to cover its debt payments. It’s calculated using the formula: DSCR = NOI ÷ Total Debt Service.
This ratio highlights how many times a property's income can cover its debt obligations, making it a critical measure of financial stability. While some metrics focus on overall returns, DSCR zeroes in on debt sustainability, answering a vital question: Can this property consistently meet its loan payments? This makes it an essential tool for investors analyzing risk and lenders assessing loan applications.
A DSCR above 1.0 indicates that the property generates more income than necessary to cover its debt payments, providing a financial safety net. For instance, a DSCR of 1.25 means the property earns 25% more income than its debt obligations, offering a buffer for unexpected costs or vacancies. On the other hand, a DSCR below 1.0 signals that the income is insufficient to meet debt payments, raising red flags about financial stability.
How DSCR Works in Real Estate Financing
Lenders heavily rely on DSCR to evaluate risk and typically set minimum DSCR thresholds, which can range from 1.2 to 1.5 depending on the property type and market conditions. A higher DSCR often leads to better loan terms, such as lower interest rates, higher loan amounts, or more flexible repayment options. Conversely, a lower DSCR may result in stricter loan conditions, like higher interest rates or larger down payment requirements.
Different types of properties come with varying DSCR expectations due to differences in risk and operating costs:
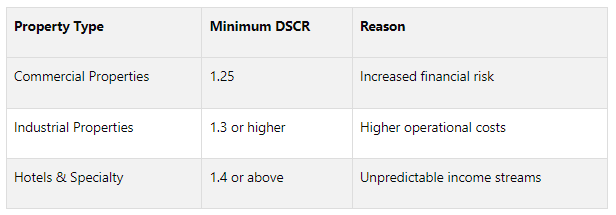
For example, commercial properties typically require a DSCR of at least 1.25 due to higher financial risks, while industrial properties might need a ratio of 1.3 or more because of their operational demands. Hotels and specialty properties often require a DSCR of 1.4 or higher to account for irregular income patterns. These thresholds emphasize the importance of DSCR across various real estate contexts.
To improve DSCR, focus on increasing NOI by raising rents or cutting expenses, or reduce debt service through a smaller loan or better financing terms.
DSCR Calculation Example
Let’s break this down with a real-world example. Imagine a multifamily property with the following financial data:
Annual rental income: $480,000
Operating expenses: $180,000
Net Operating Income (NOI): $300,000
Annual debt service (principal and interest): $240,000
Using the DSCR formula:
DSCR = $300,000 ÷ $240,000 = 1.25
This calculation reveals a DSCR of 1.25, meaning the property generates 25% more income than needed to cover its debt payments. This surplus provides a cushion for unexpected costs or market fluctuations.
For comparison, a DSCR of 1.4 would indicate a 40% income surplus, while a DSCR below 1.0 would signal insufficient coverage. It’s also important to note how external factors like interest rate changes or market conditions can impact DSCR. Rising interest rates, for example, could lower the DSCR during refinancing, while improving market conditions might increase rental income, boosting the ratio.
Regularly monitoring DSCR is essential, as the ratio can fluctuate with changes in NOI or debt service. To maintain a healthy DSCR, focus on reducing vacancies, cutting unnecessary expenses, and maximizing rental income. When market conditions are favorable, refinancing loans can also help improve debt service coverage and strengthen the overall financial performance of the investment.
Using CoreCast for Real-Time Metric Tracking
Keeping tabs on metrics like NOI, cap rate, cash-on-cash return, IRR, and DSCR is a breeze with an integrated platform. CoreCast simplifies decision-making by pulling all your real estate tools into one streamlined system. With real-time insights and efficient operations, it helps you make smarter investment moves. This builds on earlier discussions about metric tracking, providing a more unified approach to your investment decisions.
CoreCast combines market data, financial models, and investor information into one place, eliminating the hassle of pulling data from multiple sources. Forget the hours spent manually consolidating information - CoreCast does it for you.
“Before CoreCast, it took hours to consolidate financials from different systems. Now, we generate insights in minutes.”
Key Features for Metric Tracking
The Portfolio module is the nerve center for tracking all five key investment metrics in real time. Everything is displayed on a single dashboard, giving you a clear picture of your portfolio's health. You can access current valuations, historical trends, projected income, and expense breakdowns across asset classes - essential for calculating metrics like NOI and cap rates.
CoreCast tracks metrics such as Net Operating Income (NOI), Internal Rate of Return (IRR), Cap Rate Trends, Debt Service Coverage Ratios (DSCR), and Occupancy and Lease Expiry Schedules. A standout feature is its ability to provide monthly, quarterly, and annual views, making it easier to identify trends and address issues early.
The Underwriting module takes deal analysis to a new level with pre-built templates, customizable assumptions, and real-time scenario modeling. It lets you generate performance reports with a single click. Using historical data, market benchmarks, and user-defined inputs, CoreCast forecasts future performance scenarios while flagging any anomalies, ensuring your projections are reliable.
Another game-changing feature is the Pipeline Tracker, which organizes and monitors properties at every stage of your investment process. For example, a Director of Acquisitions at a REIT reported a major improvement:
“With the Pipeline Tracker, we reduced deal slippage by 30% over two quarters. The visibility and accountability it provides are game-changers.”
How CoreCast Simplifies Decision-Making
CoreCast connects data collection and decision-making seamlessly. It transforms raw metrics into actionable insights with detailed, real-time data. For example, when evaluating a property's cap rate, you can instantly view related data alongside your forecasts, enabling quicker and more informed decisions without toggling between different tools.
Real-time updates mean your data evolves as your forecasts do, giving you precise, up-to-date insights. This is particularly valuable when dealing with time-sensitive opportunities or rapidly shifting market conditions. You can also generate portfolio summaries that highlight past performance and future potential, helping you pinpoint which properties are exceeding or falling short of expectations.
“CoreCast transformed how we communicate portfolio performance to stakeholders. We now spend more time analyzing data, and less time assembling it.”
CoreCast also streamlines collaboration with stakeholders by offering customizable dashboards tailored to different audiences. Whether you're presenting to investors, lenders, or internal teams, you can highlight the most relevant metrics for each group.
Looking ahead, CoreCast plans to integrate with popular tools like Buildium, QuickBooks, and RealPage. This ensures a smooth data flow from your current systems, so you don’t have to overhaul your existing workflows. Instead, CoreCast acts as a centralized hub for all your investment metrics.
For those ready to move beyond spreadsheets, CoreCast offers early access to its Alpha version, with an Official Beta Launch slated for this summer and the full V1 release planned for Q1 2026.
Conclusion: Mastering Property Investment Metrics
Analyzing property investments effectively hinges on understanding five essential metrics: Net Operating Income (NOI), Capitalization Rate (Cap Rate), Cash-on-Cash Return, Internal Rate of Return (IRR), and Debt Service Coverage Ratio (DSCR). Each of these metrics offers a distinct perspective on property performance, and when evaluated together, they provide a well-rounded understanding that supports informed, risk-conscious decisions. Relying on just one metric can lead to oversights, but combining them ensures a more accurate picture of an investment's potential.
Taking a holistic approach to these metrics helps investors avoid missteps and seize opportunities with greater confidence. By looking at the full spectrum - NOI for profitability, Cap Rate for valuation, Cash-on-Cash Return for liquidity, IRR for long-term growth, and DSCR for debt management - you can avoid the pitfalls of focusing too narrowly on a single aspect of a property's performance.
In recent years, technology has become a game-changer in property investment analysis. Tools like CoreCast streamline the process by automating calculations and providing real-time insights. These platforms allow investors to save time, reduce errors, and act quickly when opportunities arise. The ability to consolidate and analyze metrics in one place makes decision-making faster and more precise.
Success in real estate comes from combining a sharp analytical mindset with the efficiency of modern tools. Mastering these metrics and using technology to track them effectively can help you identify top-tier opportunities, fine-tune your portfolio, and achieve better investment results. These metrics serve as your guide, while the right tools ensure you’re navigating the complexities of real estate with clarity and confidence.
FAQs
-
The Debt Service Coverage Ratio (DSCR) is an important measure used to determine whether a property generates enough income to cover its debt obligations. Generally, a DSCR above 1.2 is seen as a strong indicator, as it shows the property earns enough to meet loan payments while leaving room for unexpected costs or periods of vacancy.
Using DSCR as part of your investment strategy can help you make smarter financing choices, manage risks more effectively, and even negotiate better loan terms. This metric is particularly valuable when evaluating properties where rental income, rather than personal income, is the primary source for covering loan repayments.
-
Using CoreCast to keep tabs on real estate investment metrics comes with several advantages that can sharpen your decision-making and simplify portfolio management. With real-time data monitoring, you’ll have immediate access to essential metrics like cap rate, cash-on-cash return, and net operating income. This means you can act quickly and make well-informed decisions when it matters most.
Another standout feature of CoreCast is its automated reporting and analysis. By taking the guesswork and manual effort out of calculations, it saves you time and streamlines your workflow. With better visibility into how your investments are performing, CoreCast helps you spot opportunities, reduce risks, and fine-tune your investment strategy for maximum impact.
-
The Internal Rate of Return (IRR) is a key tool for evaluating real estate investments that have different timelines. It measures the annualized return on an investment by accounting for both the timing and size of cash flows. This approach allows investors to compare the performance of properties, even when their cash flow patterns or holding periods vary.
Since IRR considers the time value of money, it helps pinpoint which investment opportunities are likely to deliver better long-term growth. This makes it an essential metric for making well-informed and strategic decisions.