
Ultimate Guide to Real-Time Portfolio Visualization
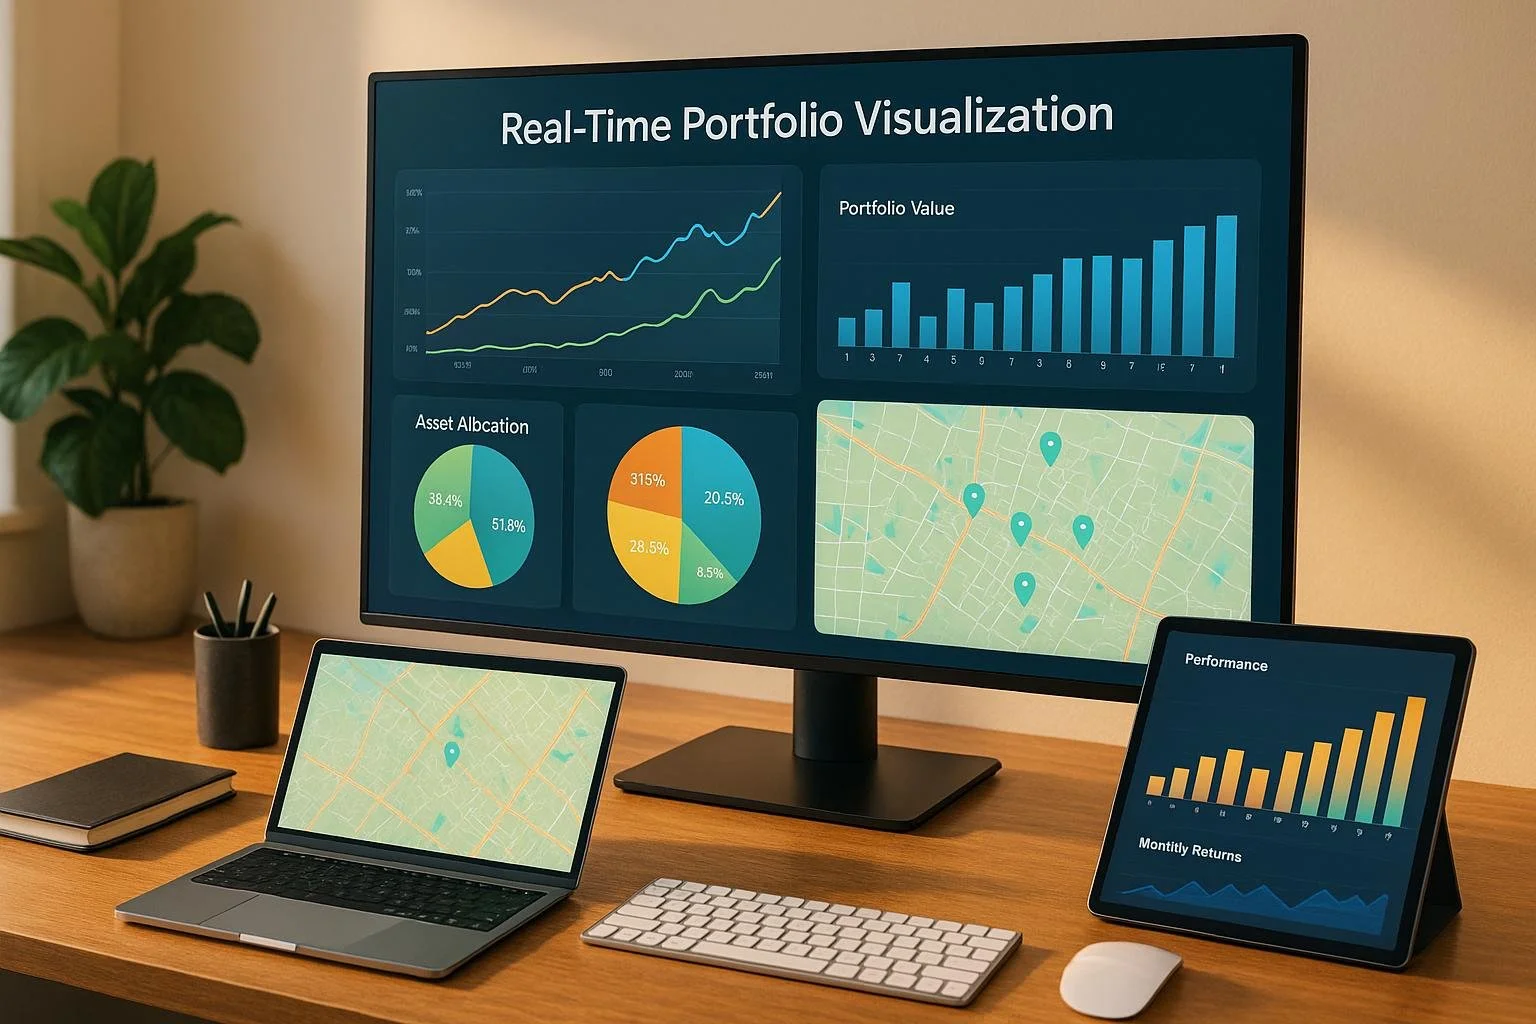
Real-time portfolio visualization is transforming how real estate professionals manage property data. Instead of relying on outdated reports, modern tools provide live updates, allowing users to track metrics like occupancy rates, rent growth, and tenant turnover instantly. This shift eliminates manual data entry, reduces errors, and enables faster decision-making.
Key Benefits:
- Live Dashboards: Access up-to-date insights on portfolio performance.
- Risk Management: Spot issues early with scenario modeling and trend analysis.
- Stakeholder Communication: Share automated, personalized reports effortlessly.
- Integrated Tools: Combine geographic mapping, financial data, and lease tracking in one platform.
Platforms like CoreCast centralize these capabilities, offering a single solution for managing assets, analyzing data, and improving communication with investors. By leveraging these tools, professionals can make informed decisions and stay ahead in a competitive market.
Benefits of Real-Time Portfolio Visualization
Real-time visualization is reshaping asset management by giving portfolio managers instant access to critical data. This enables quicker, more informed decisions that can drive stronger returns.
Complete Portfolio Oversight
Unified dashboards bring all portfolio data into one place, eliminating the need to switch between platforms or manually compile information. With just a glance, managers can assess portfolio health in seconds instead of spending hours piecing together data from fragmented systems.
This streamlined approach covers all asset types and stages of investment. Whether it’s tracking cash flow, valuations, debt levels, net operating income (NOI), or occupancy rates, all relevant data is centralized and updated automatically. This creates a comprehensive, up-to-date view of portfolio performance.
Automation reduces manual data entry and minimizes inconsistencies. Performance dashboards quickly highlight underperforming assets, giving managers the chance to address issues early before they escalate.
Integrated mapping tools add a geographic layer to portfolio oversight, showing spatial data like traffic patterns, demographics, flood zones, and competitive landscapes. This extra context supports faster, more informed decision-making.
As Tamer Celik, COO at VisioneCo, explains: "I needed a mixed-use development model that would impress key stakeholders. Their model provided an exceptional level of detail, making it easy to present insights to our investors."
These tools set the foundation for better risk management and communication, empowering portfolio managers to make more strategic decisions.
Better Risk Assessment and Mitigation
Real-time visualization shifts risk management from reactive to proactive. By monitoring key metrics as they occur, managers can spot emerging risks and take action to prevent losses.
Scenario modeling allows managers to simulate market conditions instantly. For example, they can test how changes in vacancy rates might impact cash flow or explore refinancing options without labor-intensive calculations.
Dashboards also make market trend analysis actionable. Information on rental rates, supply-demand dynamics, vacancy trends, and demographic shifts is presented in interactive formats, helping managers anticipate changes, seize opportunities in growing markets, and address potential threats.
Comparing property performance against industry benchmarks enhances risk assessment. Underperforming assets, like a property with low occupancy compared to peers, can be quickly identified and targeted for improvement.
Lease management tools play a key role in protecting revenue. By tracking lease expirations, rental escalations, and tenant performance in real time, managers can proactively address renewals and renegotiations. This approach minimizes vacancies and ensures steady cash flow.
Mitchell Rice, Principal at Elkstone Capital, notes: "As a capital raiser, having reliable financial analysis is crucial to building trust with investors. They provided the expert financial analysis support I needed to strengthen my efforts."
By combining real-time monitoring with scenario analysis, managers can reduce potential losses, maintain investor confidence, and develop contingency plans to manage risks effectively.
Improved Stakeholder Communication
Clear and timely communication builds investor trust, and real-time visualization tools make this process simpler and more effective.
Automated dashboards eliminate delays and errors from manual reporting. Instead of spending days preparing quarterly updates, managers can instantly share performance metrics - like internal rate of return (IRR), cash-on-cash return, or property-specific data - with stakeholders whenever needed.
Customizable reports cater to different stakeholder priorities. Investors can dive into detailed financials, while lenders can quickly access property performance and risk data.
Robert Dew, Principal at Castello Divino, recalls: "My banker was appalled with my partner's model. When he saw what The Fractional Analyst put together, the approval process was infinitely smoother."
Visual formats make even complex financial data easy to understand. Clear charts and graphs allow stakeholders to assess portfolio health at a glance. Secure access to key documents, personalized returns, and distribution timelines adds another layer of transparency and confidence.
Justin Britto, Principal at Maddison Communities AZ, shares: "Having a tailored and precise model became the cornerstone of our capital-raising efforts. Their ability to simplify complex structures gave me & my investors the confidence to move forward."
Key Metrics and Features of Portfolio Visualization Tools
Tracking the right metrics and utilizing advanced features are essential for turning raw data into actionable insights in real estate portfolio management. By focusing on what truly matters, professionals can make faster, well-informed decisions.
Key Performance Indicators for Real Estate Portfolios
Net Operating Income (NOI) is a cornerstone metric for assessing portfolio performance. It’s calculated by subtracting operating expenses from rental income, offering a clear picture of how efficiently a property is managed. If NOI trends downward, it could signal operational inefficiencies that need immediate attention.
Occupancy rates are another critical measure, reflecting tenant retention and leasing success. High occupancy rates indicate healthy portfolio performance, while addressing vacancies quickly can help minimize revenue loss.
Return on Investment (ROI) and Internal Rate of Return (IRR) are essential for evaluating profitability over time. These metrics help investors determine whether their capital is yielding expected returns and allow for comparisons across different properties or regions.
Cash flow projections offer a forward-looking view by comparing rent collections with upcoming expenses. This is especially useful during refinancing discussions or when considering new acquisitions.
Capitalization rates (cap rates) provide insight into potential returns by comparing rental income to property value. They help investors identify whether a property is overvalued or undervalued when benchmarked against market averages.
Lease expiration dates and rent growth metrics are vital for spotting revenue opportunities. Knowing when leases are up for renewal allows managers to negotiate better terms or prepare for turnover, while tracking rent growth ensures properties remain competitive with market rates.
Capital Expenditures (CapEx) and maintenance costs reveal the ongoing investment needed to maintain or improve properties. When analyzed alongside NOI, these numbers provide a clearer picture of a property’s true profitability.
Effective dashboards tailor KPI displays to different stakeholders. For example, investors often prioritize metrics like IRR and ROI, while operational managers focus on occupancy rates and maintenance costs. These insights set the stage for leveraging scenario modeling to make proactive decisions.
Scenario Modeling and What-If Analysis
Scenario modeling takes these metrics to the next level by turning data into actionable insights. By simulating market conditions, it helps managers assess risks and identify opportunities without the need for complex spreadsheets.
For example, scenario modeling can answer questions like, “What if vacancy rates rise by 10%?” or “How would refinancing at a higher interest rate impact cash flow?” These tools integrate historical and projected data, enabling managers to make informed, data-driven decisions quickly.
This capability allows for immediate actions, such as evaluating refinancing options, optimizing lease terms, or deciding whether to sell underperforming assets. Advanced platforms even use AI to offer recommendations based on historical data and market trends, helping managers allocate capital more effectively. Machine learning further accelerates complex simulations by analyzing multiple variables simultaneously.
Beyond simple “what-if” scenarios, these tools support contingency planning. By modeling how various economic conditions could impact a portfolio, managers can identify vulnerabilities and prepare mitigation strategies. Some platforms also offer backtesting and Monte Carlo simulations, providing insights into how portfolios might perform under thousands of potential market scenarios[6].
Integrated Mapping and Data Centralization
Integrated mapping adds a spatial layer to portfolio analysis, offering a perspective that traditional spreadsheets simply can’t match. These tools allow managers to view properties alongside market conditions, demographic trends, traffic patterns, and competitive landscapes - all within a single interactive display.
This spatial analysis reveals opportunities and challenges that might otherwise go unnoticed. For instance, managers can identify property clusters, evaluate market saturation, and assess how demographic shifts affect performance. Overlaying financial metrics on maps helps pinpoint regions delivering strong returns and areas needing strategic adjustments.
Advanced mapping tools bring significant analytical power. Some platforms can process over 150 million property records and millions of sales comparables while simultaneously displaying active listings in specific submarkets[5]. They also offer extensive filtering options - more than 200 criteria, including loan-to-value ratios, opportunity zones, property characteristics, and ownership structures[5]. In some cases, these tools can even uncover hidden ownership networks, linking properties under a single owner.
Data centralization amplifies the benefits of mapping. Modern platforms automatically generate performance reports with metrics like NOI, IRR, rent collections, and occupancy rates, organized by region, asset type, or time period. This eliminates the need for manual data entry, reducing errors and saving time.
Centralized dashboards integrate with property management systems, financial institutions, and market data sources to provide real-time updates. This ensures teams have access to accurate, up-to-date information, enabling quick and confident decision-making. Dashboards also visualize maintenance schedules, lease expirations, and tenant requests in one place, turning administrative tasks into strategic opportunities.
CoreCast brings all these tools together, offering real-time updates and streamlining decision-making across entire portfolios.
sbb-itb-99d029f
How CoreCast Supports Real-Time Portfolio Visualization
CoreCast combines all the tools real estate professionals need for portfolio management into a single, easy-to-use platform. Instead of juggling separate systems for underwriting, pipeline tracking, and reporting, CoreCast offers everything in one place - from deal analysis to stakeholder communication. Here’s how it simplifies portfolio management, reporting, and predictive analytics.
Complete Portfolio Management in One Platform
CoreCast streamlines every stage of portfolio management by unifying the entire investment lifecycle. Whether you're evaluating multifamily properties, retail centers, or industrial warehouses, the platform supports underwriting for any asset class or risk profile. Deals can be tracked from the initial pursuit phase through acquisition, management, and eventual sale.
One standout feature is its integrated mapping tool, which offers a geographic context that spreadsheets simply can’t provide. By overlaying properties with competitive landscapes and combining that with real-time financial metrics - like NOI, occupancy rates, and cash flow projections - the map becomes a powerful decision-making resource.
Portfolio summaries are generated instantly, giving managers the ability to review past performance and assess future potential across various property types, regions, or investment strategies. And because updates happen in real time, decisions are always based on the most current data available.
CoreCast also integrates seamlessly with property management systems like Buildium, QuickBooks, and RealPage. This means operational data flows directly into its analytics framework without the need to replace specialized tools. By breaking down data silos, CoreCast ensures professionals have the clarity and speed needed to make confident decisions.
Another key feature is the stakeholder center, which centralizes investor information and communication. Instead of juggling multiple contact lists or scattered email threads, users can manage all stakeholder relationships in one place. This proves especially useful for generating reports or quickly responding to investor inquiries.
Customizable Reporting for Stakeholders
Investor reporting can often be a time-consuming process, requiring hours of manual work to compile data, format spreadsheets, and maintain brand consistency. CoreCast automates this entire process while ensuring reports remain polished and professional.
The platform automatically generates performance reports using real-time metrics like IRR, Cash-on-Cash Return, occupancy rates, and location-specific data. These reports can be tailored to highlight the KPIs that matter most to different stakeholders. For example, institutional investors might prioritize IRR and market comparisons, while individual investors may focus on cash flow and distribution timelines.
Branded reports are another valuable feature. With the ability to incorporate a firm’s logo, color scheme, and formatting preferences, these reports reinforce a professional image. According to industry research, 87% of investors say having real-time data access increases trust in their investment manager[4]. This makes timely and transparent reporting essential for maintaining strong stakeholder relationships.
Looking ahead, CoreCast plans to introduce an Investor Relations feature that will give investors secure access to key documents, personalized returns, and distribution timelines. This will reduce administrative workloads and ensure stakeholders have on-demand access to the information they need.
The platform also allows for custom portfolio summaries tailored to specific audiences or purposes. A quarterly board presentation, for instance, might focus on high-level portfolio performance, while an asset-level report for operational managers would dive into property-specific metrics and actionable insights. This flexibility ensures every stakeholder gets the information they need without being overwhelmed by irrelevant details.
Beyond reporting, advanced analytics take data-driven decision-making to the next level.
AI and Advanced Features
CoreCast is developing AI-powered tools to enhance analysis and predict future performance. These features are designed to help professionals uncover opportunities within their portfolios by analyzing historical data and market trends.
For example, AI-driven recommendations might suggest capital improvements for underperforming properties, highlight assets with refinancing potential, or flag upcoming lease expirations that require attention. The system provides clear explanations for its suggestions, so users always understand the reasoning behind each recommendation.
Predictive analytics will also play a key role, forecasting future performance based on factors like historical trends, market conditions, and property-specific data. This allows professionals to model various scenarios and weigh potential outcomes before making decisions. For instance, the platform could estimate how rising interest rates might affect refinancing costs or predict the impact of demographic shifts on specific property types.
Additional advanced tools are in development, including expanded reporting capabilities and construction management features. These will allow users to monitor capital projects in real time alongside portfolio performance metrics, giving a clearer picture of how development activities influence overall returns.
By processing vast amounts of property data, CoreCast supports increasingly complex portfolio strategies in today’s data-driven real estate market. Combining real-time operational insights with AI-driven analytics transforms portfolio visualization into a forward-thinking strategic tool.
"They have seamlessly provided the expertise and support we needed to streamline our operations and make smarter, data-driven decisions."
- Clay Heighten, Principal, Caddis Healthcare RE[1]
The platform’s unified approach ensures that AI recommendations, predictive analytics, and construction tracking work seamlessly alongside existing underwriting, pipeline management, and reporting features. This integration eliminates the inefficiencies that often arise when firms rely on disconnected tools that don’t communicate effectively.
Conclusion
Real-time portfolio visualization has become a game-changer for real estate professionals managing complex, multi-asset portfolios. By integrating dashboards and tracking key performance indicators (KPIs), decisions that once required days can now be made in minutes. Whether it’s evaluating refinancing options, fine-tuning leasing terms, or identifying underperforming assets, this shift leads to higher returns, reduced risk, and stronger relationships with stakeholders[3].
The ability to act quickly also fosters proactive strategies. Real-time insights not only speed up decision-making but also uncover market trends and opportunities that might otherwise go unnoticed. Instead of reacting to changes, professionals can anticipate them. For example, analyzing seasonal trends and unit features can optimize rental income, while performance metrics can highlight lease renewal opportunities[2][7]. These insights go far beyond what traditional spreadsheets can offer.
CoreCast simplifies this process by consolidating the entire investment lifecycle - underwriting, pipeline tracking, mapping, analysis, and reporting - into a single platform. This eliminates inefficiencies caused by juggling disconnected tools and streamlines portfolio management.
With its integration into property management systems and the promise of AI-driven analytics, CoreCast transforms portfolio visualization into a strategic advantage.
Key Takeaways
For real estate professionals, platforms offering centralized data and real-time synchronization are essential. These features reduce manual reporting errors and free up time for strategic tasks. According to research, 87% of investors believe that access to real-time data builds trust in their investment manager[4]. This highlights the importance of timely, transparent reporting in strengthening stakeholder relationships.
Speed is critical. Rapid insights help safeguard investments, rebalance portfolios, and maintain a competitive edge. Firms that can quickly pinpoint underperforming assets are better positioned to implement improvement strategies[2].
Integrated mapping and geographic visualization add a layer of insight that traditional dashboards lack. Viewing properties alongside competitive landscapes and market conditions reveals how location-specific factors impact returns and risks, enabling smarter capital allocation decisions[2].
Scenario modeling and "what-if" analysis take portfolio management a step further. By simulating various market conditions - like a 10% vacancy rate’s effect on cash flow or how rising interest rates impact refinancing costs - professionals can craft effective risk management strategies[2][3].
Finally, customizable reporting ensures that stakeholders receive the metrics most relevant to their needs. Tailored reports streamline communication and reduce administrative overhead.
In today’s data-driven real estate market, real-time portfolio visualization is no longer optional. It’s the foundation for confident, informed decisions at every stage of the investment lifecycle. Firms that embrace these tools are better equipped to thrive in a competitive landscape.
FAQs
How can real-time portfolio visualization help real estate professionals make better decisions?
Real-time portfolio visualization gives real estate professionals the edge they need to make quicker, more informed decisions. By offering up-to-the-minute data on assets and market trends, it allows them to spot opportunities, evaluate risks, and fine-tune their strategies with precision.
With tools that display key metrics and property locations on an interactive map, users can easily grasp how their portfolio is performing and how it stacks up against the competition. This streamlined view cuts through complexity, making it easier to navigate the fast-moving real estate market with confidence.
What essential metrics should I monitor for effective real-time portfolio visualization in real estate?
To keep your real estate portfolio running smoothly, keeping an eye on essential metrics is a must. These include occupancy rates, net operating income (NOI), and cash flow, which give you a clear picture of how your properties are performing. On top of that, staying updated on market trends, asset appreciation, and the competitive landscape can help you make smarter, well-informed choices.
CoreCast makes this process easier by offering a centralized platform packed with real-time insights. With it, you can evaluate your portfolio, monitor deal pipelines, and even view properties on an integrated map. The result? Smarter investment decisions and more efficient operations driven by solid data.
How does scenario modeling and 'what-if' analysis help manage risks in real estate portfolios?
Scenario modeling and what-if analysis give real estate professionals the ability to explore potential outcomes and assess how they might impact portfolio performance. By simulating various market conditions, shifts in property values, or different investment scenarios, you can pinpoint weaknesses and plan ahead with strategies to reduce risks.
These techniques enable data-driven decision-making. For example, you can evaluate how economic changes, occupancy rate adjustments, or interest rate fluctuations might affect your financial standing. This approach strengthens your ability to protect investments and adjust your portfolio to perform effectively under a range of conditions.