
Benchmarking Private Real Estate Yields: A Guide
When investing in private real estate, understanding performance is challenging due to limited transparency and data. Benchmarking helps compare your investments against market standards, guiding better decisions. Key metrics like IRR, equity multiple, and NOI yield provide insights into returns and operational efficiency. Challenges include inconsistent data, regional differences, and complex calculations. Tools like MSCI indices, Cambridge Associates benchmarks, and public REIT comparisons can refine your analysis. Align benchmarks with your portfolio’s goals, property type, and location for accurate evaluations. Present data clearly for stakeholders, using tables or summaries to highlight performance gaps and opportunities.
The Most IMPORTANT Real Estate Return Metrics [+ How To Use Each]
Key Benchmarking Methods and Yield Metrics
When it comes to private real estate, effective benchmarking relies on applying the right methods and yield metrics. Each approach has its strengths and weaknesses, which can influence the accuracy of your analysis. Let’s break down some of the most commonly used methods and essential metrics for evaluating performance.
Common Benchmarking Methods
Time-weighted return (TWR) focuses on measuring the compound growth rate of a portfolio while adjusting for cash inflows and outflows. This makes it especially useful for excluding the impact of deposits and withdrawals. For instance, J.P. Morgan uses TWR to track portfolio growth. However, frequent cash flows can make TWR calculations more challenging for smaller operations.
Public Market Equivalent (PME) compares private real estate performance to what could have been achieved by investing in public markets, such as REITs or the S&P 500, over the same period. While PME provides a useful market-context comparison, it doesn’t account for private equity's unique challenges, like illiquidity and extended holding periods. Additionally, the choice of benchmark is subjective and can influence results.
Core Yield and Return Metrics
Internal Rate of Return (IRR) is one of the most widely used metrics because it considers the time value of money. IRR calculates the rate of return per period. However, it has limitations - it doesn’t measure absolute returns and can be misleading when comparing investments of different durations. For example, a $100,000 investment that generates $105,000 in one month results in an IRR of about 80%, even though the actual gain on capital is only 5%.
On the other hand, the equity multiple provides a clear view of absolute returns by showing the ratio of total cash received to total cash invested. For example, a 2.5× equity multiple means you receive $2.50 for every $1 invested. However, this metric doesn’t consider the time it takes to achieve those returns. In reality, neither IRR nor equity multiple is sufficient on its own - they are most effective when used together as part of a thorough investment analysis.
Additional metrics include:
Net Operating Income (NOI) Yield: This measures the annual NOI as a percentage of the property’s current value, offering insight into operational performance.
Cash-on-Cash Return: This evaluates annual cash flow relative to the actual cash invested, highlighting immediate income generation.
It’s also important to recognize that IRR calculations are typically limited to single assets and single periods. This makes them less reliable for benchmarking entire portfolios or comparing investments made at different times. For example, data from private equity index providers show that 10-year horizon IRRs generally fall between 14.3% and 18.5%, equating to returns of approximately 3.8× to 5.45× the invested capital over a decade. Meanwhile, some providers report an average TVPI multiple of 1.7× for vintages between 1996 and 2015, revealing a notable gap between compounded IRR figures and actual outcomes.
As Howard Marks of Oaktree Capital famously said:
“You can’t eat IRR.”
This quote underscores a critical point: while these metrics are valuable tools, they shouldn’t overshadow the ultimate goal - ensuring that an investment provides the cash flows and returns needed to meet your objectives.
Next, we’ll dive into the tools and data sources that can refine these benchmarking approaches.
Selecting and Using Market Benchmarks
Once you’ve established core yield metrics, the next step is aligning your investments with the right benchmarks. Why? Because the right benchmarks help you measure your private real estate portfolio’s performance with precision. The goal is to pair your portfolio’s characteristics with relevant market indices, while being mindful of the strengths and limitations each benchmark brings. This alignment not only sharpens your understanding of performance but also helps guide smarter asset management decisions.
Major U.S. Private Real Estate Indices
When it comes to U.S. private real estate, MSCI Private Asset Indexes are among the most recognized benchmarks. These indices cover a staggering $11 trillion in capitalization, drawing data from more than 15,000 funds and over 80 performance indexes. Their methodology emphasizes a globally standardized approach, delivering insights at both the asset and fund levels.
Here’s a quick look at some of MSCI’s key indices for U.S. private real estate:
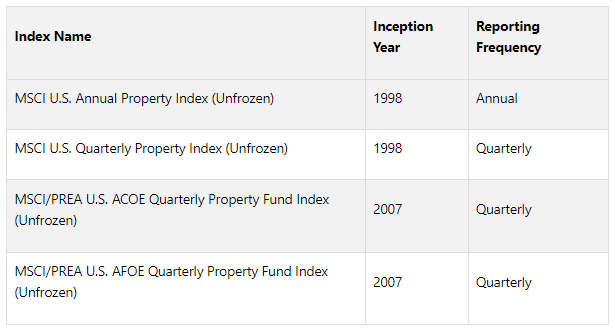
The quarterly indices provide ongoing performance updates, while the annual index offers a broader, year-over-year perspective. Notably, the ACOE (After Cost of Equity) and AFOE (After Fee of Equity) indices factor in fees, giving a clearer picture of actual investor returns.
Another key player in this space is Cambridge Associates, which has built its benchmarks on decades of experience in private capital markets. Their data comes directly from quarterly fund financial statements, ensuring transparency and accuracy. By combining private data with insights from industry players, government sources, and public markets, they provide a comprehensive view.
But private indices aren’t the only option. Public markets, particularly REITs, can also serve as valuable benchmarks.
Benchmarking with Public REITs
Public REITs (Real Estate Investment Trusts) offer an additional layer of benchmarking, thanks to their similar underlying assets. However, they bring their own set of opportunities and challenges.
Let’s talk performance. Over the past 25 years, REITs have delivered an impressive 9.74% average annual return - ranking second among 12 major asset classes analyzed. In fact, they outperformed private real estate within defined benefit plans by more than 2%, with private real estate generating an average net return of 7.66% during the same period.
John Worth, the Executive Vice President of Research and Investor Outreach at Nareit, highlights the value REITs bring to institutional portfolios:
“REITs can play a powerful role in institutional investor portfolios... REITs consistently delivered, on average, high annual net returns and low correlations with other asset classes in defined benefit plans... REITs’ outperformance of private real estate - affirm the value institutional investors unlock by using REITs as a key component of their real estate strategy.”
And it’s not just about raw returns. REITs also shine in risk-adjusted performance. They boast a Sharpe ratio of 0.39, one of the highest outside private equity and U.S. large-cap stocks. Plus, REIT returns show a strong correlation (0.90) with unlisted real estate, while maintaining relatively low correlation with equities.
That said, REITs aren’t without limitations. Their higher correlation to equities can lead to increased volatility. Additionally, their liquidity stands in stark contrast to private real estate investments, which often require higher minimum investments and are typically limited to accredited investors.
Maaike van Bragt from CEM Benchmarking sums it up well:
“REITs and unlisted real estate provide the same diversification benefits... However, only by bringing management of unlisted real estate in-house - where costs are typically lower - can it match the net returns achieved by REITs over the past 25 years.”
These insights make it clear that REITs, while valuable, should be used alongside other benchmarks for a more complete picture.
Property-Specific Factors
Selecting benchmarks isn’t a one-size-fits-all process - it depends heavily on the specifics of your portfolio. To truly capture performance nuances, benchmarks should align with factors like asset type, property quality, vintage, geographic focus, and investment strategy.
For example:
Office properties in major cities should be compared against office-focused indices.
Industrial properties benefit from industrial-specific benchmarks.
Mixed-use developments might require a custom blend of benchmarks to reflect their varied income streams.
Property quality and vintage also matter. Class A properties in prime locations will naturally outperform broader indices that include lower-tier assets. Similarly, newer properties may show different performance trends compared to older, stabilized ones.
Your investment strategy plays a big role too. Core properties with stable, long-term leases should be benchmarked against core indices, while opportunistic investments need comparisons with higher-risk, higher-return benchmarks. Value-add strategies often require a mix of benchmarks to account for their unique risk-return profile.
Finally, leverage levels can impact both volatility and returns, so it’s important to adjust your comparisons accordingly.
Transform Your Real Estate Strategy
Access expert financial analysis, custom models, and tailored insights to drive your commercial real estate success. Simplify decision-making with our flexible, scalable solutions.
Tools, Data Sources, and Best Practices for Benchmarking
When it comes to effective benchmarking, having access to reliable, high-quality data is non-negotiable. Trusted sources such as the NCREIF Property Index (NPI) for historical property-level returns and Cambridge Associates benchmarks derived from fund managers' financial statements are key players in this space.
The U.S. real estate investment platform market hit $14.8 billion in 2024, growing at an impressive 28% annual rate since 2020. Modern platforms now rely heavily on AI and analytics, with 67% utilizing these tools to predict rental yields and property values.
Custom-weighted pooled benchmarks are another valuable tool, allowing you to tailor comparisons by aligning market segment weights with your own portfolio allocations.
Comparing Data Collection Methods
The way you collect data can significantly impact the quality of your benchmarking. Here's a quick breakdown of three commonly used methodologies:
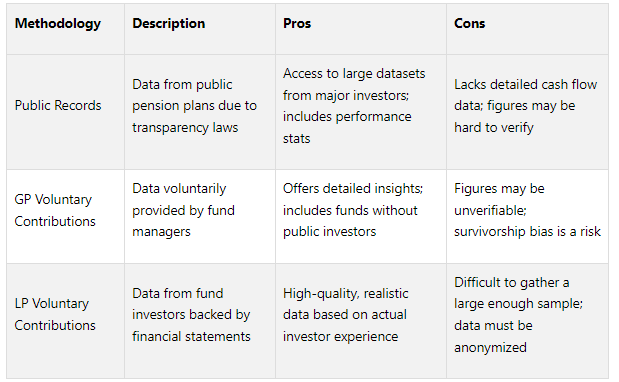
With dependable data, you can move forward with a systematic approach to customize benchmarks for your portfolio.
Best Practices for Benchmarking
Benchmarking isn’t a one-size-fits-all process - it should align with your portfolio’s specific goals and constraints. As Hamilton Lane puts it:
“Our benchmarking philosophy is that the benchmark that you select for your private market portfolio should reflect the goals, needs, and constraints of that same portfolio.”
Start by using both property-level and fund-level benchmarks. Property-level benchmarks help evaluate individual asset performance, while fund-level benchmarks offer a broader view of how your strategy stacks up against peers.
Keeping benchmarks up-to-date is equally important. Markets change constantly, so reviewing your benchmarks quarterly ensures they remain relevant and actionable.
Your benchmarks should also reflect your investment strategy and risk tolerance. For instance, multifamily IRRs typically range from 12% to 18%, but your target should depend on your specific focus. Core properties with steady income streams may require different benchmarks than value-add projects.
Focus on metrics that align with your investment goals. If cash flow is your priority, track net cash flow distributions versus your initial investment. For growth-focused strategies, key indicators might include rent increases, occupancy rates, and long-term asset appreciation. Maintaining occupancy levels of 90% or higher and keeping expense ratios between 40% and 50% are also critical benchmarks.
A dual approach - combining public and private market comparisons - can provide deeper insights. Public market data helps evaluate the opportunity cost of private investments, while private market comparisons focus on performance within the asset class.
Ellie Perlman, CEO of Blue Lake Capital, underscores this approach:
“By establishing your own benchmarks and leveraging insights from public market data, you can better evaluate the performance of your private real estate investments.”
Lastly, don’t overlook property-specific factors. Local market conditions, property class, and historical trends all play a role in crafting meaningful benchmarks.
How The Fractional Analyst Supports Benchmarking

The Fractional Analyst offers a range of tools and services to help you benchmark effectively. Whether you’re looking for tailored analytical support or prefer self-service options, they’ve got you covered.
Their financial analysts deliver customized insights that go beyond generic benchmarking, addressing your portfolio’s unique characteristics and goals. From the outset, their underwriting services analyze market data and comparable transactions to establish realistic performance expectations. Ongoing asset management support tracks key metrics like occupancy rates, rent growth, and expense ratios, comparing them to relevant indices and peer groups.
For those who prefer a hands-on approach, their CoreCast platform provides self-service benchmarking tools. Available during its beta phase for $50 per user per month (rising to $105 post-development), CoreCast gives you direct access to market data and analytical tools.
Additionally, The Fractional Analyst offers free financial models for multifamily acquisitions, mixed-use developments, and IRR analysis. These models integrate benchmarking components to help you set performance baselines. Their market research services keep your benchmarks aligned with current trends, while investor and lender reporting tools present your findings in clear, professional formats - ideal for stakeholder communications and future fundraising efforts.
Whether you need full-service support or prefer to take the reins yourself, The Fractional Analyst equips you with the tools and expertise to improve your benchmarking process.
Structuring and Presenting Benchmarking Results
Once you've gathered solid benchmarking data, how you present it becomes crucial. A clear and organized presentation ensures stakeholders - whether investors, asset managers, or lenders - can quickly understand performance insights and make informed decisions. The goal is to make the data accessible while highlighting key takeaways that drive strategic choices.
Using Tables for Comparative Analysis
Tables are a powerful way to present benchmarking results, especially for side-by-side comparisons of methods, indices, and property types. To ensure clarity, follow U.S. formatting conventions - use dollar signs, commas for thousands, and periods for decimals.
Here’s an example of an effective table layout:

This structure makes it easy to spot areas where performance exceeds or lags behind benchmarks. You can also emphasize key numbers by using bold text or color-coding, drawing attention to significant differences.
When comparing benchmarking methods like Time-Weighted Return (TWR) and Public Market Equivalent (PME), include separate columns to clearly differentiate the approaches. Remember, the NCREIF Property Index (NPI) is a widely used benchmark for private real estate.
Keep in mind that private real estate IRRs are calculated net of fees, expenses, and carried interest. For a more accurate cross-market comparison, PME methods often work better than directly comparing IRRs to public market returns. Adding concise footnotes can also clarify calculation methods, such as whether you’re using the Cambridge Associates Real Estate Fund Index (covering 1,001 funds from 1986–2017) or custom-weighted benchmarks tailored to your portfolio.
A well-structured table lays the groundwork for clear analysis. From here, you can dive into the most important insights for your audience.
Key Takeaways for Stakeholders
Your presentation should cater to what matters most to stakeholders. Investors want to see overall portfolio performance. Asset managers need detailed property-level insights. Lenders are focused on risk-adjusted returns. Tailor your benchmarking results to address these priorities.
Start with the big picture: Did your portfolio outperform key benchmarks? For example, the Cambridge Associates Real Estate Fund Index provides horizon pooled IRRs, broken down into 71% opportunistic and 29% value-added strategies, offering a lens to evaluate different investment approaches.
Consistency is another critical factor. If multifamily properties consistently outperform while office assets underperform, that’s a signal worth highlighting. Transparency builds credibility, so clearly outline your data sources, calculation methods, and any assumptions made during the analysis.
If there are gaps between expected and actual performance - such as differences between core and value-add returns - explain them. Custom-weighted benchmarks can help by reflecting your specific allocation decisions rather than relying on generic market weights.
To provide a complete picture, include both summary tables and detailed breakdowns. Add risk metrics like standard deviation or Sharpe ratios to offer context beyond raw returns. This depth not only builds trust but also helps stakeholders better understand the nuances of your portfolio.
Tools like Fractional Analyst can enhance your reporting process. Their platform generates clean, professional presentations that make even complex benchmarking data easy to digest. Whether you’re creating quarterly reports or fundraising materials, these tools can save time while improving communication.
Finally, tie your benchmarking results to actionable recommendations. For example, if industrial properties consistently outperform, consider increasing your allocation. If certain markets are underperforming, explore ways to improve operations or even exit strategies. This approach transforms benchmarking from a static report into a dynamic tool for strategic planning.
Conclusion
By leveraging structured data presentation, benchmarking transforms uncertainty into actionable insights in private real estate decision-making. This guide has highlighted how tools like Time-Weighted Returns (TWR) and Public Market Equivalent (PME) help reduce biases and provide a well-rounded view of performance, with the NCREIF Property Index standing as the benchmark of choice for institutional investors.
Benchmarking sheds light on performance trends. For example, the Cambridge Associates real estate fund index - tracking 1,001 funds from 1986 to 2017 - reveals horizon pooled returns ranging between 6.08% and 10.19%, depending on the time frame. Such benchmarks help identify lagging assets, refine allocation strategies, and build investor confidence in an industry where transparency often falls short.
Benchmarking Summary
Effective benchmarking practices empower professionals to evaluate portfolio performance objectively, pinpoint underperforming assets, and make informed investment decisions. The key is selecting benchmarks that align closely with your portfolio's characteristics, such as property type, location, and risk profile, to ensure meaningful comparisons.
Equally important is how these results are presented. Clear, well-formatted tables using U.S. conventions - dollar signs, commas for thousands, and periods for decimals - make complex data more digestible for investors, asset managers, and lenders. Presenting benchmarking results with clarity not only aids understanding but also supports transparent reporting, allowing stakeholders to quickly assess performance relative to benchmarks.
This structured approach paves the way for strategic portfolio optimization.
Leveraging The Fractional Analyst for Better Results
Adding to earlier discussions on analytical tools, The Fractional Analyst simplifies benchmarking through a combination of expert underwriting, tailored asset management services, and self-service tools via the CoreCast platform. This ensures users have access to actionable, real-time financial insights.
The platform offers two key solutions. First, their team of seasoned financial analysts provides hands-on expertise to tackle complex benchmarking challenges. Second, the CoreCast platform delivers self-service tools for ongoing performance tracking. Whether you're preparing investor presentations or conducting quarterly reviews, this dual approach ensures the right level of support for your needs.
The Fractional Analyst also provides free financial models, such as multifamily acquisition tools and IRR matrices, which complement benchmarking efforts. Their custom analysis services can develop benchmarks tailored to reflect your specific investment strategy and portfolio makeup.
For professionals aiming to elevate their benchmarking practices, adopting a structured framework, relying on trusted indices, and consistently reviewing performance against both private and public market benchmarks are essential steps. Leveraging resources like The Fractional Analyst enhances the rigor of benchmarking, supports portfolio optimization, and strengthens stakeholder communication - turning performance measurement into a strategic advantage in today’s competitive real estate landscape.
FAQs
-
To ensure private real estate benchmarks align with your investment strategy, start by pinpointing metrics that match your target returns, risk tolerance, and investment timeline. Focus on benchmarks that are specific to the property types and locations you're investing in, while also considering elements like market trends and asset quality.
It's important to revisit and adjust these benchmarks regularly to stay aligned with shifting market conditions and your changing goals. Including qualitative factors - like the quality of tenants or location perks - can add another layer of precision, making it easier to assess performance and stay on track with your objectives.
-
The main distinction between IRR (Internal Rate of Return) and equity multiple lies in how each evaluates investment performance. IRR takes the time value of money into account, providing an annualized rate of return based on when and how cash flows occur. This makes it a great tool for analyzing the efficiency and timing of returns.
Equity multiple, on the other hand, is a more straightforward metric. It simply compares the total cash received to the initial investment, without factoring in the timing or duration of those returns. It’s an easy way to understand the overall scale of returns.
To sum it up, IRR focuses on the speed of returns, while equity multiple emphasizes the total return on investment.
-
Public REITs are often seen as a useful benchmark for private real estate investments because they offer clear, accessible, and real-time data on performance. This transparency allows for easier comparisons of returns and risk profiles. In fact, historical data shows that public REITs have, in some cases, outpaced private real estate by about 2% annually, particularly within institutional investment portfolios.
That said, there are important challenges to keep in mind. Public REITs, being more liquid, experience daily market swings, whereas private real estate assets are generally illiquid and rely on less frequent valuation updates. These differences in liquidity and valuation approaches can make direct comparisons tricky. Moreover, REITs don’t always capture the unique features or operational complexities of private real estate. For this reason, they’re better viewed as a complementary reference rather than a definitive standard.