
Portfolio Benchmarking for Mixed-Use Properties

Managing mixed-use properties without benchmarking can lead to missed opportunities and inefficiencies. Benchmarking helps you assess financial and operational performance, compare against market standards, and make data-driven decisions to improve returns. Mixed-use portfolios, which combine retail, residential, office, and hospitality spaces, require specific metrics to identify strengths and weaknesses across property types.
Key Takeaways:
- Financial Metrics: Track Net Operating Income (NOI), Cap Rate, Debt Service Coverage Ratio (DSCR), and Internal Rate of Return (IRR) to measure profitability and investment performance.
- Operational Metrics: Monitor occupancy rates, tenant turnover, and metrics for real estate cost analysis to ensure efficient management.
- Market Metrics: Use metrics like Market Revenue per Available Foot (M-RevPAF) and Effective Rent to compare properties against local market trends.
- Challenges: Data fragmentation, inconsistent valuation timing, and varying performance indicators for different property types make benchmarking complex.
Steps to Benchmark:
- Segment Properties: Group assets by type (e.g., retail, residential) and location for accurate comparisons.
- Select Comparables: Compare assets to similar properties in the same market.
- Analyze KPIs: Evaluate financial and operational metrics to identify performance drivers.
- Attribution Analysis: Separate market-driven effects from management-driven outcomes.
- Create Reports: Present findings with clear, actionable insights for stakeholders.
Tools like CoreCast streamline benchmarking by integrating data, performing attribution analysis, and generating professional reports, helping you focus on improving performance where it matters most.
Key Metrics for Mixed-Use Portfolio Benchmarking
Financial Metrics
When evaluating mixed-use portfolios, several financial metrics provide insight into performance and potential returns:
- Net Operating Income (NOI): This is calculated by subtracting operating expenses from total revenue, excluding financing costs and capital expenditures (CapEx). It reflects the core income potential of a property [5][6]. You can estimate this value using a real estate cap rate calculator.
- Capitalization Rate (Cap Rate): This metric divides NOI by the current market value of the property. It’s a quick way to compare returns across different assets, but it should be considered alongside other metrics for a full evaluation [5][6].
- Cash-on-Cash Return: This measures the annual pre-tax cash flow as a percentage of the total cash invested. It’s particularly useful for gauging equity performance in leveraged deals [5][6][7].
For mixed-use properties, the Debt Service Coverage Ratio (DSCR) is a critical measure. Lenders often require a DSCR above 1.25. As Sara Croot, Regional Sales Manager at JPMorgan Chase, explains:
"Debt leverage tends to be lower and cash flow coverage requirements tend to be higher for mixed-use investments than multifamily properties to account for commercial occupant concentration, cost to re-lease and higher risk profile in the cash flow" [4].
Additionally, Internal Rate of Return (IRR) accounts for the timing of cash flows, while the Equity Multiple provides a snapshot of the total return on investment. For example, an Equity Multiple of 2.0 indicates the investment has doubled [5][7].
Together, these metrics help investors make informed decisions and optimize their portfolios.
Operational Metrics
Operational metrics focus on the day-to-day management of properties, offering a complementary perspective to financial performance:
- Occupancy Rates: These should be tracked across all property types. In urban markets, occupancy rates typically range between 95% and 96%. Monitoring economic occupancy - the rent actually collected - can help identify issues like delinquencies [10][9].
- Tenant Turnover: This reflects management efficiency. Industry averages range from 10% to 20% annually. Urban areas tend to see tenants move every 12 to 24 months, while suburban properties experience turnover every 24 to 48 months [10].
- Days-to-Lease: This measures how quickly units are leased, providing insight into demand. In competitive markets, units may lease in under two weeks. It’s important to track this metric separately for residential and commercial spaces [10].
- Operating Expense Ratio (OER): This is the ratio of operating expenses to gross operating income. A lower OER indicates better cost management, especially when shared service contracts are used across different asset types [5][8].
Operational metrics help property managers identify inefficiencies and improve overall performance.
Market Metrics
Market-level indicators provide context by comparing property performance to broader market trends:
- Effective Rent: This adjusts for concessions, tenant improvements, and free rent periods. One-time discounts should be amortized over the lease term (usually 12 months) for accurate comparisons [11].
- M-RevPAF (Market Revenue per Available Foot): This combines effective rents with occupancy rates to create a single metric for evaluating market health across various property types [11].
- Trade Area Power (TAP) Score: For retail spaces, this score evaluates submarket strength by analyzing demographics like income, education, and cost of living to ensure a strong customer base for tenants [11].
- Market Beta: This measures a market’s volatility compared to national averages, while Market Grade (rated from A++ to D) provides an overview of long-term growth expectations [11].
- Economic Cap Rates: These adjust traditional cap rates by factoring in CapEx, offering a fairer comparison between sectors with varying CapEx requirements, such as office versus residential properties [2][11].
Market metrics round out the analysis, placing property performance within the larger competitive and economic landscape.
sbb-itb-99d029f
Common Challenges in Mixed-Use Benchmarking
Data Fragmentation
Mixed-use properties often face the issue of fragmented data. Key information is scattered across valuation reports, accounting systems, and tenant management platforms, each functioning in isolation [2]. This lack of integration makes it incredibly difficult to get a comprehensive view of portfolio performance.
The problem is compounded by the infrequency of property trades. Many properties change hands only once every 5–10 years, meaning most benchmarking relies on valuations rather than actual sale prices [2]. As MSCI explains in their methodology:
"Real estate is a relatively illiquid and heterogeneous asset class. Each property asset is unique, differing from all others in terms of its location, size, tenants and physical characteristics" [2].
Tenant-paid utilities add another layer of difficulty. Property owners often need signed release forms to access this data from tenants, or they must request aggregated data from utility providers [12]. Statistics show that only 36% of assisted multifamily housing properties and 46% of public housing properties rely solely on owner-paid utility accounts, leaving others to navigate complicated data collection processes [12].
Another challenge lies in inconsistent valuation timing. Valuations can range from monthly to bi-annual schedules, making it hard to align performance snapshots [2]. Additionally, when assets are grouped under a single lease or ownership agreement, extracting detailed data for individual units becomes nearly impossible [2].
These challenges underline the importance of creating benchmarks tailored to the specific needs of different property uses.
Different Performance Indicators by Use Type
The complexity of mixed-use benchmarking goes beyond fragmented data - each property type within a mixed-use development requires unique performance metrics. For instance, office spaces are now often evaluated based on productivity and employee engagement, rather than the traditional cost-per-square-foot metrics [14][16].
Financial drivers also vary significantly. Retail net operating income (NOI) depends on sales performance and marketing effectiveness, while residential NOI is influenced by factors like maintenance response times and tenant turnover [14][15]. Even basic measurements differ: office spaces typically use Rentable Square Footage (RSF), which includes common areas, while other sectors focus on Leasable Square Footage (LSF) [13].
Lease structures add yet another layer of complexity. Service-sector tenants often seek flexible leasing terms to adapt to market changes, while industries like manufacturing or specialized retail may prefer long-term ownership to maintain operational stability [16]. As Tiffany Bowtell, CEO of PMVA, notes:
"With effective property management KPI tracking, you can cut noise, focus your team, and make better decisions faster" [14].
Performance thresholds also differ by property type. For example, an office space occupancy rate above 96% might indicate strong performance, but in residential properties, it could suggest rents are below market value [14]. Each use type demands its own benchmarks and performance standards, making it crucial to understand these distinctions when developing effective benchmarking strategies.
How To Value Mixed Use Property? - CountyOffice.org
Step-by-Step Benchmarking Process
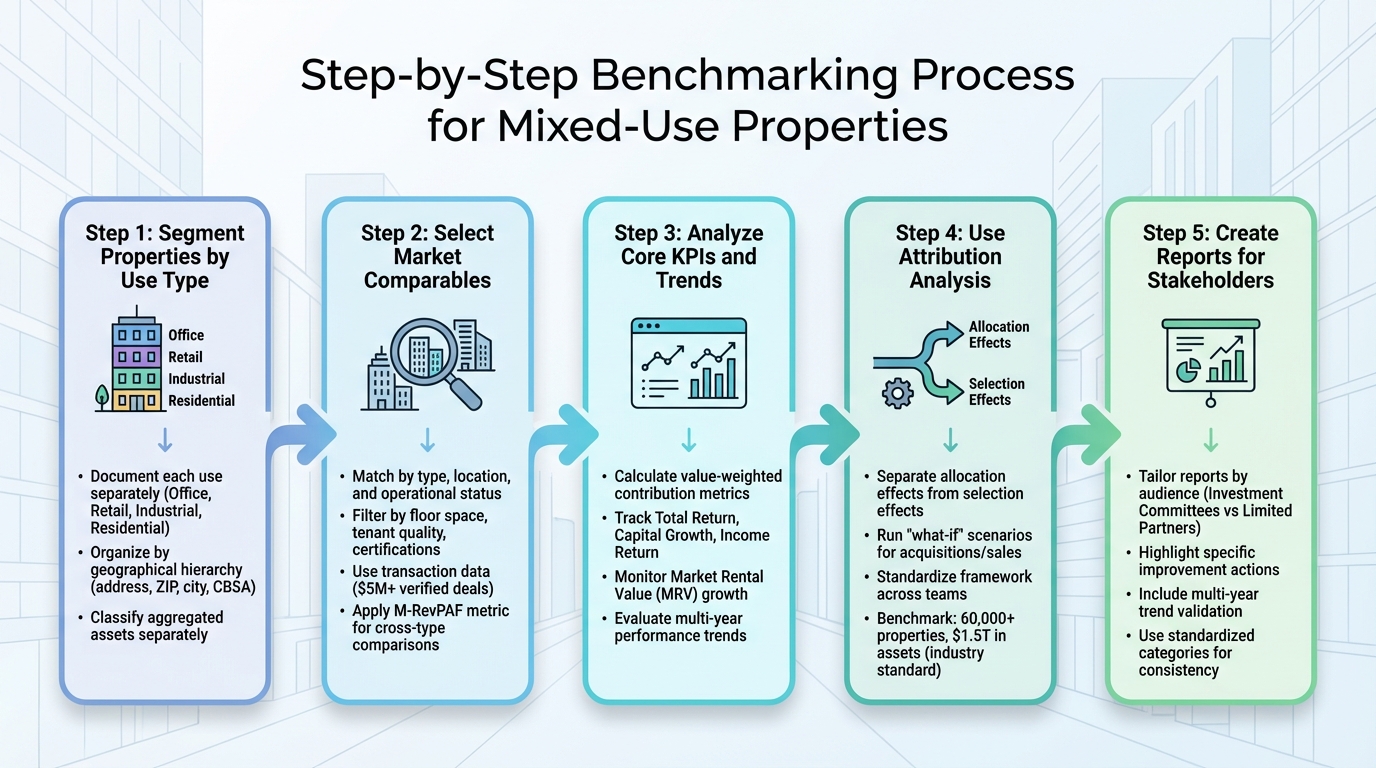
5-Step Mixed-Use Portfolio Benchmarking Process
Segment Properties by Use Type
When dealing with mixed-use buildings, it's crucial to document each use separately if individual metrics are available [2][17]. This approach ensures you're comparing similar types of properties, making performance measurements more accurate.
Stick to standard classifications like Office, Retail, Industrial, and Residential. Aligning your portfolio with recognized market indices, such as ODCE, helps you filter mixed portfolios and focus on specific property subtypes. This way, you can pinpoint which segments are boosting returns and which ones might be underperforming [3][2].
Organize your assets using a geographical hierarchy that includes details like the address, ZIP code, city, and country. This setup allows for comparisons with similar properties in the same Core Based Statistical Area (CBSA) [3][2]. For assets tied by a single lease or ownership agreement that can't be separated by location or use, classify them as "aggregated assets." These assets contribute to overall national and portfolio-level results but are excluded from detailed segment-specific analyses [2][17].
This segmentation process sets the stage for selecting comparable properties and diving into key performance indicator (KPI) analysis.
Select Market Comparables
Once your portfolio is segmented, the next step is finding accurate market comparables. Look for properties that match your assets in terms of type, location, and operational status. Keep the comparables within the same CBSA or submarket to account for regional variations [3][2].
Narrow your peer group further using filters like floor space, tenant quality, and certifications such as Energy Star or LEED [2][11]. When comparing across different property types, rely on metrics like Market Revenue per Available Foot (M-RevPAF), which combines effective rents and occupancy into one measure of property health [11].
Use transaction data - specifically deals worth $5 million or more that have been verified for pricing and physical details [20]. Since about 5% of the MSCI Global Annual Property Index by value is sold annually, basing benchmarks on actual transactions rather than valuations alone provides a more reliable comparison [19]. For sectors with varying capital expenditures, like office spaces versus self-storage, adjust for these differences to ensure fair yield comparisons [11].
Analyze Core KPIs and Trends
Calculate key metrics for both individual segments and the entire portfolio. Use value-weighted contribution to ensure metrics like Total Return, Capital Growth, and Income Return accurately reflect the financial weight of each asset [2].
Dive into yield and cash flow components to identify what’s driving performance. Automated benchmarking tools can speed up comparisons between your portfolio and the market [3]. Evaluate performance over several years to spot market and property-type trends, and use these insights to validate your exit timing assumptions against actual benchmarks [3].
Pay close attention to Market Rental Value (MRV) growth alongside passing rent growth. This can help you spot opportunities for income growth through rent adjustments [2]. Record all income and costs on an accrual basis to maintain consistency in performance tracking [17].
With these KPIs in hand, you can move on to a deeper analysis of performance drivers using attribution analysis.
Use Attribution Analysis
Attribution analysis helps separate allocation effects (the impact of being in a particular market or sector) from selection effects (the impact of choosing specific assets within that market) [3][18]. This distinction helps determine whether your portfolio’s performance is due to market positioning or asset selection.
Run "what-if" scenarios to predict how acquisitions, sales, or reallocations could shift your benchmark position [3][18]. This forward-looking approach ensures decisions are based on data rather than intuition. For example, Altus Group’s Benchmark Manager reviews over 60,000 properties quarterly, benchmarking more than $1.5 trillion in total asset value [3].
Standardize your performance analysis framework across teams to ensure consistent reporting for investment committees and limited partners [3]. This consistency eliminates manual data consolidation and promotes uniform decision-making throughout your organization [3][18].
Create Reports for Stakeholders
Finally, transform your analysis into actionable reports tailored to your audience. Investment committees generally need detailed attribution analysis that highlights allocation versus selection effects, while limited partners might prefer simpler summaries comparing performance to market benchmarks.
Focus your reports on specific actions that can improve portfolio performance. Whether it’s offloading underperforming assets, increasing exposure to thriving sectors, or reallocating capital, provide clear recommendations. Include multi-year trends to validate your assumptions and demonstrate how your portfolio has performed relative to market indices over time [3].
Use standardized categories in your reporting to ensure consistency across teams and allow for meaningful comparisons over different time periods [3][18]. Clearly highlight whether your portfolio is outperforming the market and identify the key factors driving that performance.
How CoreCast Simplifies Mixed-Use Portfolio Benchmarking
Portfolio-Level Analysis and Insights
CoreCast takes the hassle out of benchmarking by pulling together real-time valuation and cashflow data across office, retail, residential, and industrial properties. No more tedious manual data stitching that bogs down quarterly reviews.
The platform allows you to filter mixed portfolios, zeroing in on performance by specific property types and subtypes. This means you can directly compare segments like retail or residential properties against similar assets in the same CBSA (Core-Based Statistical Area) [3]. For example, you can quickly spot if your retail properties are lagging behind market performance while your residential units are exceeding expectations.
With CoreCast, users report portfolio-versus-market analysis that's 70% faster compared to traditional manual methods [3]. The platform’s performance attribution tools make it easy to break down allocation versus selection effects, helping you understand what’s driving results across your portfolio. You can even dig deeper into yield and cashflow components to identify key performance drivers. Plus, its "what-if" scenario modeling lets you visualize how potential acquisitions or sales could impact your portfolio's standing against benchmarks [3].
CoreCast doesn't stop at numbers - it also incorporates spatial insights to enhance your market comparisons.
Integrated Mapping and Market Comparisons
CoreCast goes beyond spreadsheets by offering a visual map of your portfolio's market position. This feature displays your properties alongside competitors, giving you a clear view of how your mixed-use assets measure up in the local landscape. It’s a powerful tool for spotting market opportunities and addressing portfolio gaps.
The platform also tracks performance over multiple years, letting you monitor how your assets compare to market benchmarks over time. These long-term insights help you identify key turning points by market and property subtype [3]. Armed with this historical data, you can validate underwriting assumptions and refine exit strategies, ensuring decisions are based on real trends rather than just projections.
Reporting and Stakeholder Engagement
Once you’ve analyzed performance, CoreCast makes it easy to share insights with stakeholders through polished, professional reports. The platform generates branded, institutional-grade reports tailored to different audiences. For example, investment committees receive detailed breakdowns of allocation versus selection effects, while limited partners get concise summaries comparing portfolio performance to market benchmarks.
CoreCast also centralizes auditable metrics, streamlining portfolio reviews and speeding up stakeholder reporting [21]. Its AI-powered Business Intelligence feature allows stakeholders to query data naturally, instantly uncovering trends and risks [21]. Branded "tear sheets" and customizable reporting templates ensure that both General Partners and Limited Partners have a clear, evidence-based view of portfolio health. This shifts quarterly reporting from vague narratives to data-backed insights tied directly to transparent benchmarks [3][21].
Best Practices for Mixed-Use Property Benchmarking
Standardize Data Collection
To create accurate benchmarks, you need consistent, reliable data across all property types in your portfolio. For mixed-use properties, this means gathering a core set of data points - like capital value, transaction details (purchase and sale prices), capital flows (expenses and income), and net income - for every asset [2].
Different property types come with unique operational quirks. For instance, retail tenants often handle their own utility bills, while office spaces might rely on accounts paid by the property owner. A notable example: 36% of properties in HUD's assisted stock operate exclusively on owner-paid utility accounts [12]. To navigate these variations, separate utility data into owner-paid and tenant-paid categories to calculate operating expenses with precision.
"The best practice in utility benchmarking is to collect 100% of the actual utility data associated with a property, since this produces the most accurate results and provides the greatest insights."
– HUD [12]
In cases where verified data is missing, standardized assumptions for each property type can fill the gaps. To ensure an uninterrupted flow of utility data, consider integrating utility data release forms into tenant lease agreements and updating them annually during income verifications [12].
By standardizing your data collection process, you can create benchmarks that reflect the specific traits of each property in your portfolio.
Set Realistic Benchmarks
Effective benchmarks take into account the unique features of each property type within your mixed-use portfolio. Start by segmenting your portfolio - grouping properties by type and subtype, such as retail, office, residential, or industrial. Then, compare these groups against industry benchmarks within the same Core Based Statistical Area (CBSA) [3].
Clear segmentation helps you align benchmarks with relevant performance indicators. It's also important to differentiate between "allocation effects" (returns influenced by being in a favorable market or sector) and "selection effects" (returns driven by specific asset management choices) [3]. This type of analysis can reveal whether underperformance stems from market conditions or property-specific factors. Group properties by use, location, and size to ensure fair comparisons [1]. Additionally, collect at least one year of historical data to establish internal baselines before setting external, market-aligned targets [1].
Once these benchmarks are in place, regular monitoring will help you stay ahead of any changes in the market.
Monitor and Adjust Continuously
Benchmarking isn’t something you do once and forget. Markets evolve quickly, so it’s essential to revisit and update your benchmarks at least once a year to keep them relevant [1]. Research shows that top-performing commercial real estate investors are four times more likely to benchmark their assets regularly compared to average performers [1].
To make benchmarking truly impactful, align your reviews with quarterly strategy sessions [22]. This ensures that the insights you gather are turned into actionable decisions. For instance, use benchmarking data to predict how a 5% increase in occupancy could affect revenue [1]. These insights can guide improvements in technology, processes, and overall performance [22].
"What got you here, won't get you there. Statistics cannot be improved, but the technology, processes, people, and strategies that drive them can."
– Marshall Goldsmith (via Zendesk) [22]
For mixed-use properties, it’s especially helpful to use systems that track multiple property components within a single record. This allows you to monitor metrics for each component separately while maintaining a clear picture of the property’s overall performance [23].
Conclusion
Benchmarking mixed-use portfolios turns raw data into actionable insights. By comparing metrics like Net Operating Income (NOI), occupancy rates, and operating expenses against market averages, you can uncover inefficiencies that might otherwise remain hidden. This structured approach pinpoints areas where your portfolio can improve.
The potential gains are massive. Refining urban portfolios to strike the right balance of Live, Work, and Play spaces could unlock over $120 billion in U.S. commercial real estate value [24]. However, reaching this potential requires a shift away from subjective management practices toward data-driven strategies. This ensures you can distinguish whether your portfolio's performance is tied to asset quality or broader market dynamics [3].
A testament to the power of benchmarking comes from industry professionals:
"Portfolio performance benchmarking in commercial real estate transforms good investments into great ones."
– Josh, Real Estate Investor and Project Manager [1]
To manage this level of precision, a unified platform becomes indispensable - especially for mixed-use properties, where multiple property types coexist within a single asset. The complexity of such portfolios demands tools that allow segmented analysis while maintaining a cohesive view. CoreCast addresses this need with its all-in-one intelligence platform. It integrates underwriting, portfolio analysis, competitive mapping, and stakeholder reporting, eliminating data silos and providing a clear picture of how each component - whether retail, office, or residential - stacks up against its specific benchmarks.
As markets evolve, so must your benchmarks. Rapid market changes require tools that can adapt just as quickly. By incorporating benchmarking into your quarterly strategy meetings and leveraging platforms that automate data collection and reporting, you’re better equipped to detect gaps early and allocate capital more effectively.
FAQs
What challenges arise when benchmarking mixed-use properties?
Benchmarking mixed-use properties presents a unique set of challenges compared to single-use assets. These properties combine diverse components - such as residential units, retail spaces, office areas, and sometimes even industrial facilities - each requiring distinct performance metrics. For instance, retail spaces might focus on rent per square foot, while office spaces rely on metrics like vacancy rates. To get an accurate picture of performance, these varied metrics need to be collected, standardized, and carefully weighted.
Another challenge lies in finding comparable properties. Differences in zoning laws and municipal regulations can make it tough to identify properties that are truly "like-for-like." On top of that, the needs of residential and commercial tenants often clash - residents value privacy, while commercial tenants might prioritize high foot traffic - adding another layer of complexity to the benchmarking process.
Even when the right metrics are identified, ensuring data quality is a persistent issue. Mistakes like incorrect square footage or inconsistent reporting standards can skew results. To overcome this, rigorous data validation is crucial for creating reliable benchmarks and making smarter decisions for your portfolio.
How do I segment my mixed-use property portfolio for effective benchmarking?
Segmenting your mixed-use property portfolio is a crucial step for effective benchmarking, allowing you to make fair comparisons between similar components. Start by categorizing each property into its primary asset types - such as residential, office, retail, hospitality, or other uses. To ensure accurate and consistent measurements, consider using guidelines like the BOMA 2021 Mixed-Use Standard to proportionally allocate shared spaces.
Within each asset type, further refine your groups based on key factors like location (city or sub-market), age (year built or last renovated), size (e.g., under 50,000 sq ft, 50,000–150,000 sq ft, over 150,000 sq ft), and risk profile (core, core-plus, value-add). For even greater accuracy, you can incorporate the ENERGY STAR Portfolio Manager taxonomy, which classifies over 80 property types.
After segmenting, collect standardized financial and operational metrics across all properties. Metrics like cash-on-cash return, IRR, cap rate, and net operating income are essential for meaningful analysis. Tools such as CoreCast can streamline this process by organizing your data, applying benchmarks, and generating insights for each segment. This approach helps you pinpoint underperforming areas, compare performance across asset types, and establish realistic targets for returns. To keep your analysis relevant, update your segmentation framework regularly as your portfolio changes.
What tools can make benchmarking mixed-use properties easier?
Benchmarking mixed-use properties becomes much easier with the right real estate intelligence tools. Take CoreCast, for example. This platform simplifies the process by pulling together property-level data, delivering real-time analytics, and creating peer-group benchmarks - all in one place. Forget about managing endless spreadsheets - CoreCast provides essential metrics like cash flow, NOI, cap rates, and IRR for various property types, including residential, retail, and office.
What sets CoreCast apart is its advanced features. It offers pipeline tracking, interactive portfolio analysis, and customizable reports that are ready to share with stakeholders. This comprehensive tool allows you to benchmark performance, compare your assets to market averages, and focus on making strategic decisions - all without the hassle of switching between multiple systems.