
Ultimate Guide to Zoning Data Integration

Zoning data is notoriously fragmented across 33,000+ U.S. jurisdictions, making it difficult for real estate professionals to quickly assess land use, building restrictions, or development potential. This guide covers how to centralize and standardize zoning data to speed up decision-making, reduce errors, and streamline real estate workflows.
Key Points:
- What Zoning Data Is: It defines how land can legally be used (e.g., residential, commercial) and includes details like height limits, density restrictions, and parking requirements.
- Why It Matters: Integrated zoning data helps evaluate property potential, avoid regulatory issues, and improve investment strategies. For example, Colorado data shows only 3% of residential land allows higher-density housing.
- How to Integrate Zoning Data:
- Acquire Data: Use municipal portals, third-party aggregators, or non-profit projects like the National Zoning Atlas.
- Standardize: Convert fragmented codes into uniform formats for easier comparison.
- Visualize: Use geospatial tools to map zoning boundaries and development constraints.
- Automate Updates: Rely on APIs and automated workflows to keep data current.
Benefits:
- Faster property evaluations.
- Improved accuracy in due diligence.
- Identification of high-value opportunities, like zoning for multifamily housing or short-term rentals.
By integrating zoning data into platforms, firms can eliminate manual research and make smarter real estate decisions faster. Tools like CoreCast simplify this process by automating data collection, mapping, and analysis, ensuring accuracy and efficiency.
What Is The Role Of Zoning In GIS Land Use Pattern Analysis? - CountyOffice.org
sbb-itb-99d029f
Core Components of Zoning Data Integration
To make the most of zoning data, real estate professionals need to rely on three key elements: dependable data sources, geospatial visualization tools, and consistent standardization. These components must work together seamlessly. Without all three, the process risks being riddled with incomplete data, inconsistent formats, or outdated records - any of which can disrupt critical due diligence.
Where to Get Zoning Data
Zoning data typically comes from three main sources: municipal portals, third-party aggregators, and non-profit research projects. Municipal open data portals, like NYC OpenData and Data.gov, provide raw GIS files, geodatabases, and official zoning maps directly from city planning departments. These sources are highly authoritative but can be tricky to navigate because each city often uses its own unique formats, terminology, and update schedules.
To address this fragmentation, third-party aggregators step in. They consolidate zoning data from thousands of municipalities into centralized platforms. These platforms often provide standardized APIs and automated reporting tools, which integrate directly into integrated real estate workflows. This makes it possible to access digitized zoning information for countless cities and millions of parcels without the hassle of piecing together data manually.
Non-profit initiatives, such as the National Zoning Atlas (NZA), prioritize transparency and uniformity. The NZA has compiled zoning details for 8,900 jurisdictions, analyzing over 1,035,000 pages of zoning codes to extract more than 200 regulatory characteristics per district [2]. One real-world example of this data in action is Salem, Massachusetts, which used NZA maps in September 2025 to eliminate parking requirements for new apartment developments [2]. For platforms that require bulk data or real-time updates, APIs - whether from municipal sources like NYC Planning's ae-zoning-api or third-party providers - are invaluable. They streamline processes, eliminate manual data entry, and ensure the information stays current.
Geospatial Tools and Mapping Systems
Geospatial tools and mapping systems are essential for transforming zoning codes into visual, interactive layers that highlight development opportunities. Tools like PostGIS, an extension for PostgreSQL, enable spatial queries that match zoning districts with specific parcels [4]. This capability is crucial for answering practical questions, such as identifying properties within a 5-mile radius that allow multifamily housing.
Key geospatial file formats include Shapefiles, GeoJSON, KML, and GeoPackage files [8]. These formats allow zoning boundaries to be layered onto interactive maps, making it easier to visualize restrictions, compare nearby properties, and uncover opportunities. Efforts to standardize geospatial zoning data across numerous jurisdictions often require significant coordination. For instance, California's Office of Land Use and Climate Innovation created a statewide dataset by collecting GIS files from hundreds of jurisdictions and converting map images into precise parcel data for areas lacking digital files [3]. These mapping capabilities lay the groundwork for automating and standardizing zoning data on a larger scale.
Data Standardization and Automation
Standardization is the process of converting varied municipal zoning codes into a consistent format, making it possible to compare regions directly [2]. Without this, something like an "R-1" zoning code could mean vastly different things depending on the city. APIs and automated workflows simplify this process by collecting zoning data in bulk, enabling real estate professionals to scale their operations efficiently.
Automation further streamlines due diligence with AI-driven tools and automated reporting. For example, AI-powered web scraping bots can monitor municipal websites that lack formal APIs, sending updates whenever zoning data changes [9]. On the technical side, successful integration often depends on ETL (Extract, Transform, Load) pipelines to manage data flow from multiple sources into a single, unified database [4]. Tools like Docker help maintain consistency between development and production environments, while ORMs like Drizzle handle automatic schema updates when database structures evolve [4]. These technologies ensure zoning data remains accurate, consistent, and up-to-date across thousands of jurisdictions, enabling professionals to work smarter, not harder.
How to Integrate Zoning Data: Step-by-Step
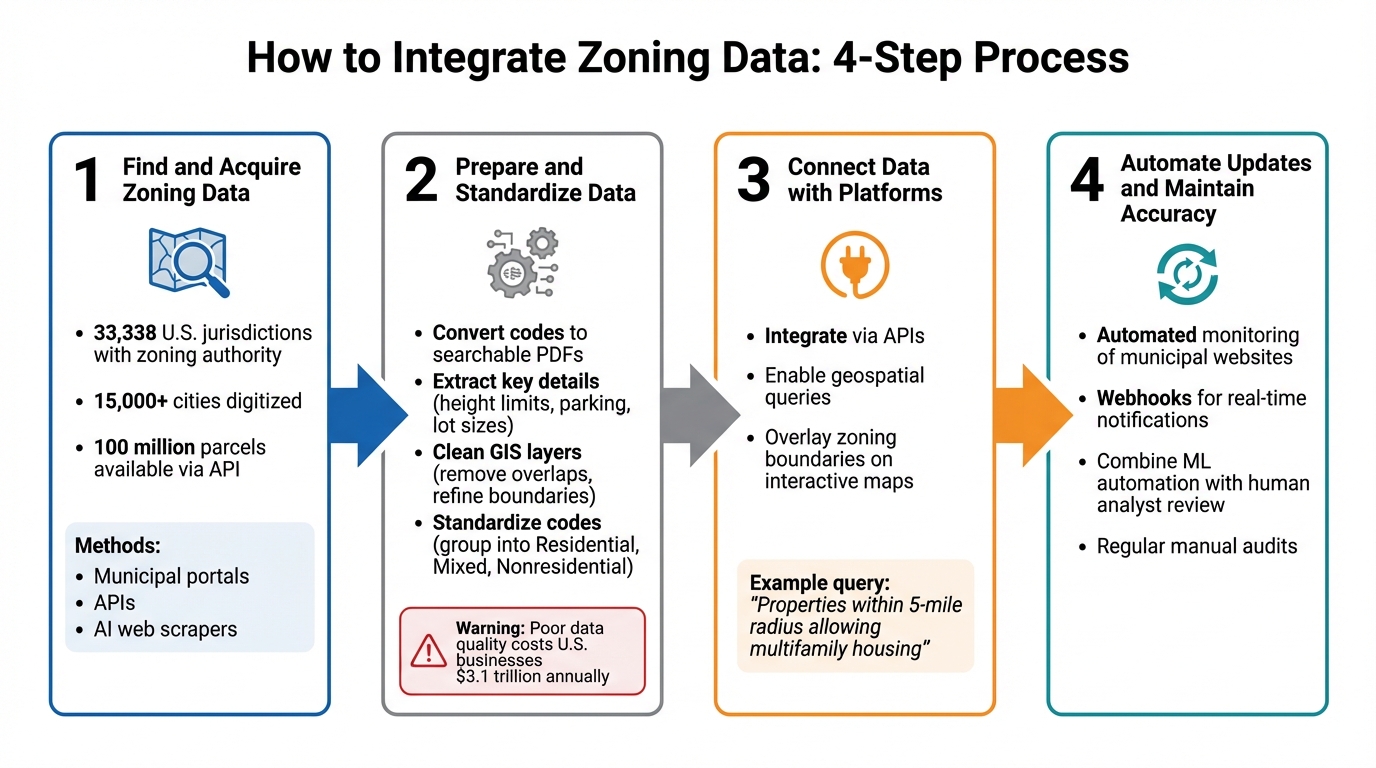
4-Step Process for Integrating Zoning Data into Real Estate Platforms
Integrating zoning data into your real estate platform involves four main stages: acquiring reliable data, preparing it for use, connecting it to your platform, and ensuring ongoing accuracy. Let’s break it down.
Step 1: Find and Acquire Zoning Data
Start by identifying the jurisdictions you need to cover. In the U.S., there are around 33,338 jurisdictions with zoning authority, including cities, counties, and special districts [5]. Once you know your target areas, gather zoning texts and maps (like GIS shapefiles or PDFs) from local government websites or specialized aggregators [5][1].
For a scalable solution, use APIs instead of manual data collection. Tools like Zoneomics have already digitized zoning data for over 15,000 cities and 100 million parcels. These APIs can provide parcel-level details - such as whether a property allows accessory dwelling units or short-term rentals - with just one call [1][7]. In areas without formal APIs, AI-powered web scrapers can monitor websites and alert you to updates in zoning codes or maps [9].
Step 2: Prepare and Standardize Data
Raw zoning data often needs significant preparation. Convert zoning codes into searchable PDFs and extract key details like permitted uses, height limits, parking requirements, and minimum lot sizes [5][2]. For geospatial data, clean up GIS layers by refining boundaries, removing overlaps, and excluding protected areas [5]. This ensures your maps accurately reflect usable land.
Standardization is crucial for comparing regions. For instance, an "R-1" zoning code might allow duplexes in one city but limit development to single-family homes in another. Group districts into broader categories - such as Residential, Mixed Residential, or Nonresidential - to make comparisons easier [5][2]. A multi-step review process for both textual and geospatial data ensures the information is accurate and ready for integration.
"Algorithms simply cannot (yet) understand the nuances of lengthy, complex zoning codes to the level of accuracy we require. Anyone who tells you otherwise doesn't understand zoning." – Sara Bronin, Founder, National Zoning Atlas [5]
Poor data quality costs U.S. businesses about $3.1 trillion annually due to lost productivity and maintenance expenses [10]. Spending time upfront to clean and standardize zoning data can save you from expensive errors down the line.
Step 3: Connect Data with Real Estate Platforms
Once your data is cleaned and standardized, integrate it into your platform using APIs and geospatial tools. This allows for efficient querying and mapping. For example, your platform could identify all properties within a 5-mile radius that permit multifamily housing. Make sure zoning boundaries can overlay interactive maps so users can easily visualize and compare areas.
Step 4: Automate Updates and Maintain Accuracy
Zoning regulations often change, so automation is essential to keep your platform accurate. Set up automated systems to monitor municipal websites and alert your platform to updates [9]. Use webhooks to immediately notify your system when changes occur, ensuring real-time updates [9].
While machine learning can assist with web scraping and initial data processing, human analysts are still key to interpreting complex zoning texts [5]. A combination of automated monitoring and regular manual reviews will help you maintain reliable data and deliver consistent value to your users.
Best Practices for Zoning Data Integration
Standardizing Zoning Codes Across Regions
One of the toughest hurdles in zoning data integration is the inconsistency in terminology and formatting across jurisdictions. For instance, an "R-1" zoning code might mean single-family homes in one city but allow duplexes in another. To address this, it’s crucial to standardize regulatory characteristics like allowed uses, lot requirements, and building parameters across regions [2][5]. Tools like the National Zoning Atlas have made strides in this area, offering standardized jurisdictional data to enable precise comparisons.
A practical approach is to group local codes into broad categories - such as Residential, Mixed, and Nonresidential - to streamline regional analysis [5]. For example, the Massachusetts Zoning Atlas, launched in July 2025, standardized zoning data across 352 jurisdictions in the state. This project uncovered that 96% of residential land prohibited apartments, even though 56% of state residents live in one- or two-person households [2]. This kind of standardized data provides policymakers with clear evidence when zoning regulations don’t align with housing needs.
Once zoning codes are standardized, the next step is to refine geospatial data to reflect actual buildable areas. This involves cleaning GIS layers by removing overlaps, correcting misdrawn boundaries, and excluding non-buildable areas like protected lands and waterways [5]. To maintain consistency, it’s also helpful to establish a shared glossary of key terms [5].
Combining Zoning Data with Other Datasets
After standardizing zoning codes, their value increases significantly when paired with other datasets. Combining zoning data with information on infrastructure, demographics, and environmental factors provides a clearer picture of development opportunities. For instance, in December 2025, the New Hampshire Zoning Atlas team integrated public water and sewer infrastructure layers with zoning maps. The findings were striking: although land was zoned for higher density, only 12% of buildable land had access to water or sewer, and just 5.6% had access to both [2]. This revealed where housing projects could realistically be supported, not just where they were technically allowed.
Overlaying zoning maps with national datasets - like protected lands, waterways, rights-of-way, and Tribal lands - can further refine estimates of developable acreage [5]. When working with data from multiple jurisdictions, fuzzy matching algorithms can reconcile discrepancies between zoning text and map labels [6]. For example, if one dataset uses "ARRD" and another shows "ARD", fuzzy matching can automatically link these variations.
Additionally, cross-referencing zoning allowances with demographic trends can highlight market gaps and inform smarter real estate decisions. In Colorado, research found that 59% of residential land prohibits multifamily housing, while only 3% permits developments with four or more units [2]. Comparing this with household size data pinpoints areas most in need of "missing middle" housing.
Ensuring Compliance and Accuracy
Accuracy in zoning data integration requires analyzing both zoning texts and maps to ensure regulations align with geospatial boundaries [11]. To help users verify the origin and currency of the data, include "Source" and "Date" columns for every record [3]. This approach is used in the California Statewide Zoning project, which integrated data from 535 of California's 539 jurisdictions [3].
Automated ETL (Extract, Transform, Load) processes and schema validation are also essential for maintaining data integrity [4]. For example, the NYC Planning Department uses a dedicated ETL repository called "ae-data-flow" to manage data loading. They also employ Zod schemas to ensure all integrated data meets strict structural requirements before it’s shared with users [4]. Tools like OpenAPI can further define expectations for zoning data endpoints, and cross-validating digitized data with official municipal records is critical before making development decisions or taking legal action [3][4].
For high-stakes compliance needs, supplement integrated data with certified zoning letters or official zoning briefs [1]. While integrated zoning data is a valuable resource, it’s often provided for informational purposes. Always verify details with local authorities for legal certainty. Following these practices ensures a strong, reliable framework for zoning data integration and real estate intelligence.
How CoreCast Simplifies Zoning Data Integration
CoreCast builds on established zoning data practices to make integration more efficient and user-friendly, offering tools designed to streamline workflows and improve clarity.
Interactive Zoning Maps and Competitive Insights
CoreCast integrates zoning data directly into its map interface, allowing you to view properties and their surrounding competitive landscape in one place. Instead of juggling multiple tools or manually researching zoning regulations, you can see how zoning restrictions impact development potential right alongside nearby properties. This feature doesn’t just simplify visualization; it ties zoning insights to your entire pipeline and portfolio. By doing so, CoreCast helps uncover new investment opportunities through a complete view of regulatory constraints and market positioning. This integrated mapping approach lays the groundwork for deeper portfolio analysis.
Portfolio Analysis with Zoning Data
The Portfolio Rollup tool in CoreCast compiles asset-level data into a single portfolio view, enabling you to assess how zoning regulations across regions influence your fund's performance. Meanwhile, the Revenue Manager allows you to upload data and visualize how zoning allowances affect asset performance across various property types and risk profiles [12]. This eliminates the need for fragmented spreadsheets, replacing them with a unified analytical framework. Spencer Vickers, CoreCast's founder, explains:
"Data is scattered across applications, underwriting models don't connect to real performance, and pipeline tracking is more guesswork than strategy" [12].
By centralizing zoning data with other property metrics, CoreCast makes it easier to detect trends, such as identifying markets where restrictive zoning hinders multifamily development opportunities [2].
Automation and Real-Time Updates
CoreCast reduces the need for manual data entry by integrating third-party tools to automate zoning data [12]. Through flexible REST API connections, the platform pulls parcel-specific zoning details - like development capacity, setbacks, and allowed uses - directly into your workflow. This ensures you always have real-time, accurate data without needing to constantly check municipal websites or rely on outdated spreadsheets. CoreCast’s underwriting features also accommodate any asset type or risk profile [12], keeping your zoning information current and actionable. By embedding zoning data into its end-to-end platform, CoreCast enables faster, better-informed decisions based on the latest regulations.
Conclusion
Bringing zoning data into property evaluation and portfolio management changes the game by breaking down data silos and speeding up decision-making. On average, organizations juggle around 400 different data sources [13]. This makes consolidating data not just a convenience but a necessity to remain competitive. The first step? Streamlining and consolidating that data.
Standardization is the backbone of successful zoning data integration. By aligning zoning codes across different jurisdictions, it becomes easier to draw meaningful comparisons and uncover opportunities that might otherwise go unnoticed. For example, the National Zoning Atlas has reviewed over 1,035,000 pages of zoning codes from 8,900 jurisdictions [2].
CoreCast tackles these hurdles with an all-in-one platform that links zoning data to underwriting, pipeline tracking, and portfolio analysis. This replaces disjointed systems with a real-time, centralized source of truth. Alan Beall, Manager of the Valuations Team at Kiavi, highlights the impact:
"Zoning data is essential for our lending workflows, and we have been very happy with the quality, accuracy, and fast turnaround times... we have truly saved a lot of time and scaled operations" [1].
FAQs
How does integrating zoning data enhance real estate decision-making?
Integrating zoning data into real estate platforms takes the often-confusing world of municipal regulations and turns it into something clear and actionable. By organizing zoning rules into a smart, searchable format, investors can quickly figure out what’s possible to build, where it can be built, and what restrictions apply. This saves hours of manual research and eliminates a lot of guesswork.
When zoning data is paired with parcel boundaries, market insights, and financial projections, the benefits multiply. It makes site selection smoother, helps assess risks more effectively, and adds depth to portfolio analysis. Developers, for instance, can instantly find parcels that match specific criteria - like height limits or permitted uses - and even spot hidden opportunities, such as areas with potential for zoning upgrades.
CoreCast’s platform takes this complexity and simplifies it. By embedding zoning data directly into its underwriting tools, it provides a single, unified map view, automated alerts, and reports that are ready to share with stakeholders. This integration allows real estate professionals to make quicker, smarter, and more profitable decisions - all without having to juggle multiple tools or datasets.
What makes standardizing zoning data across jurisdictions so challenging?
Standardizing zoning data in the U.S. is no small feat, thanks to the fragmented nature of zoning regulations. With over 30,000 local jurisdictions - spanning cities, counties, and towns - each crafting their own zoning codes, the landscape is anything but uniform. Terms, classifications, and formats vary wildly. For instance, a zoning label like "R-1" might signify one thing in one area and something entirely different in another. To complicate matters further, some jurisdictions don't even have zoning ordinances.
Adding to the complexity, zoning codes often reflect local priorities, geography, and historical context, leading to significant differences in legal language. This patchwork approach creates inconsistent data formats and sporadic updates. Extracting specific details, such as setbacks or floor-area ratios, becomes even more challenging when dealing with scanned documents or outdated GIS systems.
Platforms like CoreCast simplify this chaotic process. They bring together standardized zoning attributes - like zoning type, setbacks, and floor-area ratios - into a single, streamlined system. This allows real estate professionals to work with consistent zoning data across various jurisdictions, saving valuable time and enabling more informed decisions.
How can geospatial tools improve the way zoning data is visualized?
Geospatial tools turn zoning data into dynamic, map-based visuals, making zoning boundaries, land-use rules, and development restrictions much easier to interpret. By connecting zoning details to map layers, users can dive into color-coded districts - like residential, commercial, or mixed-use - and switch between layers to evaluate various scenarios.
Some tools even offer 3D visualizations, giving users a clear view of how proposed developments align with zoning rules and the surrounding environment. When paired with platforms like CoreCast, these tools deliver additional features, such as filtering parcels by zoning type, conducting overlay analyses, and creating tailored reports. This efficient process simplifies due diligence, speeds up site selection, and helps stakeholders quickly understand zoning details.