
How to Optimize Construction Timelines with Data Analytics

Construction delays cost billions annually. With profit margins as tight as 5-7%, even minor setbacks can turn projects into financial disasters. Data analytics offers a solution by identifying risks early, streamlining schedules, and improving decision-making.
Key Takeaways:
- Data-driven tools: Predict delays by analyzing weather, workforce, and supply chain variables.
- Centralized data: Break down silos by integrating schedules, RFIs, labor logs, and financial records.
- Real-time tracking: Use IoT sensors, BIM models, and dashboards to monitor progress and address issues instantly.
- AI-powered insights: Machine learning improves scheduling, resource allocation, and forecasting.
- Portfolio-wide impact: Unified dashboards help track performance and refine future project planning.
By leveraging analytics, construction teams can reduce delays, cut costs, and improve project outcomes. Let’s explore how to make it happen.
Construction Data Analytics Impact: Key Statistics and ROI Metrics
What Role Does Data Analysis Play in Improving Construction Management Outcomes?
Building a Data Foundation for Construction Projects
To improve efficiency and decision-making in construction, everything starts with measurement. Before diving into analytics, it's essential to establish a strong data foundation. This means identifying the right data sources, centralizing them in one place, and ensuring all formats are consistent.
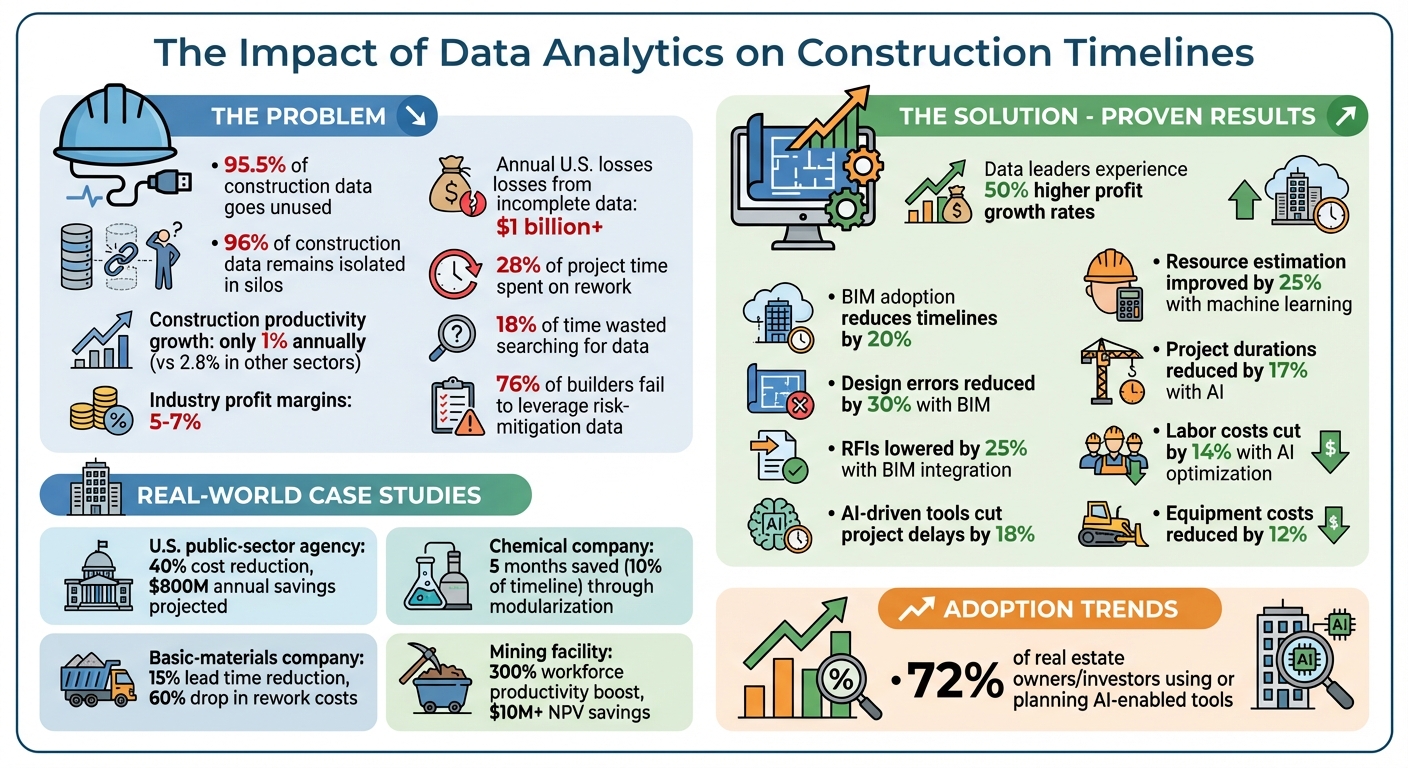
The construction industry has a well-known data problem. A staggering 95.5% of all captured data goes unused because it's scattered across disconnected systems. For instance, project schedules might live in one software, RFIs in another, and labor logs on paper. When project managers try to pinpoint why a task is delayed, they often have to dig through multiple systems, only to find incomplete or outdated information.
Key Data Sources for Construction Analytics
The first step in building a solid data foundation is identifying what information matters most. Project schedules from tools like Primavera or MS Project are critical, but they’re just part of the bigger picture. RFIs, change orders, and submittals are vital for understanding scope changes and communication delays [1]. On-site data, such as labor logs, daily progress reports, safety incidents, and inspection records, provides a more accurate view of what's happening on the ground [1].
Financial and supply chain data are equally important. Accounting records, purchase orders, cash flow trends, and material tracking (using RFID or barcodes) can signal cost overruns before they spiral out of control [1]. Visual data, like 3D/4D BIM models, drone images, and site photos, adds a layer of spatial context that numbers alone can’t capture [8]. External data sources - such as weather forecasts, regional spending patterns, and local workforce availability - offer insights into risks outside of your control [1].
Here’s an example: In June 2017, a major U.S. public-sector infrastructure agency consolidated data from over 10,000 past projects. They integrated details from engineering systems, HR records, and procurement contracts. By organizing this data into project types (like bridges, roads, and buildings) and using multivariate regression, they pinpointed the factors that most affected costs and schedules. The result? They negotiated project cost reductions of up to 40% and projected annual savings of $800 million [6].
Centralizing and Standardizing Data
Once you’ve identified the data you need, the next step is bringing it all together. Data silos are a major obstacle - about 96% of construction data remains isolated, making it difficult to use effectively [8]. Creating a single source of truth, where all project data is stored and accessible, is critical.
For example, CoreCast integrates underwriting, project tracking, and portfolio analysis into one platform. This unified system allows you to monitor your construction pipeline, track project performance, and analyze your entire portfolio without jumping between tools.
But centralization alone isn’t enough. Standardizing data formats is just as important. Use consistent formats for dates (MM/DD/YYYY), currency (USD), and measurements (feet, pounds, degrees Fahrenheit) [5]. If your company has legacy data in various formats, a one-time cleanup - known as backward reconciliation - is necessary to prepare historical records for predictive analytics [5].
"Most firms have collected lots of information over the years, but it's stored in disparate systems and inconsistent formats... the first step should be to take stock of what they have... and put it into a form they can digitally analyze."
- Garo Hovnanian, Kevin Kroll, and Erik Sjödin, McKinsey & Company [5]
Automation can make this process even smoother. Instead of relying on manual data entry, use digital tools like IoT sensors, mobile devices, or RFID tags to automatically capture field data [1]. BAM Ireland, for instance, implemented automated reporting dashboards. Michael Murphy, their Digital Construction Operations Manager, noted that these tools helped project teams make decisions faster by visualizing critical data in real time [11]. With a unified and standardized data foundation, project schedules become actionable tools for driving progress.
Turning Schedules into Data-Driven Tools
Transforming static construction schedules into dynamic, actionable tools can significantly improve project management. A well-structured schedule not only outlines task dependencies but also tracks progress in real time and flags potential issues early on.
Creating Logic-Based Schedules
The Critical Path Method (CPM) is the backbone of a data-driven schedule. It identifies the longest chain of dependent tasks with zero float time - essentially, the tasks that directly impact your project's completion date [12][15]. If any task on this critical path is delayed, the entire project timeline shifts.
To build an effective schedule, start with a Work Breakdown Structure (WBS). This framework organizes your project into manageable levels: Project > Phase > Deliverable > Task [15]. For example, in constructing an office building, phases like Site Preparation, Foundation, and Superstructure might be included. Under Superstructure, you might list deliverables such as "Erected Steel Frame", which further breaks down into tasks like "Position and Align Steel Beams."
"It is imperative to identify the critical path in a project and closely monitor the progress of these activities to achieve timely completion of the project."
- Surinder Mittal, Advisor and Head, Shapoorji Pallonji Engineering & Construction [14]
Logical ties, or task dependencies, are critical to ensuring your schedule accurately reflects the critical path. Missing links or tasks with overly long durations can make risk analysis unreliable [13]. Once the baseline schedule is established, track variances during updates. A compression of more than 20% is a warning sign - field teams may need to work overtime, or productivity could suffer due to trade stacking [13].
To make this system even more effective, consider embedding detailed metadata into each task.
Adding Metadata to Schedules
Adding metadata to your schedule turns it into a more versatile tool. Metadata includes descriptive tags like trade (e.g., electrical, plumbing), subcontractor name, location (e.g., floor, zone), and material type [14][5]. These tags allow you to analyze the schedule in ways that uncover trends or bottlenecks.
For instance, if electrical tasks are consistently delayed, you can filter the data by trade to pinpoint whether the issue lies with a specific subcontractor, location, or type of work.
Consistency in naming conventions is key. If one project manager labels a task "Electrical - Install Conduit" and another uses "Conduit Installation (Elec)", analytics tools may fail to group them together. Standardized metadata ensures your data can be aggregated into a cohesive "data lake" for long-term use [5].
With a metadata-rich schedule, the next step is linking it to field data for real-time updates.
Connecting Schedules to Field Data
Integrating schedules with real-time field data makes progress tracking more precise. A schedule is only as reliable as the data feeding into it. Key inputs include daily logs, inspection reports, sensor readings, and site photos [3][13].
One method to improve accuracy is "Half-Step Analysis." This involves saving a version of your schedule that only reflects progress updates - without altering task logic or durations. This "Status-Only" update isolates delays caused by actual progress, separate from recovery efforts or schedule revisions [13]. For example, if your end date has slipped by two weeks but adjustments have recovered one week, you know the real delay is three weeks.
BIM integration can enhance this process further. By linking your CPM schedule with a 3D Building Information Model (BIM), you create a "4D BIM" model that visualizes tasks in both space and time. This approach helps identify conflicts - like two trades needing the same space simultaneously - before they occur [15]. Research shows that BIM adoption can cut project timelines by 20%, reduce design errors by 30%, and lower Requests for Information (RFIs) by 25% [14].
Jacob Maier, Senior Superintendent at Andersen Construction, highlights the value of this approach:
"Identifying the dependencies between tasks can help identify bottlenecks early, during the design phase, allowing stakeholders to collaborate on efficient solutions and avoid delays." [14]
Automating progress tracking through daily and weekly updates from field data eliminates the need for manual reporting [3]. BAM Ireland, for example, implemented automated dashboards that allowed teams to make quicker decisions by visualizing critical data in real time [11]. When your schedule is connected to live field data, you move from guessing about progress to having a clear, accurate picture of where your project stands.
Identifying and Addressing Delays with Data Analytics
When live field data is integrated into schedules, analytics can step in to identify and address delays. This process builds on dynamic, metadata-rich schedules and involves three key steps: tracking current delays, predicting potential issues, and uncovering the root causes of recurring problems.
Tracking Delays with Descriptive Analytics
Descriptive analytics provides a real-time view of project performance by leveraging connected schedules. Dashboards become the go-to tool, offering a clear comparison of planned versus actual timelines, critical path progress, and float usage. These dashboards pull data from scheduling software, on-site sensors, and field reports into one cohesive view [16][4]. Instead of waiting for weekly updates, project managers can instantly spot deviations in time, cost, or scope by comparing "As-Planned" (baseline) with "As-Built" (actual) data [10].
For instance, a "Home" dashboard might include features like weather forecasts, team updates, and recent activities, helping teams prioritize tasks and address immediate risks [16]. By turning raw numbers into simple visuals, teams can act quickly and make informed decisions.
"Hard data and numbers can be transferred into useful and concise visuals, promoting efficiency, insight, and effectiveness." - Deloitte [4]
Construction's labor productivity has only grown by 1% annually over the past two decades, compared to 3.6% in manufacturing [5]. With profit margins typically hovering between 5% and 7%, tracking delays in real time is essential for project success [5].
Using Predictive Analytics to Reduce Risks
While descriptive analytics shows what’s happening now, predictive analytics looks ahead to forecast what’s likely to happen next. Machine learning models analyze variables like weather patterns, subcontractor performance, and supply chain trends to provide early warnings [7][9][17]. Tools such as SVM, Random Forest, and time-series analysis help predict delays and resource demands [7][17]. For instance, time-series models learn how processes perform under different conditions - like extreme heat, rain, or site congestion - and flag deviations from the expected plan [9].
Between 2014 and 2017, a major U.S. public-sector agency used multivariate regression on a database of over 10,000 construction projects. By identifying key variables for project types like bridges and roads, they created an automated estimation tool that cut costs by up to 40%, with projected annual savings of $800 million [6]. In another example, using SVM and Random Forest models reduced project delays by 18%, while machine learning improved resource estimates by 25% compared to traditional methods [7].
The real power of predictive analytics lies in understanding how interconnected variables - like delayed materials - can ripple through a project and disrupt downstream activities [9].
Root-Cause Analysis for Delays
Spotting a delay is just the beginning; understanding its cause is critical. Root-cause analysis digs deeper by combining schedule data with supporting documents like RFIs, change orders, and labor productivity metrics to uncover what went wrong [18][10]. Forensic schedule analysis compares baseline and updated schedules against actual progress to pinpoint when and where delays occurred [18]. Techniques like schedule indexing identify the exact moment of deviation, while window analysis isolates specific timeframes where milestones shifted [18].
"Construction is won and lost in profit margins, so understanding what's working and what's not can be the crutch that keeps a company from going under." - Justin Vogel, Senior Solutions Engineer at Procore [18]
AI-driven tools take this a step further by scanning historical and real-time data to detect subtle performance changes - like shifts in crew productivity or material sequencing - before they escalate into major delays [9][16].
"The goal is not to remove volatility. It is to create structure around how disruption is managed before it spreads." - CMiC [9]
To strengthen root-cause analysis, maintain a centralized document repository with all RFIs, change orders, and directives accessible to stakeholders [18]. Establish clear approval timelines for change orders to prevent cascading delays, and analyze projects that meet their deadlines to identify successful strategies and set benchmarks for future performance [18].
sbb-itb-99d029f
Optimizing Schedules and Resources with Data Insights
Once delays are pinpointed and their causes analyzed, the next logical step is reshaping schedules and reallocating resources. This isn’t just about tracking issues - it’s about transforming how work gets done. Using data analytics, teams can test various scenarios, strategically shift resources, and even leverage AI to uncover faster, more efficient paths forward. By building on delay analysis and root-cause identification, these strategies help refine both schedules and resource management.
Re-sequencing and Fast-Tracking Activities
Generative scheduling powered by AI can evaluate millions of schedule configurations in just minutes. This process identifies the most efficient work sequences and resource allocations while considering physical and spatial constraints [19][20]. With this tool, project managers can explore "what-if" scenarios - like shifting equipment testing from sequential to parallel processes or incorporating off-site prefabrication - before finalizing plans [2].
Take the example of a major chemical company: by modularizing key components and assembling them in controlled environments, they shaved five months off their construction schedule - about 10% of the total project timeline [2]. Similarly, a basic-materials company standardized 70% of its operations across multiple plants. The result? A 15% reduction in lead time and a 60% drop in costs related to rework and quality issues [2].
"Generative scheduling can generate optimized sequencing and resourcing plans that can save both time and money." - Justin Dahl, Partner, McKinsey & Company [19]
Allocating Resources for Efficiency
Efficient resource allocation is all about reducing idle time and avoiding site congestion. AI-driven resource leveling adjusts assignments in real time, factoring in progress and constraints [20]. By analyzing historical data from thousands of projects, teams can better predict the effort required for specific tasks and evaluate subcontractor bids with greater accuracy [5][6].
For instance, a large U.S. public-sector agency created a database of 17,000 past projects and used multivariate regression to build an automated estimation tool. This innovation reduced the time needed to determine contract prices from 60 days to just two, while also lowering costs by up to 40%. The agency expects to save $800 million annually as a result [5][6]. On individual projects, AI-driven tools have cut project durations by 17%, while reducing labor costs by 14% and equipment costs by 12% [20].
Real-time tracking technologies like IoT sensors, RFID, and GPS play a crucial role here. These tools help managers continuously monitor asset locations and productivity, allowing them to respond quickly to delays [10]. Digital collaboration platforms and 3D digital twins - often created using drone footage - further enhance planning. For example, a mining facility used a 3D digital twin updated twice a week to meticulously plan water dam construction. This approach boosted workforce productivity by 300%, saved over a month on a critical milestone, and delivered more than $10 million in net present value [2].
Using AI for Optimized Scheduling
AI takes scheduling to the next level by learning from on-site conditions and recommending real-time adjustments. Machine learning models track task durations under varying circumstances, flagging potential disruptions before they impact the critical path [9]. Techniques like Support Vector Machines (SVM) can reduce project delays by 18%, while AI-driven resource estimation improves accuracy by 25% compared to traditional methods [7].
A great example comes from Align JV, which used ALICE Technologies' AI platform on the High Speed 2 Project. This tool allowed them to evaluate a wide range of project alternatives in a fraction of the time it would’ve taken otherwise - replacing weeks of work with rapid, data-driven insights [20]. Similarly, Build Group’s Project Director, Mike MacBean, used AI to challenge a long-established construction schedule. In just one afternoon, the AI platform identified a more efficient plan than the original [20].
"With ALICE, we can evaluate risks and opportunities across our projects in a fraction of the time it previously took, allowing us to deliver better outcomes for our clients." - Ranjeet Gadhoke, Vice President of Project Controls [20]
The shift from static Gantt charts to dynamic, generative models is a game-changer. These tools treat scheduling as an ongoing problem-solving exercise [19]. By integrating scheduling forecasts with financial controls, teams can assign monetary values to potential delays, enabling them to proactively manage cash flow reserves [9].
"The construction industry has reached a point where incremental improvements in scheduling practices no longer yield meaningful results. A redefinition of forecasting is necessary." - CMiC Global [9]
Scaling Construction Analytics Across Real Estate Portfolios
Expanding analytics across an entire real estate portfolio - beyond individual projects - provides a strategic advantage for long-term success. By analyzing data at the portfolio level, companies can turn isolated project metrics into actionable insights that guide decisions on underwriting, partner selection, and more.
Research shows that companies identified as "data leaders" experience profit growth rates 50% higher than their competitors [1]. However, a staggering 95% of data generated in construction and engineering goes unused [11], and 76% of commercial and industrial builders fail to fully leverage data that could mitigate risks [21]. This leaves a significant opportunity for firms willing to centralize and systematically analyze their construction data. A portfolio-wide approach enables strategic improvements that ripple across all projects.
Portfolio Dashboards for Risk and Performance Tracking
Executive dashboards consolidate data from multiple projects, offering a clear view of company-wide performance and highlighting areas of risk. These tools allow leaders to monitor trends over time, identify risks by location, and optimize processes for similar projects [11][16]. Platforms like CoreCast streamline this process by integrating construction data with underwriting, pipeline tracking, and portfolio analysis - all in one place.
With the help of AI, these dashboards shift teams from reactive problem-solving to proactive risk management. As Anthony Colonna, Senior Vice President at Skanska, puts it:
"The ability to identify risks across projects enables us to prioritize opportunities for improvement and reduce risk to future projects" [11].
Michael Murphy, Digital Construction Operations Manager at BAM Ireland, adds:
"The reporting and dashboarding features... provide clear and concise feedback on the various project critical data streams. This information enables our project management teams to make the right decisions more rapidly and effectively" [11].
By unifying data from systems like ERPs, field tools, and financial platforms, companies create a "single source of truth." This consistency allows for meaningful comparisons across projects, regions, and asset types [1][22].
Feedback Loops for Better Underwriting and Planning
Data from completed projects doesn’t just sit idle - it can enhance future underwriting and planning. By consolidating insights from thousands of past projects into a searchable database, leading firms create feedback loops that refine risk models and underwriting assumptions [6].
For example, projects can be grouped into categories to pinpoint the variables that most impact costs and timelines, such as location or material choices. Techniques like multivariate regression and factor analysis help identify which factors truly drive outcomes [6][22]. Analytics can also assess subcontractor performance, predicting risks and guiding better partner selection for upcoming projects [11]. This continuous feedback ensures that every project contributes to smarter planning in the future.
Setting Measurable Portfolio KPIs
To improve performance across a portfolio, firms need clear, measurable KPIs that track both daily operations and long-term trends. Key metrics include:
| KPI Category | Recommended Metrics for Portfolio Tracking |
|---|---|
| Timeline | Schedule adherence, average days late, days on critical path |
| Quality/Risk | Rework rates, change order frequency, high-risk RFI volume |
| Financial | Project profitability, cash flow trends, cost variance |
| Safety | Safety incident rates, leading indicators of environmental hazards |
Rework alone accounts for 28% of project time [21], while 18% is wasted searching for data [21]. By focusing on high-impact metrics like schedule adherence and safety incident rates, firms can tackle inefficiencies head-on [1].
The shift toward predictive analytics is already underway, with 72% of real estate owners and investors using AI-powered tools for data management [23]. As Daniel Roccanti explains:
"Investors want clarity not just on the numbers, but also on the story behind those numbers. They seek assurance that their investments are performing well compared to market benchmarks" [23].
With over $1 billion lost annually in the U.S. construction industry due to poor decisions stemming from incomplete data [1], the path forward is clear. Firms should start with basic data collection and descriptive analysis to gain team buy-in before advancing to more complex predictive modeling [22]. These portfolio-level insights are essential for transforming how construction timelines are managed and optimized.
Conclusion
Data analytics transforms decision-making from reactive to proactive, offering a clear competitive edge. Companies adopting data-driven strategies experience 50% higher profit growth rates compared to their peers, while the U.S. construction industry faces over $1 billion in annual losses due to decisions based on incomplete data [1].
To harness this potential, start by creating a single source of truth. Consolidate data from field reports, schedules, and financial systems to enable predictive analytics that flag risks before they escalate into costly delays. AI-powered tools can further enhance efficiency by optimizing resource allocation and scheduling. At the portfolio level, executive dashboards uncover patterns that refine underwriting strategies and improve bidding accuracy.
CoreCast simplifies this process by integrating underwriting, pipeline tracking, and portfolio analysis into one seamless platform. Real estate professionals can monitor construction performance in real time, automate repetitive tasks, and make informed decisions at both the project and portfolio levels. Tools like Revenue Manager, which visualizes the performance of individual assets, and Portfolio Rollup, which consolidates data across the investment pipeline, provide actionable insights that empower teams to respond swiftly and effectively. With CoreCast's integrated features, real-time data drives predictive adjustments, ensuring smarter outcomes.
The shift toward predictive analytics is gaining momentum. A striking 72% of real estate owners and investors are already using or planning to adopt AI-enabled tools [24][25]. Incremental adoption of analytics turns raw data into insights that directly enhance project performance [22]. As Justin Loehn, Analytics Engineer at RNGD, points out:
"The business side of analytics basically means putting a measure to performance and giving real-time information or real-time feedback on how we are performing on any given project, task or process" [22].
With construction productivity growing at just 1% annually compared to 2.8% in other sectors [5], leveraging analytics is essential to reducing delays and delivering projects on time and within budget. By transforming underutilized data into actionable insights, businesses can gain a decisive edge in a competitive market.
FAQs
How does data analytics help avoid construction delays?
Data analytics plays a critical role in keeping construction projects on schedule by turning raw data into practical insights. It helps teams spot potential problems early, allowing them to make smarter decisions before small issues turn into big delays. By pulling together data from various sources - like field logs, financial records, and supply chain metrics - teams get a clear, all-encompassing view of how their project is performing.
With tools like real-time dashboards and predictive analytics, teams can track vital metrics such as labor productivity and material availability. These tools send alerts when performance drifts off course, giving teams the chance to act quickly. Adjusting schedules and reallocating resources as needed helps reduce bottlenecks and keeps the project moving forward. Platforms like CoreCast make this process even smoother by consolidating data, predicting delays, and encouraging team collaboration, helping ensure projects stay efficient and deadlines are met.
What are the most important data sources for improving construction timelines?
To speed up construction timelines, bringing together all key data sources into one dependable view of the project is crucial. The most important data streams to consider include field operations data (like daily logs, crew hours, and equipment usage), financial data (such as budgets, invoices, and cost forecasts), scheduling data (critical path analyses and milestone tracking), and procurement data (material deliveries and vendor performance). On top of that, safety and quality metrics (incident reports and inspections) and design/BIM info (as-built models and clash detection) are essential for pinpointing risks and potential delays.
Real-time insights from IoT sensors (monitoring weather or equipment telemetry) and issue-tracking systems (like punch lists or subcontractor notes) add another layer of actionable information. By consolidating all these data points, platforms like CoreCast empower construction managers to identify bottlenecks, reassign resources, and adjust schedules in real time, ensuring projects stay on track and within budget.
How can AI improve construction schedules and resource planning?
AI is transforming construction scheduling and resource planning by processing vast amounts of data to deliver practical, real-time insights. With the help of machine learning, it can spot potential delays, refine resource estimates, and streamline project timelines. In fact, research indicates that AI can cut delays by around 18% and boost resource estimation accuracy by nearly 25% compared to traditional approaches.
The process starts by gathering and centralizing data from multiple sources, such as task durations, labor hours, and even weather conditions. Predictive models then forecast risks, while simulations explore the most efficient scheduling options. AI-powered tools also offer early warnings for challenges like material shortages or adverse weather, giving teams the chance to make timely adjustments. When used with platforms like CoreCast, these insights empower project managers to make informed decisions, ensuring projects stay on schedule and within budget.