
Top Metrics for Evaluating Student Housing Markets
Student housing is a unique real estate sector driven by academic calendars, not typical market cycles. Missing key leasing windows can lead to year-long vacancies, making data-driven metrics essential for success. Here are the key takeaways:
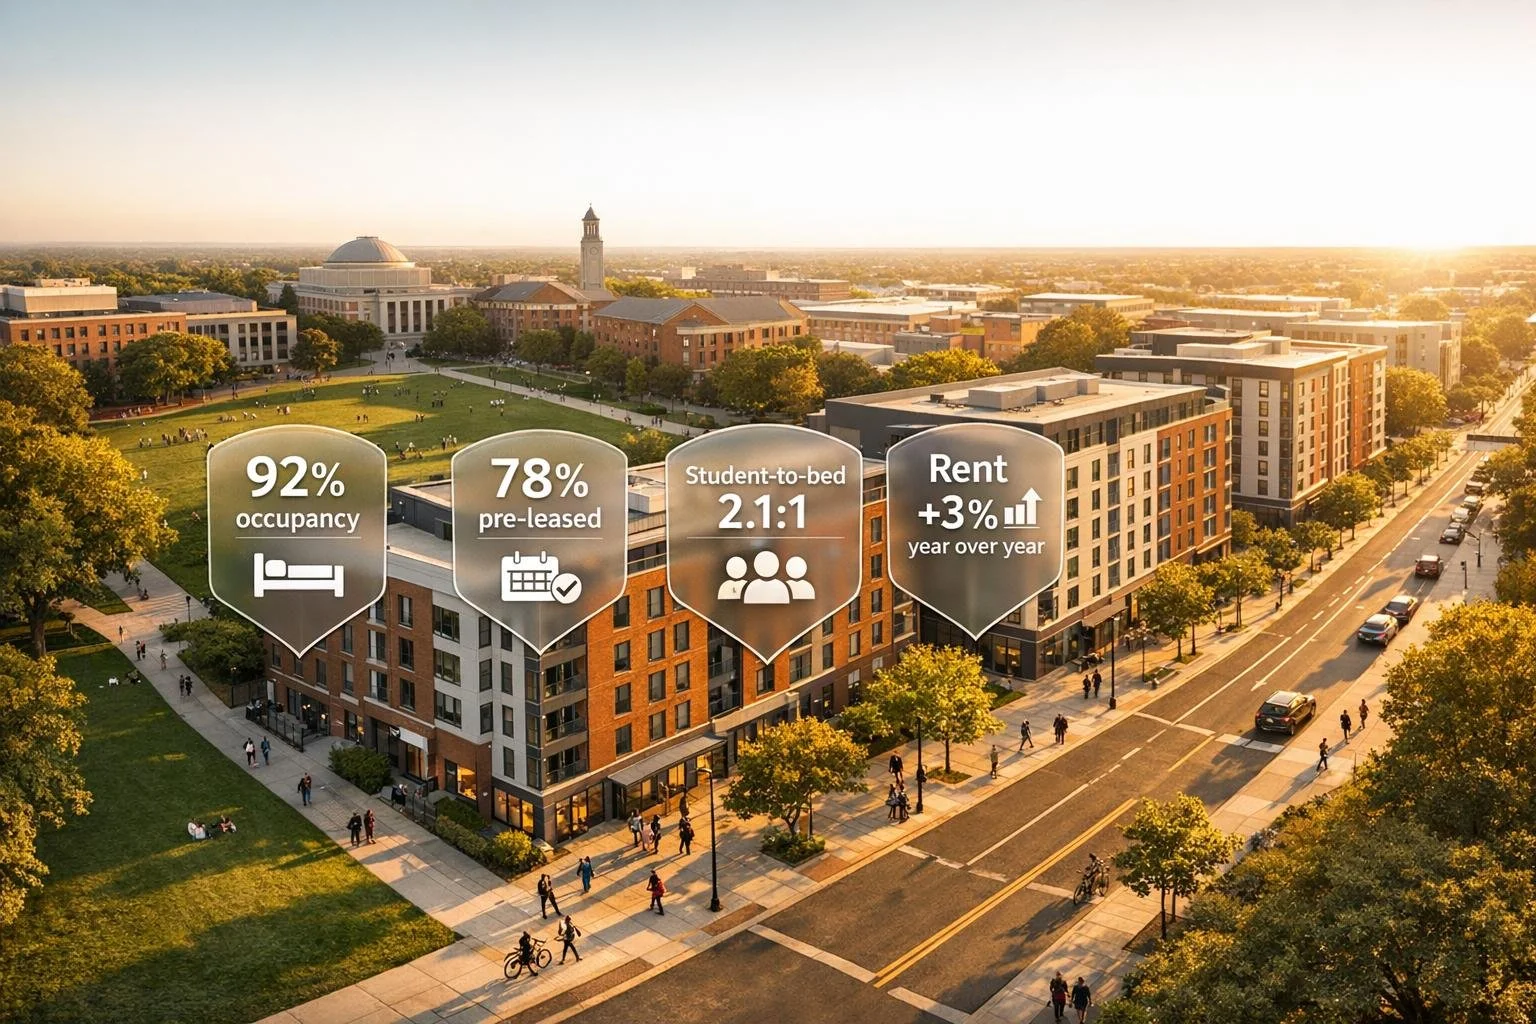
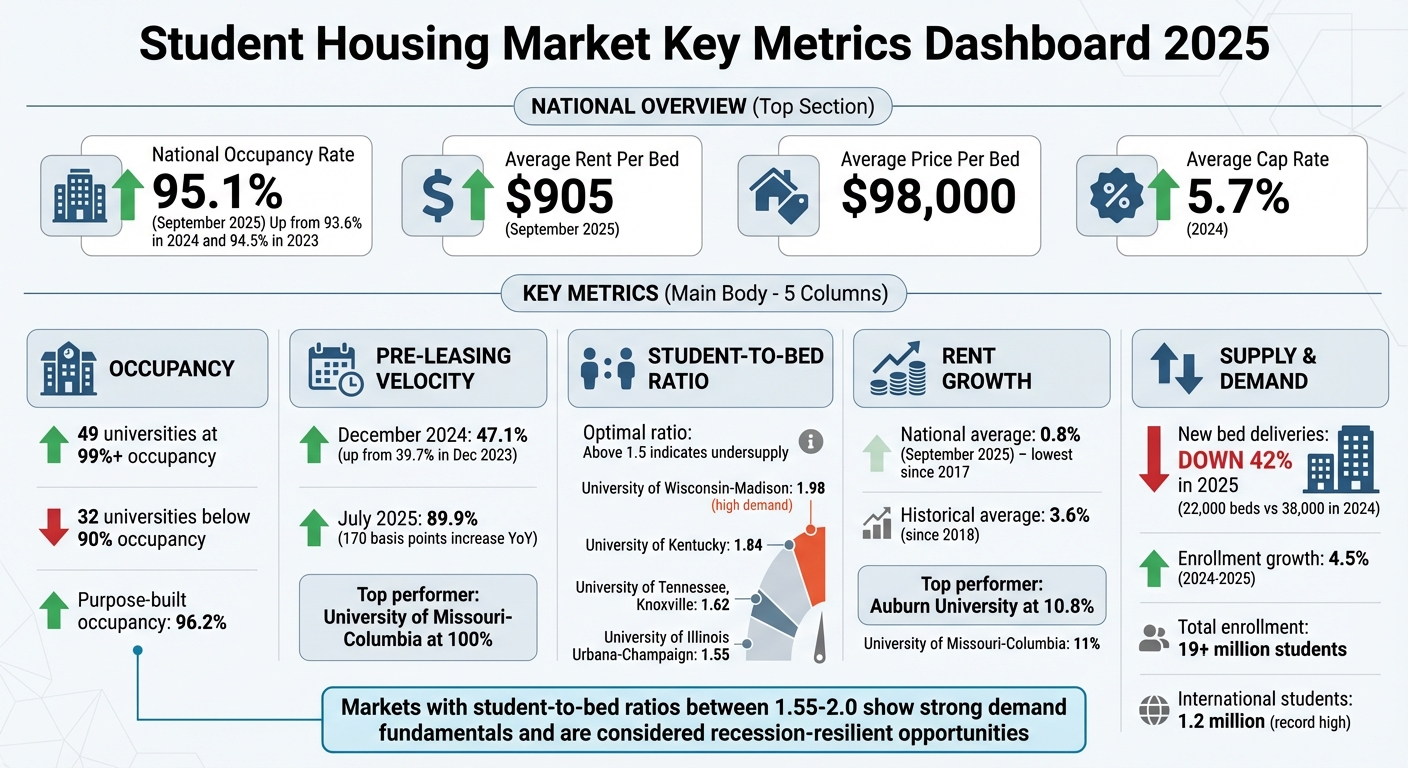
- Occupancy Rates: National occupancy reached 95.1% in September 2025. Markets like the University of Missouri-Columbia hit 100%, while others lagged below 90%.
- Pre-Leasing Velocity: 47.1% of beds were pre-leased by December 2024, up from 39.7% the prior year, showing students are booking earlier.
- Student-to-Bed Ratio: Ratios above 1.5 indicate housing shortages. For example, the University of Wisconsin-Madison reported a 1.98 ratio, driving rent growth.
- Rent Growth: Rent growth slowed to 0.8% in 2025, with some markets like Auburn University defying trends with 10.8% increases.
- Supply Trends: New bed deliveries dropped 42% in 2025, tightening supply while enrollment grew 4.5% in 2024–2025.
Tracking these metrics helps investors identify strong markets and manage risks in a sector shaped by enrollment shifts, supply constraints, and demographic trends.
Student Housing Market Key Metrics 2025: Occupancy, Pre-Leasing, and Rent Growth Statistics
Should you Invest in College Towns? Real Estate Investing for Beginners
sbb-itb-99d029f
Occupancy Rates and Pre-Leasing Metrics
Occupancy rates reflect past performance, while pre-leasing velocity provides a glimpse into future demand. Let’s take a closer look at what these metrics reveal about market dynamics.
Occupancy Rate Analysis
The occupancy rate shows the percentage of available beds filled at the start of the academic year. To calculate it, divide the number of occupied beds by the total number of beds available. In September 2025, the national occupancy rate reached 95.1%, an increase from 93.6% in 2024 and 94.5% in 2023 [2]. This upward trend highlights a tightening supply, with only 27,000 new beds delivered in 2025 compared to 35,000 the prior year [2].
Using a commercial real estate market comparison tool, we can see some markets are thriving, with 49 universities achieving 99% or higher occupancy in September 2025, up from 38 schools in 2024 [2]. However, not all markets are keeping pace - 32 universities reported occupancy rates below 90%, pointing to potential oversupply or enrollment challenges that need to be addressed [2].
Pre-Leasing Velocity Insights
Pre-leasing velocity measures how quickly students secure housing before move-in. For the 2025-2026 academic year, 47.1% of beds were pre-leased by December 2024, a notable jump from 39.7% in December 2023 [3]. This suggests students are acting earlier to lock in their preferred choices. By July 2025, pre-leasing rates had reached 89.9%, marking a 170-basis-point increase compared to the previous year [4].
These trends underline the growing urgency among students to secure housing well in advance, reflecting both market demand and shifting student behaviors.
Student-to-Bed Ratio as a Demand Indicator
The student-to-bed ratio offers a clear picture of whether a market's housing supply can meet the needs of its student population. It’s a straightforward way to determine if a market is short on housing or oversaturated.
How to Calculate the Student-to-Bed Ratio
To find this ratio, divide the undergraduate student population by the total number of available beds, both on- and off-campus [5]. A ratio higher than 1.5 generally points to a structural undersupply, meaning there aren’t enough beds for the students who need them [5].
When this ratio rises, it often translates into greater pricing power for landlords. As Kyle Matthews, CEO of Matthews™, puts it:
This ratio signifies a substantial housing deficit, ensuring a consistent tenant pool with high occupancy and strong rent growth [5].
This metric serves as a foundation for analyzing market demand, and real-world examples from universities help illustrate its impact.
Interpreting Ratios in High-Demand Markets
The student-to-bed ratio adds depth to market demand analysis, complementing occupancy and pre-leasing data. Let’s look at some universities where these numbers highlight significant housing imbalances.
In August 2025, the University of Wisconsin-Madison had a student-to-bed ratio of 1.98 [5]. With 35,399 undergraduates and only 17,876 available beds (8,800 on-campus and 9,076 off-campus), the market saw a 93.7% pre-leasing rate by May 2025 and a 4.6% annual rent increase [5].
The University of Kentucky faced similar conditions, reporting a 1.84 ratio in Fall 2024. With 25,586 undergraduates and just 13,932 beds, the market reached a 97.2% pre-leasing rate by June 2025, along with a 4.4% year-over-year rent hike [5]. At the same time, the University of Tennessee, Knoxville had a ratio of 1.62, reflecting a shortage of over 11,700 beds for its undergraduate population [5].
Markets with ratios between 1.55 and 2.0 consistently show strong demand fundamentals. For instance, the University of Illinois Urbana-Champaign reported a ratio of 1.55, with a housing deficit exceeding 13,200 beds. By July 2025, it had achieved a 94.9% pre-leasing rate for the 2025/2026 academic year [5]. These high ratios often represent what investors describe as "recession-resilient" opportunities, where demand consistently surpasses supply, even during economic downturns [5].
Rent Growth and Yield Metrics
Rent growth and yield metrics provide a clear picture of the financial performance of student housing investments. While the student-to-bed ratio illustrates demand potential, these metrics focus on the actual income generated by these properties.
Tracking Rent Growth Trends
Annual rent growth measures year-over-year changes in advertised rents, reflecting market momentum. In September 2025, annual rent growth slowed to 0.8%, marking the lowest rate since tracking began in 2017 [2]. This figure is a noticeable drop compared to the historical average of 3.6% since January 2018, signaling a cooling trend in the market.
After peaking with a 6.9% increase in 2022–2023, rent growth tapered to 5.7% in 2023–2024 and further dropped to 2.5% in 2024–2025 [2]. The average advertised rent per bed in September 2025 stood at $905, down from its March 2025 high of $920 [2].
Supply pressures are a significant factor behind this slowdown. For instance, the University of Tennessee had 3,261 beds under construction by March 2025, leading to a 6% rent decline - a sharp contrast to the 22.6% growth seen in March 2024 [6]. On the other hand, Auburn University defied this trend, posting 10.8% rent growth in March 2025 despite having 1,227 new beds under construction [6].
Not all markets are experiencing the same cooling effects. The University of Missouri-Columbia, for example, achieved 100% pre-leasing and an impressive 11% annual rent growth in September 2025, positioning it as one of the top performers for the fall 2025 academic year [2]. According to Yardi Matrix analysts:
For many schools, the difference in rent growth performance is correlated with preleasing pace and can be partly attributed to recent enrollment growth or declines and recently delivered supply [7].
Understanding Rental Yields
Rental yields, which compare annual rent per bed to acquisition costs, are another critical measure. In September 2025, the national average price per bed was $98,000, with core assets located within 0.5 miles of campus nearing $120,000 [2][8]. These dynamics underscore the importance of understanding yield performance.
The average cap rate for student housing was 5.7% in 2024, narrowing the gap with traditional multifamily properties [8]. Investors can use a real estate cap rate calculator to quickly assess these shifting values. This shift reflects growing investor confidence in the sector's stability. Additionally, the price of purpose-built student housing has risen 41.5% since 2019, reaching an average of $102,157 per bed in 2024 [8].
Yields are closely tied to factors like enrollment growth and supply constraints. In early 2025, the strongest rent growth markets reported average enrollment increases of 1,768 students, or 5.4% year-over-year [7]. These gains have helped sustain rent increases and yield stability, even amid slowing national rent growth.
High occupancy rates have also played a key role in maintaining yields. Nationally, occupancy reached 95.1% in September 2025, ensuring steady income streams [2]. Investment activity further highlights the sector's resilience, with $3.7 billion in transactions recorded during the first nine months of 2025. The consistent $98,000 average price per bed reinforces the view that student housing remains a solid investment opportunity [2].
Together, these metrics offer a detailed perspective on the financial health of the student housing market, complementing earlier demand indicators for a well-rounded analysis of market performance.
Demand Drivers: Enrollment and Supply Trends
Student housing demand is shaped by two key factors: enrollment growth and supply constraints. Together, they create a landscape filled with both opportunities and challenges.
Impact of Enrollment Growth on Demand
Student enrollment is the backbone of the student housing market [9]. For the 2024–2025 academic year, national higher education enrollment grew by 4.5%, pushing the total student population past 19 million [1]. However, this growth is far from evenly distributed.
A small group of universities accounted for a significant chunk of this increase. Just 10 institutions represented nearly one-third of the total enrollment growth in 2024 [1]. Larger universities, especially those with more than 30,000 students, saw an average enrollment increase of 3.5%, compared to 2.4% for smaller campuses with fewer than 12,000 students [1]. This highlights a trend: larger and highly selective schools are driving the bulk of both enrollment growth and housing demand [1][10].
International students also played a major role, with their enrollment reaching a record high of nearly 1.2 million for the 2024–2025 academic year [1]. However, challenges like visa delays and stricter vetting procedures caused a 12% drop in F-1 visa issuance in early 2025. This decline poses risks for schools with high international student populations, such as Columbia (40%) and NYU (37%) [1]. As RealPage observed:
With demographic declines on the horizon, ongoing visa delays, and rising construction costs, student housing now faces a more complex and uncertain chapter [1].
Geography also plays a critical role. Enrollment is booming in the South - states like Florida, Tennessee, and Texas are leading the way - while the Midwest and Northeast are seeing declines [1]. Southern markets with rapid enrollment growth are experiencing strong demand, with near-record absorption and high occupancy rates, even as new supply is introduced. In 2024 alone, about 52,000 beds were absorbed in the off-campus market, marking the strongest demand since 2015 [1].
Looking ahead, a demographic cliff looms post-2025, as a decline in U.S. high school graduates could slow enrollment growth and intensify competition among universities [1]. Investors are advised to focus on "Power 5" conference schools and institutions in states with growing populations to navigate these challenges [1][10]. When paired with limited new housing supply, these enrollment trends are putting additional pressure on the market.
Effects of Supply Constraints
The supply of new student housing is shrinking. Bed deliveries are expected to drop by 42% in 2025, from 38,000 in 2024 to just 22,000 beds the following year [1]. Rising construction costs, labor shortages, and tighter lending conditions are the main culprits behind this decline.
This slowdown in construction comes at a time when demand remains strong at certain institutions. With limited new housing being built, occupancy rates are climbing to near-capacity levels. By September 2025, national student housing occupancy reached 95.1%, while purpose-built student housing hit 96.2% in 2024 [1][2].
When demand outpaces supply, rental rates naturally rise. For instance, the University of Missouri-Columbia achieved 100% pre-leasing and saw an impressive 11% annual rent growth in September 2025, making it one of the top-performing schools for the fall 2025 academic year [2]. Across top universities, average rents increased by 6% in 2024, following a 9% jump in 2023 [1].
Adding to the challenge, development costs are climbing. Tariffs on steel, aluminum, and HVAC systems have doubled, while skilled labor shortages persist, making new construction more expensive [1]. These rising costs are slowing the development of new beds, creating a gap between growing demand and limited supply. This shortfall in on-campus housing spills over into the off-campus market, driving near-record absorption rates for purpose-built student housing [1].
Using Technology for Market Analysis
Tracking market trends manually is outdated and inefficient. Today’s real estate intelligence platforms simplify the process by combining tracking, analysis, and forecasting into a single system. This allows investors to make quicker, better-informed decisions - essential in a market where timing is everything.
Benefits of Real-Time Data Tracking
Real-time platforms provide instant access to critical metrics like occupancy rates, rent trends, and pre-leasing data. Unlike traditional methods that rely on quarterly reports, these platforms let investors spot changes as they happen, enabling timely strategic adjustments.
Take this example: pre-leasing levels at Yardi 200 schools hit 67.1% in March 2025, a noticeable slowdown compared to the previous year [11]. With real-time tracking, investors could identify this trend early and respond by offering concessions or tweaking their marketing strategies before the peak leasing season wrapped up.
These platforms also allow users to compare current performance with historical data. If leasing cycles fall short of expectations, investors can pivot quickly. Yardi Matrix highlights this benefit:
Make smart business decisions faster with comprehensive market and research data that helps identify deals, grow returns and mitigate risk [11].
In addition to tracking current metrics, these tools combine operational data with predictive insights to optimize long-term performance. For instance, investors can analyze how a shrinking supply pipeline - new bed deliveries dropped 23% by September 2025 - might impact future occupancy and rent growth [2].
Real-time tracking also feeds seamlessly into advanced portfolio analysis, creating a unified approach to market intelligence across assets.
Portfolio Analysis and Forecasting
Building on real-time insights, integrated portfolio tools offer a deeper analysis across different markets. By merging tracking data with predictive analysis, investors gain a clearer picture of how metrics like occupancy, rent, and demand interact, often using data analytics to forecast property values.
One example is CoreCast (https://corecastre.com), a comprehensive real estate intelligence platform. It streamlines complex tasks like underwriting assets, tracking pipelines, and benchmarking property performance against competitors. This eliminates the hassle of juggling spreadsheets and disconnected systems.
Forecasting tools are particularly valuable in the student housing market, where factors like enrollment and construction pipelines heavily influence performance. For instance, international student enrollment reached a record 1.2 million in the 2024–2025 academic year, while F-1 visa issuances dropped 22% by May 2025 [1]. Platforms like CoreCast help investors model these variables, offering visual tools like integrated maps to assess how regional enrollment shifts could impact their properties.
Benchmarking is another key feature. When the University of Missouri–Columbia achieved 100% pre-leasing and 11% annual rent growth in September 2025, portfolio analysis tools helped investors understand why it outpaced the national average rent growth of 0.8% [2]. These insights guide decisions about where to allocate resources for maximum return.
Advanced platforms also incorporate predictive analytics, blending operational data with broader market trends. As Yardi Matrix explains:
Lower costs, balance risk and increase revenue by combining operational data with predictive insights [11].
This is especially critical as the student housing market braces for a potential demographic decline starting in 2026 [1]. Forecasting tools help investors identify resilient markets while avoiding those likely to struggle.
Integrated workflows - syncing data across planning, leasing, and operations - create a unified decision-making framework. This is particularly useful for managing portfolios across multiple universities and regions, where local factors like enrollment trends and supply constraints can vary widely.
Conclusion
Keeping a close eye on key metrics is crucial when evaluating student housing markets. Metrics like occupancy rates, pre-leasing velocity, student-to-bed ratios, and rent growth trends are essential for gauging market health. However, there’s more beneath the surface - concessions, for instance, averaged 8.5% of asking rent in 2024, hinting at softer demand despite what headline numbers might suggest [1].
These metrics also highlight how the market is evolving. For example, U.S. high school graduate numbers are expected to decline starting in 2026, which could reduce demand, while new bed deliveries are projected to drop significantly as well [1]. In this shifting landscape, investors should focus on markets with limited supply and universities with strong enrollment trends. Larger institutions generally outperform smaller ones. A standout example is the University of Missouri-Columbia, which achieved 100% pre-leasing and an impressive 11% annual rent growth as of September 2025 [2].
Manually tracking these metrics can be a tedious and error-prone process. Real-time data platforms offer a solution by eliminating the delays and inaccuracies of traditional methods, making it easier to identify trends and adapt strategies quickly. This approach ties back to the earlier emphasis on the importance of real-time data in a fast-changing market. Platforms like CoreCast (https://corecastre.com) streamline processes by combining underwriting, pipeline tracking, competitive benchmarking, and portfolio analysis into a single system, giving investors a comprehensive view of their assets and the competitive landscape.
FAQs
What drives high occupancy rates in student housing?
High occupancy rates in student housing often come down to three main factors: location, unit design, and demand trends. Properties situated near major universities or campuses naturally attract more tenants because of their convenience. After all, being close to classes, libraries, and campus events is a big plus for students.
The design of the units also matters. Students are drawn to layouts that prioritize privacy and comfort - think private bedrooms and fully equipped kitchens. These features make daily life easier and more enjoyable, which increases the property's appeal.
Another key driver is rising university enrollment numbers. As more students enter college, the demand for housing - especially off-campus options - goes up. Properties that offer modern amenities, solid safety features, and regular upkeep tend to stand out, as they align with what today’s students expect. By focusing on these elements - location, thoughtful design, and keeping up with demand - student housing properties can maintain high occupancy rates year after year.
What is the student-to-bed ratio, and how does it affect rent growth and market demand?
The student-to-bed ratio reflects how many students are vying for the available housing options in a given market. A higher ratio typically means demand outweighs supply, with more students competing for fewer beds. This imbalance can lead to higher occupancy rates and potential rent increases, making it a critical factor for assessing student housing market performance.
Real estate professionals often rely on this ratio to grasp market trends and pinpoint areas with strong demand, offering opportunities for investment or new development projects.
Why is tracking real-time data essential for understanding the student housing market?
Tracking real-time data plays a crucial role in navigating the student housing market. It allows stakeholders to stay on top of fast-evolving trends like occupancy rates, rental pricing, and seasonal demand shifts. This sector is particularly fluid, influenced by variables such as university enrollment numbers, regional demand changes, and leasing cycles. With real-time insights, property managers and investors can spot opportunities or potential risks early, fine-tuning their strategies to stay competitive.
Using real-time data also leads to more precise forecasting, better leasing strategies, and competitive rental pricing. For example, analyzing pre-leasing patterns or demand for specific unit types can streamline operations and boost profitability. Tools like CoreCast make this easier by consolidating key real estate data into a single platform, empowering stakeholders to make smarter, quicker decisions in the fast-paced student housing landscape.