
How Portfolio Analytics Software Improves CRE Decisions

Managing commercial real estate (CRE) portfolios is becoming increasingly complex. Rising costs and growing portfolios make outdated tools like spreadsheets ineffective. Portfolio analytics software solves this by centralizing data, automating workflows, and enabling real-time decision-making. Here’s what it does:
- Centralized Data: Combines property management, accounting, and market data into one platform for accurate insights.
- Scenario Modeling: Quickly test "what-if" scenarios, like rent changes or interest rate hikes, to predict outcomes.
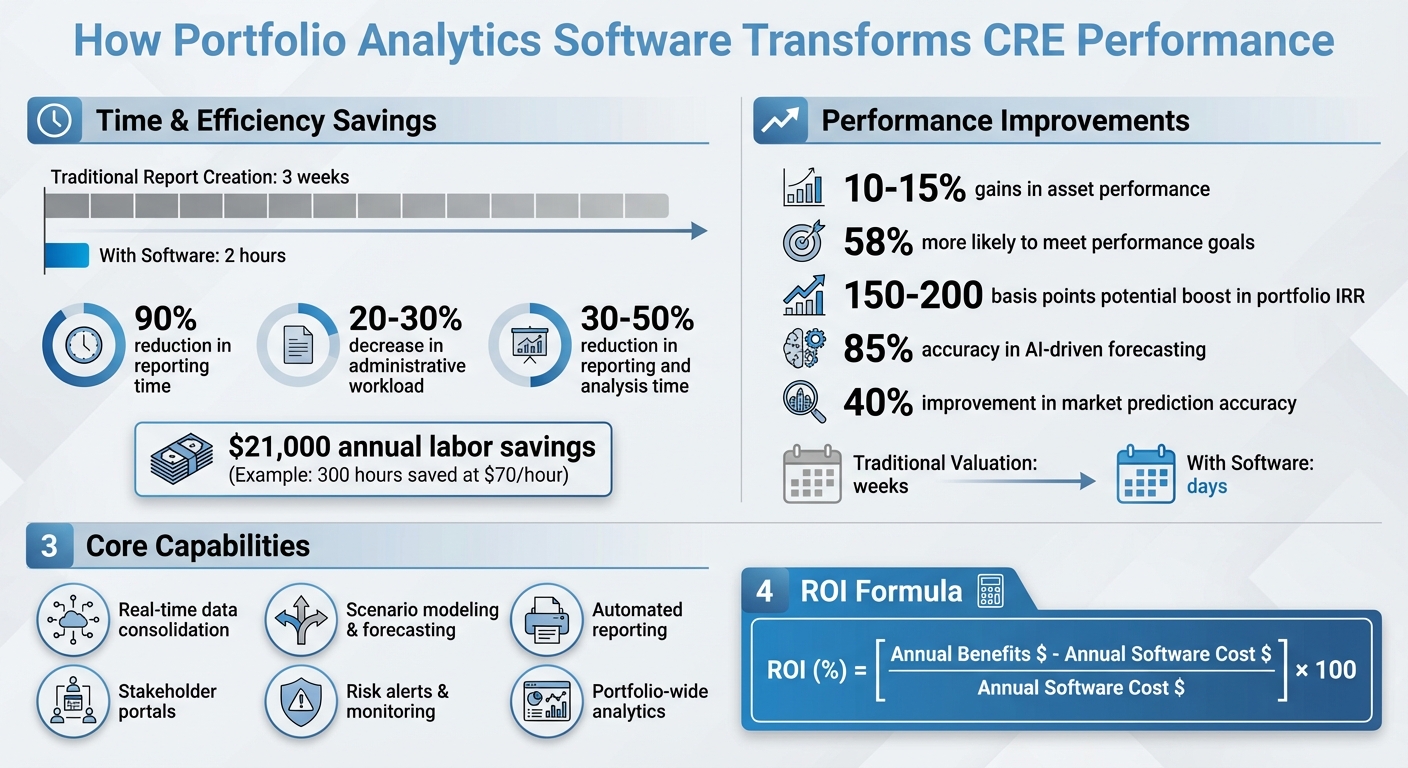
- Automated Reporting: Cuts reporting time by up to 90%, ensuring error-free updates for investors and lenders.
- Improved Performance: Firms using these tools see 10–15% gains in asset performance and reduced operational errors.
Platforms like CoreCast offer advanced features, including AI-driven forecasting, deal tracking, and personalized stakeholder reports. By integrating these tools, CRE professionals can make faster, more informed decisions while reducing risks and inefficiencies.
Portfolio Analytics Software Benefits: Key Statistics and Performance Metrics
Utilize Data and Analytics in Commercial Real Estate | Stash Gelezinski
Core Features of Portfolio Analytics Software
Portfolio analytics software has revolutionized how commercial real estate (CRE) professionals manage their assets. By replacing scattered spreadsheets with a centralized system, these platforms streamline everything from data collection to communication with stakeholders.
Real-Time Data Consolidation
At the heart of any portfolio analytics tool is its ability to consolidate data from multiple sources into one unified dashboard. Instead of jumping between different systems, the software automatically syncs updates across platforms. For instance, when a lease is signed or an expense is logged, that information is instantly reflected in your portfolio dashboard. This ensures that rent rolls, lease terms, operating costs, debt schedules, and market data are always up to date.
This real-time data access enables immediate insights and scenario analysis, helping you evaluate risks before making investment decisions[2]. With advanced analytics layered on top, these platforms offer a deeper understanding of portfolio performance.
Portfolio Analysis and Forecasting Tools
Once your data is centralized, the software provides advanced tools to evaluate performance and model potential outcomes. Key metrics like rental income, net operating income, cash flow, and property appreciation are all displayed in unified dashboards, making it easy to pinpoint which assets are excelling and which require attention.
Forecasting features allow you to simulate various scenarios with ease. Curious about the impact of a 10% vacancy increase on your cash flow? Or how refinancing at higher interest rates might affect your debt service coverage ratio? These platforms let you model these changes at both the individual property level and across your entire portfolio - no spreadsheets required.
Research shows that firms leveraging these tools are 58% more likely to meet performance goals, with live insights driving 10–15% gains in asset performance through proactive management[8][4]. Some platforms even integrate AI-driven forecasting, achieving up to 85% accuracy by analyzing millions of lease and market data records[8].
These analytics also feed directly into automated reporting, keeping stakeholders informed with minimal effort.
Automated Reporting and Stakeholder Updates
Manual reporting can be one of the most time-consuming tasks in CRE management. Portfolio analytics software eliminates this hassle by generating tailored reports for different audiences - whether it’s internal teams, investors, or lenders - on a schedule you define. What used to take days can now be completed in just minutes.
Many platforms also offer investor portals, allowing stakeholders to log in and view real-time performance dashboards, access key documents, and track their returns without constant back-and-forth emails. Automated reporting has been shown to cut report creation time from three weeks to just two hours, while reducing overall administrative workloads by 20–30%[8]. Tools like CoreCast go a step further, offering a stakeholder center that delivers personalized, branded reports to investors, fostering transparency and trust. As Mitchell Rice, Principal at Elkstone Capital, shared:
"As a capital raiser, having reliable financial analysis is crucial to building trust with investors. They provided the expert financial analysis support I needed to strengthen my efforts."
How to Implement Portfolio Analytics Software
Assess Your Portfolio Needs and Goals
Start by identifying all the data sources you rely on, such as Excel files, property management systems, CRMs, and market subscriptions. Note how often these data sources are updated and who is responsible for maintaining them - whether it’s acquisitions, asset management, or accounting teams. Map out workflows for key activities like underwriting, portfolio reviews, lender reporting, and investor updates. Pay close attention to areas where manual processes, like consolidating data or managing version control, create delays or errors.
Next, set specific goals for your portfolio analytics. For example, you might aim to reduce underwriting times by 30% or speed up scenario analyses. If your firm is growth-focused, you may prioritize running faster scenarios on interest rate fluctuations or vacancy rate changes. For long-term investors, goals might include spotting underperforming assets earlier or refining hold-versus-sell strategies. Translate these goals into software requirements. Ensure the platform can handle essential calculations like cap rate, IRR, and cash-on-cash return across assets. It should also support portfolio-level stress tests - like assessing the impact of a 200 basis point interest rate hike or a 10% market rent drop - and allow you to segment performance data by asset class, market, or sponsor.
Finally, establish baseline metrics, such as the current time it takes to generate an investor report or the frequency of data errors. These benchmarks will help you measure the software’s effectiveness later.
Set Up and Connect the Software
Begin by defining your data model. This includes organizing data for properties, deals, loans, investors, and tenants. Securely connect your data sources - whether through APIs or scheduled imports - to automatically pull in key information like rent rolls, general ledger data, budgets, and valuations. Before integrating everything, take the time to clean and standardize your data to avoid issues down the line.
Next, configure user roles and assign a product owner to oversee the setup process. This person can help design dashboards and coordinate training. For platforms like CoreCast, the setup process also includes defining pipeline stages (e.g., Sourced, Initial Screen, LOI, Under Contract, Closing), deal types, and asset-class-specific fields. This ensures that underwriting, pipeline tracking, and portfolio analytics are all built on a consistent foundation.
Once your system is configured, you’ll be ready to leverage its features to improve decision-making right away.
Use Key Features to Make Better Decisions
With your data fully integrated, take advantage of real-time monitoring to track critical metrics across your portfolio. Set alerts for key thresholds like occupancy rates, expenses, or DSCR levels. Use scenario modeling tools to quickly evaluate how changes - such as a spike in vacancies or rising operating expenses - might affect metrics like NOI, IRR, and asset valuations. These alerts and models empower asset managers to act quickly when issues arise.
Scenario planning tools are another powerful feature. Test "what-if" scenarios, such as a 10–15% vacancy rate increase, slower rent growth, higher operating costs (like insurance or taxes), or fluctuating interest rates. The software will recalculate key metrics - NOI, DSCR, IRR, equity multiple, and asset values - so you can see how sensitive your portfolio is to different variables. This helps acquisition teams evaluate offers under various conditions and supports asset managers in deciding whether to hold, refinance, or sell. Platforms like CoreCast also let you compare original underwriting assumptions with current performance and new scenarios, improving both deal evaluations and long-term portfolio strategies.
Finally, streamline your reporting process by automating monthly, quarterly, and annual updates. Configure templates to generate standardized reports with key performance indicators - such as NOI, IRR, occupancy, leverage, and distributions - along with variance analyses comparing budgets to actuals. Use segmented distribution lists to ensure that investors, lenders, and internal teams receive reports tailored to their needs. Investor dashboards with self-service access can further reduce ad-hoc requests and improve transparency, strengthening trust with stakeholders.
sbb-itb-99d029f
How Portfolio Analytics Changes CRE Decision-Making
Better Investment and Acquisition Decisions
Portfolio analytics takes the guesswork out of acquisitions by offering portfolio-wide insights rather than isolated deal evaluations. For instance, instead of just analyzing a $25 million multifamily deal in Dallas on its own, professionals can instantly see how it impacts overall metrics like net operating income (NOI), debt service coverage ratio, and geographic diversification. By consolidating data - rent rolls, lease terms, market trends, and debt assumptions - the software enables comparisons across asset types, making it easier to identify deals that reduce risk and improve stability [2] [3] [8].
Scenario modeling adds another layer of precision by quantifying risk factors like a 10% dip in rent or a 200-basis-point interest rate hike. This allows users to stress-test acquisitions and pinpoint assets that might struggle under changing conditions. Some platforms even integrate AI-driven forecasting and automated valuation models, which can improve market prediction accuracy by up to 40% and cut valuation timelines from weeks to days [8].
This approach also helps with decisions about whether to hold or sell. For example, software can compare the 10-year cash flow projections, tenant improvement costs, and rollover risks of selling an older suburban office building versus reinvesting in industrial properties. Scenario modeling might reveal that keeping the office asset could increase vacancy risks during lease expirations, while acquiring properties with long-term leases could extend the weighted average lease term and stabilize cash flows. Such insights could potentially boost portfolio internal rates of return by 150–200 basis points [2] [4] [8]. These tools not only refine acquisition strategies but also streamline day-to-day operations.
More Efficient Operations
Real-time data integration eliminates the need for manual entry of income and expense data. Portfolio analytics platforms sync directly with property management and accounting systems, standardizing tasks like chart-of-accounts mapping and calculating NOI or cash flow at both the property and portfolio levels. Instead of waiting until the end of the month, these metrics are updated daily or weekly, saving time and improving responsiveness [2] [8]. Administrative work, like processing rent rolls, can see time savings of 20–30%, while reporting cycles shrink from weeks to just hours [8].
Dashboards and alerts help teams address issues before they escalate. For example, if utility costs exceed the budget by 10% or occupancy drops below a certain threshold, the system sends alerts, prompting immediate action such as revising leasing strategies or cutting expenses [2] [4]. Lease expiration tracking across the portfolio ensures that renewals are prioritized where they will have the most significant revenue impact, preventing unexpected cash flow disruptions [4] [7].
Automating Excel consolidations for large portfolios saves teams days of work, freeing up time for strategic planning or refining business strategies. Platforms like CoreCast enhance this efficiency with features like integrated maps and portfolio views, making it easy to identify underperforming markets or property types that need attention.
Increased Stakeholder Trust Through Clear Reporting
Efficiency improvements lead to better reporting and stronger stakeholder confidence. Standardized reporting templates pull live data directly from integrated systems, reducing manual errors and ensuring consistency. Investors and lenders expect clear, detailed reports covering metrics like NOI, occupancy rates, debt ratios, lease expirations, capital projects, and comparisons to budgets and underwriting [8] [7].
"Having a tailored and precise model became the cornerstone of our capital-raising efforts. The streamlined models increased investor confidence." - Justin Britto, Principal, Maddison Communities AZ
Measuring ROI from Portfolio Analytics Software
Calculate Time and Cost Savings
Start by documenting your current reporting processes and tracking the hours spent on manual tasks. This includes consolidating Excel files, extracting data from property management systems, preparing investor updates, and generating portfolio reports. Multiply the total hours spent weekly by your team’s hourly rate to calculate your baseline labor cost in U.S. dollars.
Once you’ve implemented portfolio analytics software, compare the time required for these tasks. Many firms report a 30–50% reduction in reporting and analysis time thanks to automation [2][5][6]. For instance, if a portfolio analyst earning $70 per hour saves 25 hours per month on reporting, that translates to 300 hours annually - resulting in approximately $21,000 in labor savings. This doesn’t even account for the added benefits of reduced errors and faster deal execution [5].
Don’t forget to include the cost of errors. Manual data entry and spreadsheet consolidation increase the likelihood of mistakes, such as incorrect rent escalations or overlooked lease expirations, which can lead to financial losses. To quantify your return on investment (ROI), use this formula:
ROI (%) = [(Annual Benefits in $ - Annual Software Cost in $) / Annual Software Cost in $] × 100
Annual benefits should include labor savings, avoided error costs, and any additional income or value gains from better decision-making. These savings provide a solid foundation for evaluating broader improvements in portfolio performance.
Track Portfolio Performance Improvements
Time savings are just the beginning - next, analyze how the software impacts your portfolio’s financial performance. Compare same-store net operating income (NOI) growth before and after implementation, making adjustments for acquisitions and dispositions. Use the platform to pinpoint underperforming assets based on metrics like rent per square foot, expense ratios, or occupancy rates. Then, track NOI improvements after implementing the changes suggested by the analytics [2][4]. Industry data shows that real-time insights can lead to 10–15% gains in asset performance [4].
Additionally, monitor forecast accuracy by comparing projected results to actual outcomes over multiple periods. Enhanced data and scenario modeling can reduce forecasting errors, helping you avoid losses from unexpected vacancies or poorly timed refinancings [5][11]. Keep an eye on key metrics like delinquency rates, vacancy exposure, lease rollover schedules, and tenant concentration risks. Automated risk scoring and early-warning dashboards can quantify how much credit losses and downtime decrease compared to your pre-software baseline [5][10].
While these immediate benefits are clear, the long-term advantages of data-driven decisions are even more impactful.
Long-Term Benefits of Data-Driven Decisions
With access to real-time insights and flexible scenario planning, your long-term decisions become more resilient, even during market fluctuations. Measure how quickly major decisions - like acquisitions, dispositions, refinancings, or large lease agreements - are made before and after adopting the software. Faster, more informed decisions can shorten transaction cycles, help you secure competitive bids, exit underperforming assets sooner, and maintain stability during economic shifts [4][5][9][10].
CoreCast streamlines ROI measurement by combining underwriting, pipeline tracking, portfolio analysis, and stakeholder reporting into one platform. This integration reduces complexity and ensures you have the data needed to quantify the benefits accurately. As your team becomes more proficient with advanced features like scenario analysis and AI-driven recommendations, revisit your ROI calculations annually to capture the full scope of value the software provides [2][5].
Conclusion
Portfolio analytics software has become an essential tool for commercial real estate professionals looking to stay competitive in today's fast-paced market. By bringing together scattered data, automating tedious reporting tasks, and delivering real-time insights, these platforms are reshaping how firms assess opportunities, manage assets, and engage with stakeholders. Companies that adopt such integrated solutions often experience measurable improvements in efficiency and overall performance.[4][6] This shift paves the way for faster, more confident decision-making throughout the asset lifecycle.
The real game-changer lies in the speed and confidence these tools bring. For instance, one case study showed how centralized analytics helped unlock significant cash flow by enabling rapid evaluation of multiple opportunities.[6] Instead of spending countless hours consolidating data, teams can redirect their energy toward strategy and growth.[8]
CoreCast is a standout example of this comprehensive approach. It integrates underwriting, pipeline tracking, portfolio analysis, competitive mapping, and stakeholder reporting into one seamless platform. As mentioned earlier, CoreCast allows users to switch effortlessly between forecasts and related data, generate instant portfolio summaries, and create personalized, branded reports. This functionality empowers firms to make real-time, data-driven decisions. Clay Heighten, Principal at Caddis Healthcare RE, captures the value perfectly:
"They have seamlessly provided the expertise and support we needed to streamline our operations and make smarter, data-driven decisions."[1]
FAQs
How can portfolio analytics software enhance decision-making in commercial real estate?
Portfolio analytics software plays a crucial role in improving decision-making within the commercial real estate sector. By consolidating essential data into one platform, it enables detailed performance analysis and provides reliable forecasts. The real-time insights these tools offer help professionals spot opportunities, optimize asset management, and address risks more effectively.
For investors and managers, this means making smarter, data-backed decisions that not only enhance portfolio performance but also simplify operations - setting the stage for more strategic, long-term growth.
How does portfolio analytics software help improve efficiency in real estate operations?
Portfolio analytics software boosts efficiency by offering real-time insights, pipeline tracking, and powerful data analysis tools. These features help real estate professionals keep a close eye on asset performance, simplify workflows, and make quicker, more precise decisions based on data.
With all essential tools housed in a single platform, users can cut down on manual work, reduce mistakes, and concentrate on strategic planning. This not only streamlines operations but also supports better investment and management choices, saving time and driving productivity.
How can companies evaluate the ROI of portfolio analytics software?
Companies can assess the return on investment (ROI) of portfolio analytics software by examining tangible improvements in critical areas such as decision-making precision, asset performance, and operational workflows. For instance, metrics like occupancy rates, rental income, capital appreciation, and deal cycle times can be compared before and after adopting the software to measure its impact.
Beyond these metrics, monitoring forecast accuracy and stakeholder satisfaction provides additional insight into how well the software supports business goals. By leveraging this data, firms can gauge how the platform enhances their investment strategies and fine-tunes overall portfolio management.