
GIS in Real Estate: Demand and Supply Explained

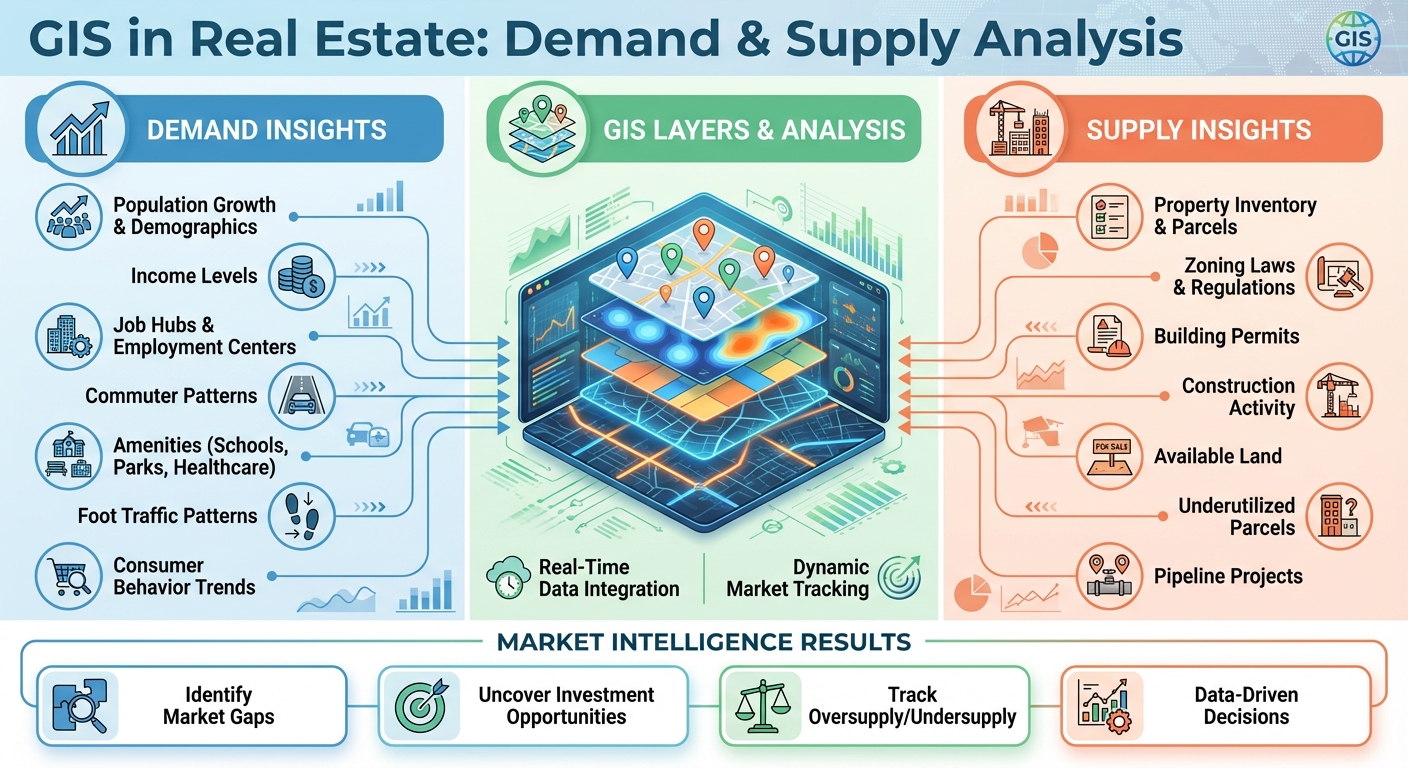
GIS (Geographic Information System) is transforming real estate by turning raw data into interactive maps that reveal market patterns and trends. It helps professionals analyze demand and supply by layering factors like demographics, zoning, infrastructure, and market activity. Here's why GIS is essential for real estate:
- Demand Insights: GIS identifies demand drivers like population growth, income levels, and job hubs. It pinpoints areas with unmet needs, helping developers and investors target opportunities.
- Supply Analysis: By mapping property data, zoning laws, and construction activity, GIS highlights available land, underutilized parcels, and supply constraints.
- Market Balance: Combining demand and supply layers, GIS uncovers gaps, such as high-demand areas with limited housing or oversupplied regions with low demand.
- Real-Time Updates: GIS tracks market changes, offering dynamic tools to adapt to trends like rental price shifts or new infrastructure development.
Platforms like CoreCast take GIS further by integrating data into interactive maps, enabling precise market analysis, portfolio tracking, and investor reporting. GIS helps make smarter, data-driven decisions in real estate.
How GIS Analyzes Real Estate Demand and Supply
Mapping Real Estate Demand with GIS
Demand Drivers Captured by GIS
GIS brings together a variety of datasets to uncover what drives real estate demand. For instance, analyzing census data on population density and growth rates alongside housing unit availability can pinpoint neighborhoods with growing residential needs [2][8]. Factors like income levels, age demographics, and household sizes also provide insights into where demand is strongest. High-income areas near job hubs, for example, often show heightened interest in residential properties [4].
Job centers are another critical piece of the puzzle. By mapping where jobs are concentrated and studying commuter patterns, GIS can highlight areas ripe for new housing developments or retail spaces [2][4]. Economic trends, such as the opening of new businesses, increased retail activity near emerging office spaces, and sector-specific employment growth, further help identify demand hotspots for both commercial and residential properties [4][8]. These combined insights allow for precise demand mapping across property types.
Demand Mapping Examples
In residential real estate, GIS can combine population growth data with the presence of amenities like schools, parks, and healthcare facilities to identify family-friendly zones. Developers often use this information, along with data on flood risks and infrastructure access, to target expanding suburbs for new projects [2][8]. This approach transforms raw demographic data into actionable strategies for site selection.
For commercial properties, GIS focuses on factors like foot traffic, competitor locations, and consumer behavior trends. Retailers use this data to spot high-demand streets with gaps in the market - areas missing specific brands or services based on real-time analysis [4]. When it comes to industrial properties, GIS integrates logistics data, such as highway and rail connectivity, land availability, and proximity to ports, to identify ideal sites. Growth in manufacturing or warehousing employment further supports these opportunities [2][4].
Analyzing Real Estate Supply with GIS
GIS Insights into Property Supply
GIS brings property data to life by layering parcel boundaries, ownership records, and building permits. This creates a visual map that highlights existing properties, ongoing construction, and available land. Unlike spreadsheets, GIS reveals patterns like clusters of new developments or areas with limited supply, particularly in critical industrial zones [2][7].
By using inventory layers to display current stock and pipeline overlays to spotlight future projects, professionals can pinpoint underutilized parcels ripe for development. This approach not only identifies immediate opportunities but also supports economic expansion. For instance, Transwestern's ArcGIS StoryMap dashboard showcases U.S. industrial real estate trends with growth and absorption maps, offering a detailed look at market dynamics [7]. Such a comprehensive supply view is essential for understanding how regulations influence development.
Zoning and Land Use Data in GIS
Regulatory frameworks play a major role in shaping property supply, and GIS integrates zoning laws and land use data to provide deeper insights. By layering this information, GIS maps can show zoning boundaries, permitted uses, and restrictions. A site that might seem perfect on paper could be restricted to residential use or located in a no-build zone when zoning data is considered [2][5].
These layered insights are invaluable across the real estate sector. Developers can assess project feasibility, appraisers can refine property valuations by factoring in zoning alongside flood risks and infrastructure, and property managers can evaluate compliance and explore expansion opportunities. This data helps clarify how supply constraints and regulatory flexibility drive development trends [2][4][5]. When combined with demand analysis, these insights provide a well-rounded understanding of market dynamics.
Comparing Demand and Supply with GIS
Finding Market Gaps with GIS
GIS tools combine layers of demand and supply data to highlight areas where the market is out of balance. For instance, when factors like population growth, income levels, and foot traffic are layered alongside supply data - such as available inventory, zoning rules, and upcoming developments - areas with unmet demand become clear. A neighborhood experiencing rapid growth but offering limited housing options might stand out as a prime opportunity for investment.
For retail developers, void analysis is especially useful. It identifies neighborhoods lacking specific types of stores or services. By integrating multiple data layers, GIS uncovers opportunities across various property sectors. On the flip side, mapping low-demand signals - like reduced foot traffic or population decline - against areas with high inventory highlights markets with oversupply. This insight can guide strategies like lowering prices or repurposing properties to better fit the market [4].
This snapshot of market gaps serves as a foundation for more dynamic analysis as conditions evolve.
Market Adaptation and GIS Analysis
Markets don’t stay static, and GIS helps track these shifts in real time. By continuously incorporating data such as economic trends and development updates, GIS provides a constantly updated view of the market. This enables real estate professionals to make informed and flexible decisions. Dynamic analysis can anticipate changes, like how rezoning or shifts in population might alter demand [3].
A good example is post-COVID market analysis. GIS revealed that areas showing resilience had strong demand but limited supply, pointing to potential constraints in meeting future needs. Visual tools, like color-coded maps showing changes in rental prices compared to available inventory, make it easier to understand current trends and predict what’s coming next [1].
sbb-itb-99d029f
How CoreCast Uses GIS for Real Estate Intelligence

Integrated Mapping and Competitive Analysis
CoreCast's platform revolves around an interactive map that provides a comprehensive view of assets, pipeline deals, and competitor properties. This map allows users to layer properties with key demand and supply indicators such as population density, household income, rent levels, absorption rates, and vacancy rates across U.S. submarkets.
Take, for example, an investor evaluating a $25 million multifamily project. They can overlay data like existing inventory, new deliveries, lease-up velocity, and renter income bands across multiple radii to gauge market balance. The platform also lets users map competitor locations, comparable properties, and local amenities - like transit stops, schools, hospitals, and retail centers - alongside their own assets. By attaching data such as asking rents, occupancy rates, unit mixes, traffic counts, and sales comparables, users can gain a precise understanding of the competitive landscape. Advanced mapping tools go beyond simple radius circles, defining competitive areas with greater accuracy.
This interactive map acts as the central hub, tying together CoreCast's underwriting, pipeline tracking, and portfolio analytics.
Data Consolidation and Portfolio Analysis
CoreCast takes its mapping capabilities further by consolidating diverse datasets for deeper insights. Built as an end-to-end real estate intelligence platform, it integrates a GIS layer with a unified data model that pulls from both internal and external sources. Users can incorporate third-party and in-house data, which is standardized across asset classes. This enables consistent comparisons of demand metrics (like population growth, job growth, income, and foot traffic) and supply metrics (such as inventory, vacancy rates, and pipeline activity) across different markets.
At the portfolio level, CoreCast’s GIS tools aggregate properties and deals into spatial views, showcasing exposure by market, submarket, or even custom-drawn areas. Users can map out total invested equity, net operating income, and loan maturities by metro area, neighborhood, or other defined regions. This helps identify over-concentrations in specific geographies or asset types. Heatmaps provide a visual representation of where the portfolio might be overexposed to markets with rising vacancies or slowing rent growth, as well as areas with little or no exposure to high-growth corridors benefiting from strong demographic trends. Because pipeline deals are tracked by stage on the same map, users can anticipate how new acquisitions or developments might shift geographic or asset-class exposure before committing additional capital.
While CoreCast doesn’t function as a property management or accounting system, it can integrate with property management platforms to pull in key performance data - like NOI trends, occupancy rates, and concessions. This ensures the GIS tools reflect up-to-date operational realities.
Reporting and Stakeholder Collaboration
CoreCast simplifies reporting by allowing users to create custom-branded reports that combine maps, charts, and summaries into standardized or tailored templates. GIS visuals - such as trade-area maps, rent growth heatmaps, or competitor distributions - can be embedded alongside underwriting details, IRR projections, equity multiples, and risk assessments. With data automatically pulled from the live platform, reports remain consistent and up-to-date.
Reports can be exported as print-ready PDFs or shared as interactive web versions, where recipients can toggle data layers. Because CoreCast tracks both portfolio and pipeline data, recurring investor updates can include time-series maps that show how exposure and market conditions evolve over time, enhancing transparency and trust.
The platform also includes a stakeholder collaboration center, where teams across acquisitions, asset management, development, and capital markets can access shared map views, saved analyses, and standardized dashboards linked to specific assets or deals. For example, an acquisitions team might create a "Market Fit" map highlighting submarkets that meet specific demand and supply criteria, while asset managers can overlay real-time operational data to refine business plans. User permissions and annotation tools allow teams to leave comments on specific map areas - like "emerging life-science cluster" or "retail corridor in transition" - creating a lasting visual record of insights and strategies.
These features make CoreCast’s GIS framework a powerful tool for informed, data-driven decision-making in real estate.
Leverage the Power of Location Analytics in Real Estate | ArcGIS for Market Insights
Conclusion: GIS for Better Real Estate Decisions
GIS technology brings clarity to micro-market trends that citywide averages often overlook. By layering data like demographics, income levels, employment rates, infrastructure, zoning regulations, and upcoming developments onto interactive maps, professionals can uncover subtle market differences. These insights improve decision-making for site selection, underwriting, and portfolio strategies.[1][6][9]
Traditional reports can mask local performance nuances, but GIS tools provide detailed overlays that highlight hotspots, areas undergoing gentrification, and demand shifts driven by new infrastructure - often before conventional comparisons detect these changes.[1][6][9][10] Studies also show that real estate demand tends to be more elastic and volatile than supply, making GIS particularly effective for tracking how submarkets behave over time.[1] This capability naturally aligns with advanced platforms built to deliver real estate intelligence.
CoreCast takes GIS insights a step further by integrating them into a single platform. It offers real-time tools for underwriting, deal tracking, competitive mapping, portfolio analysis, and stakeholder reporting, all in one place. By streamlining these processes, CoreCast minimizes errors and simplifies complex spatial data, empowering professionals to make confident decisions without juggling multiple systems.
FAQs
How can GIS help identify areas with high real estate demand?
GIS is a powerful tool for pinpointing areas with high real estate demand by analyzing and displaying spatial data. It examines essential factors like population density, demographic shifts, access to infrastructure, and levels of economic activity to identify locations with promising growth opportunities.
By combining these data layers on an interactive map, real estate professionals can spot trends, anticipate future demand, and make informed decisions about where to invest or develop properties.
How does GIS help identify property supply challenges?
GIS offers an incredible way to tackle property supply challenges by diving deep into spatial data. It can analyze factors like land availability, zoning rules, infrastructure, and even natural obstacles. With GIS, you can easily spot areas where land supply is tight, see how zoning laws affect potential developments, and uncover physical barriers like challenging terrain or infrastructure gaps.
These insights are a game-changer for real estate professionals. They allow for more accurate forecasting of supply issues, smarter site selection, and better planning. The result? Smarter investments and a more efficient approach to resource allocation.
How do GIS tools reveal opportunities in the real estate market?
GIS tools play a key role in identifying opportunities within the real estate market by analyzing geographic and spatial data. They make it easier to spot areas with unmet demand, underserved neighborhoods, and regions that show potential for growth. By mapping out demand and supply patterns, real estate professionals can make smarter decisions about where to invest or develop.
These tools also offer real-time insights into market trends, allowing for strategies tailored to specific locations. With GIS, you can assess competitive landscapes, weigh potential risks, and uncover opportunities that might otherwise go unnoticed - all with improved accuracy and efficiency.