
How to Analyze Logistics Real Estate Markets
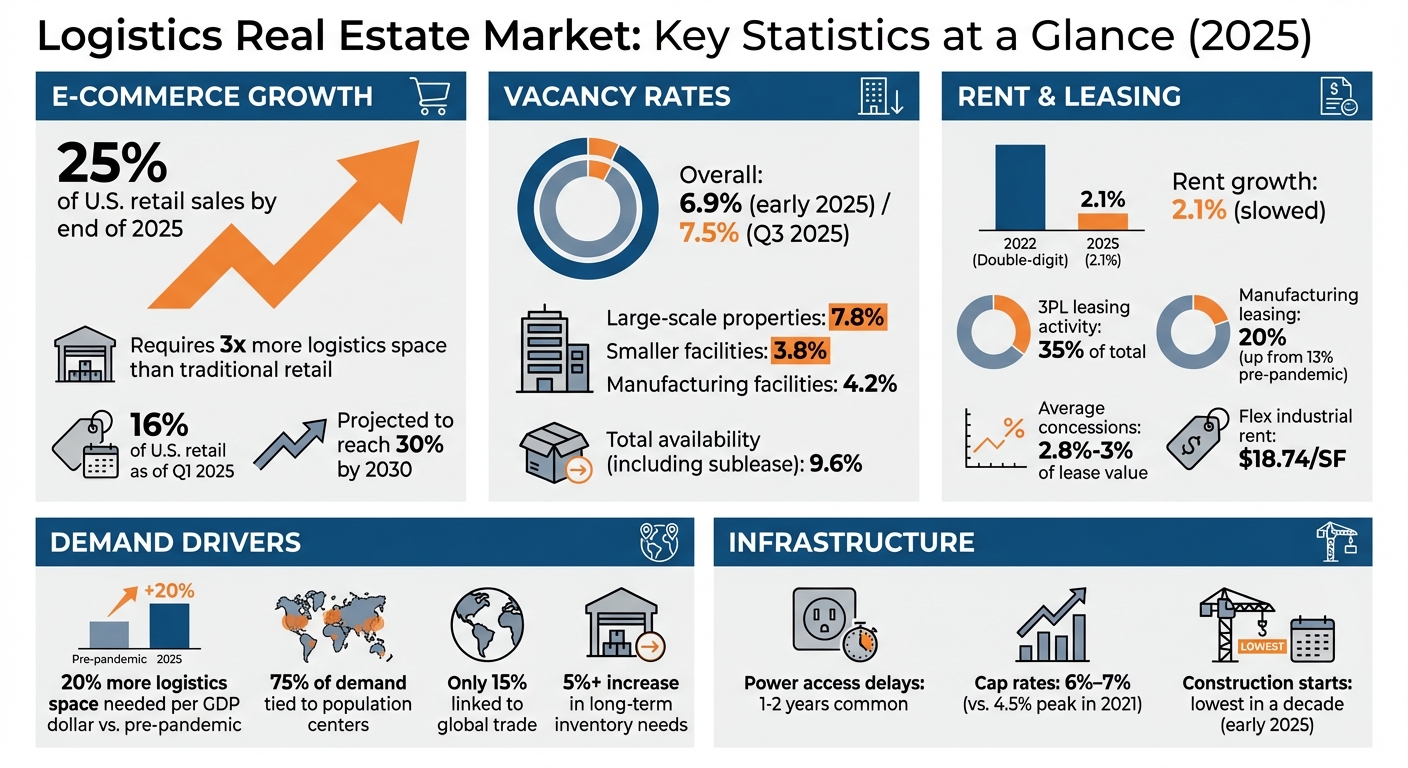
Logistics real estate is all about warehouses, distribution centers, and manufacturing facilities that power modern supply chains. With e-commerce expected to make up 25% of U.S. retail sales by the end of 2025, demand for efficient logistics spaces is growing. However, the market is shifting - vacancy rates hit 6.9% in early 2025, and rent growth slowed to 2.1%, compared to double-digit increases in 2022.
Here’s how to make sense of the market:
- Demand Drivers: E-commerce needs 3x more space than traditional retail. Third-party logistics (3PL) providers now account for 35% of leasing activity, and manufacturing is growing, especially in the Southeast and Central U.S.
- Location Matters: Facilities near population centers dominate demand, while power infrastructure delays are creating bottlenecks.
- Market Trends: Vacancy rates for large-scale logistics properties are higher (7.8%) compared to smaller facilities (3.8%). Tenant preferences are shifting toward modern, automation-ready buildings.
- Supply Challenges: Speculative construction has led to oversupply in some markets, while older properties face negative absorption.
Analyzing logistics real estate requires understanding demand, tracking market data, and evaluating supply-demand dynamics. Tools like CoreCast can simplify research, while focusing on trends like automation, nearshoring, and sustainability can help identify opportunities.
Key Stats at a Glance:
- E-commerce: 25% of U.S. retail sales by 2025
- Vacancy Rates: 6.9% overall, 7.8% for large-scale properties, 3.8% for smaller facilities
- 3PL Leasing Activity: 35% of total
- Rent Growth: Slowed to 2.1% in 2025
Understanding these factors can help you navigate a market that’s cooling but still full of potential.
Logistics Real Estate Market Statistics 2025: Key Metrics and Trends
Step 1: Identify Key Market Drivers
Analyze Demand Factors
To understand the forces shaping logistics real estate, start by examining the evolving demand dynamics. The rise of e-commerce has dramatically altered the landscape, requiring three times more logistics space compared to traditional brick-and-mortar retail [6]. This shift isn't just about storage - it's about adapting to a new model that prioritizes individual parcel fulfillment over bulk pallet movement.
Another striking trend: for every dollar of U.S. GDP, at least 20% more logistics space is now needed compared to pre-pandemic levels [6]. Between 2018 and 2023, consumer goods companies expanded their product offerings by 16%, and many have transitioned from "just-in-time" inventory strategies to "just-in-case" models. This change has driven a 5%+ increase in long-term inventory storage needs [6].
Third-party logistics providers (3PLs) are also reshaping the market. By enabling retailers to outsource distribution, 3PLs allow businesses to focus on their core strengths. These providers are projected to account for 35% of all industrial leasing activity by 2025 [2]. Meanwhile, manufacturing is playing a growing role in demand. In regions like the Southeast and Central U.S., manufacturing now represents 20% of new leasing activity, up from 13% before the pandemic [7].
Assess Location and Infrastructure Requirements
When it comes to logistics real estate, location strategy is often dictated by delivery timelines. Facilities can be categorized based on their role in the supply chain:
- Last Touch facilities: Found in urban areas, these properties handle deliveries within hours, often operating in older buildings with smaller footprints.
- City Distribution centers: These manage 1-to-2-day deliveries from urban hubs.
- Multi-Market and Gateway facilities: Positioned near ports and major transportation hubs, these serve broader regions within a one-day drive [1].
Interestingly, 75% of U.S. logistics demand is tied to locations near population centers for domestic delivery, while only 15% is linked to global trade [7]. Even in high-traffic port regions like Southern California, only 25% of demand is trade-related [7]. This consumer-driven pattern highlights the importance of proximity to dense, affluent populations over access to ports.
Power infrastructure is becoming a critical bottleneck. In many markets, delays of 1 to 2 years are common due to challenges in securing reliable power access [7]. Older facilities with existing power systems are now unexpectedly valuable. At the same time, modern facilities must accommodate automation and AI, requiring features like higher ceilings, advanced power setups, and extensive dock configurations. The rise of nearshoring has also underscored the importance of locations near major north-south highways, such as Interstates 29 and 35, and the Mexico border [2].
With a clear understanding of these demand and location factors, the next step is to gather actionable market data for deeper insights.
Step 2: Conduct Market Research and Data Collection
Use Industry Reports and Public Datasets
Once you've identified key market drivers, the next step is gathering reliable data to back up your logistics market analysis. A great starting point is the Freight Analysis Framework (FAF5), which offers estimates of freight flows between states and metropolitan areas. Covering all transportation modes and 42 different commodity types, FAF5 is an invaluable resource. You can use the FAF5 Data Tabulation Tool, available on the Bureau of Transportation Statistics website, to visualize and download origin-destination flow data [8] [9].
For a broader economic perspective, turn to the U.S. Census Bureau and Bureau of Labor Statistics. They provide critical data on construction spending, inventory levels, employment trends, and producer price indices [4]. If you're looking for more focused insights into the logistics market, reports from commercial real estate firms like CBRE and JLL are worth exploring. These firms publish detailed analyses on vacancy rates, net absorption, and rent growth, offering a variety of perspectives to validate your findings and highlight emerging trends.
Drilling deeper into the data, you can examine breakdowns by property size. This approach helps uncover micro-trends that broader aggregated figures might overlook, giving you a more nuanced understanding of the market.
Use Real Estate Intelligence Platforms
Public datasets are a solid foundation, but real estate intelligence platforms can take your research to the next level. These platforms consolidate data into a single, user-friendly workspace, saving time and improving accuracy. For instance, CoreCast (https://corecastre.com) is an all-in-one tool designed for logistics market analysis. It allows you to underwrite logistics assets, manage your deal pipeline, visualize properties and competitive landscapes on integrated maps, and conduct advanced portfolio analysis - all in one place.
These platforms also track detailed metrics that might otherwise go unnoticed. For example, sublease availability is currently at a historic high of 1.1% of total inventory. When combined with direct vacancy, total market availability rises to 9.6%, painting a more complete picture of market dynamics than vacancy rates alone. Digging even deeper, you’ll find that logistics warehouses report an 8.4% vacancy rate, while specialized industrial manufacturing facilities are at just 4.2% [5].
Step 3: Evaluate Supply-Demand Dynamics and Market Competition
Assess Vacancy and Absorption Rates
Keeping an eye on vacancy and absorption rates is like reading the pulse of the market - they tell you where things stand and where they might be heading. By Q3 2025, national industrial vacancy hit 7.5%, the highest it’s been in a decade compared to the sub-4% lows of 2022 [5][10]. This marks a clear shift in leverage, moving from landlords to tenants, which in turn affects rent trends and leasing concessions.
To get the full picture, it’s crucial to look beyond just vacancy rates and include availability rates - which account for both sublease and actively marketed spaces. By late 2025, total availability climbed to 9.6%–9.7% [5][10]. This "shadow supply" further pressures rents, something vacancy data alone might not reveal. For example, sublease availability reached an all-time high of 1.1% of total inventory in mid-2025 [5], largely due to companies like Amazon scaling back after doubling their footprint during the pandemic.
The market softened considerably in Q2 2025, with net absorption turning negative - ranging from -12.6 to -20.5 million square feet. Median leasing times stretched from 3.5 to 5 months [5][10]. Rent growth slowed to just 1.4%–1.7% year-over-year, while concessions, averaging 2.8%–3% of total lease value, pushed effective rents even lower [4][10][11]. A clear example of this tenant-friendly market: in early 2025, a sauna equipment company secured six months of free rent on a 5.5-year lease for a 177,000-square-foot warehouse in the Inland Empire [10].
Meanwhile, new construction starts dropped to their lowest levels in a decade in early 2025. With a 4:1 ratio of new supply to net demand, the market is temporarily oversupplied, a condition expected to peak by late 2025 or early 2026 [5][10][4]. Knowing this timeline can help you pinpoint the right moment to negotiate favorable terms.
These metrics lay the groundwork for understanding how different property types are navigating these market shifts.
Compare Logistics-Specific vs. General Industrial Properties
The broader market dynamics tell part of the story, but property-specific performance reveals where opportunities lie. Logistics warehouses, like those massive fulfillment centers, are bearing the brunt of oversupply. Vacancy rates for these big-box facilities - typically over 100,000 square feet - hover around 8.4% [5][10]. Speculative construction has outpaced tenant demand, with markets like Phoenix seeing vacancy rates soar above 20% for mid-sized logistics buildings, following a surge of 19 million square feet of vacant space [5].
On the other hand, specialized industrial properties - often used for manufacturing - are much tighter, with vacancy rates between 3.9% and 4.2% [5][4]. These properties are usually built-to-suit rather than speculative, and they’re benefiting from reshoring initiatives supported by policies like the CHIPS Act. Manufacturing now makes up 20% of new industrial leasing, a jump from 13% pre-pandemic [7]. Flex industrial properties, which combine warehouse and office space, sit in the middle, with vacancy rates around 7.6%–8.1% [4][10]. These properties command higher rents, averaging $18.73–$18.74 per square foot, thanks to their office finishes and desirable infill locations [5][4].
| Metric | Logistics (Warehouse/Distribution) | Specialized (Manufacturing) | Flex Industrial |
|---|---|---|---|
| Vacancy Rate | ~8.4% [5][10] | ~3.9%–4.2% [5][4] | ~7.6%–8.1% [4][10] |
| Rent Growth Trend | Flat to slightly negative [5][10] | Positive/Steady [5][4] | 2%–3% YoY [4] |
| Supply Risk | High (speculative construction) [5] | Low (build-to-suit) [5] | Low (limited new starts) [4] |
| Average Rent | ~$11.00–$12.00/SF [5][10] | ~$11.89/SF [5] | ~$18.74/SF [4] |
Size also plays a key role. Small-bay industrial units - those under 50,000 square feet - remain in high demand, with vacancy rates below 4% [5]. Facilities under 10,000 square feet are commanding rents over $13.50 per square foot NNN [10], thanks to limited new construction and strong interest from local businesses. In contrast, big-box logistics properties face vacancies between 8% and 10% [5][4][10], creating a split market where averages can be misleading.
Modern facilities are increasingly preferred over older properties, especially those equipped for automation, AI, and better employee amenities. In 2024, buildings constructed before 2000 saw over 100 million square feet of negative absorption, while those completed after 2022 recorded over 200 million square feet of positive absorption [2]. CBRE Research highlights this trend:
"Demand for newly constructed space will drive up the vacancy rate of older buildings" [2]
This opens the door for value-add investors ready to modernize older properties. It also underscores the edge newer facilities have, even in an oversupplied market.
Step 4: Analyze Macro Trends and Risk Factors
Monitor Economic and Trade Trends
Take a step back and look at the bigger picture - economic and trade trends can reveal opportunities and risks in logistics real estate. Pay close attention to key indicators like interest rates and inflation. For instance, with the 10-year Treasury Yield staying above 4% in 2025[12], average cap rates for stabilized multi-tenant warehouse assets have risen to around 6%–7%, compared to about 4.5% at their peak in 2021[5].
Keep an eye on the Consumer Price Index (CPI) and Producer Price Index (PPI) to track rising costs that may affect operating expenses. With GDP growth projected at 2%–2.5% for 2025[12], demand for logistics space is expected to hold steady.
For industry-specific insights, tools like the Manufacturing Purchasing Managers' Index (PMI) and the Cass Freight Index are essential. A drop in the Cass Index, for example, could signal weakening demand for warehouse space. Similarly, shifts in import and export volumes at major seaports can provide early warnings about changing demand patterns.
Trade policy is another critical factor. While U.S. logistics demand is largely domestic - only about 15% is directly tied to global trade[7] - tariffs can still create ripple effects. For example, companies might rush to import goods before new tariffs take effect, causing temporary spikes in demand followed by slower periods. In 2025, tariff-driven inflation is expected to reduce industrial leasing activity by 5%–10%[13].
The growing trend of nearshoring and reshoring is also reshaping demand centers. Regions along key trade corridors like I-35 - covering cities such as Dallas, Kansas City, and San Antonio - are seeing an uptick in cross-border trade[2][13]. Manufacturing now accounts for 20% of new industrial leasing, up from 13% before the pandemic[7]. Additionally, specialized manufacturing facilities maintain lower vacancy rates (around 4.2%) compared to larger logistics properties, which hover at approximately 8.4%[5][7].
Richard Barkham, CBRE’s Global Chief Economist, offers this perspective:
"The U.S. economy has achieved a rare soft landing in the face of higher interest rates, and the outlook for growth in 2025 is increasingly optimistic."[12]
However, he also warns:
"Risks to this outlook include the large U.S. fiscal deficit, which adds to bond market volatility, and the fragility of the Chinese economy."[12]
These macroeconomic factors - ranging from fiscal deficits to trade policy uncertainties - can rapidly alter market conditions, making it essential to stay informed as you plan your investments. Beyond these, advancements in technology and sustainability are reshaping the way logistics assets perform.
Consider Sustainability and Technology Advancements
Technology and sustainability are redefining logistics real estate, adding another layer to the broader economic and trade trends. Automation and AI are driving demand for high-quality facilities, with tenants seeking properties equipped for advanced robotics to streamline order picking and inventory management[2][7]. Newly built properties - those completed after 2022 - saw over 200 million square feet of positive absorption in 2024, while older facilities experienced notable negative absorption[2].
Modern, automation-ready properties are maintaining occupancy levels, while outdated buildings struggle to compete. This creates opportunities for investors to retrofit older assets with cutting-edge features, as long as the costs align with potential rent increases.
Access to reliable power is another growing challenge. Delays of 12–24 months for power access are common[7]. As PwC and ULI highlight:
"Access to reliable power infrastructure has emerged as a significant gating factor in the development of new industrial product, contributing to both construction delays and constrained future supply."[7]
When evaluating sites, prioritize those with secured power availability or consider alternative solutions like on-demand energy agreements. Some developers are even exploring unconventional options, such as nuclear power[12].
Sustainability features are no longer optional for institutional tenants. Green building standards - like solar-ready roofs, LED lighting, EV charging stations, and LEED certifications - are increasingly expected[5]. The commercial use of solar panels was projected to grow by 13% in 2024[3], reflecting a broader push toward energy efficiency.
E-commerce continues to be a powerful driver of demand. As of Q1 2025, online sales made up about 16% of U.S. retail[5], with projections suggesting they could reach 25% by year-end[2] and potentially hit 30% by 2030[7]. Since e-commerce fulfillment requires roughly three times the logistics space of traditional retail[6], the need for modern, efficient facilities is set to grow.
Another shift is the move toward distributed logistics networks. Companies are moving away from massive regional warehouses in favor of hub-and-spoke models that enable same-day delivery[5]. This is driving demand for mid-sized facilities in secondary markets and smaller industrial properties - typically under 50,000 square feet - in urban infill locations. These smaller properties maintain vacancy rates below 4% and command rents of about $13 per square foot NNN[4].
sbb-itb-99d029f
Step 5: Perform Feasibility Analysis and Forecasting
Develop Demand Projections and Risk Assessments
Once you’ve identified market dynamics and potential risks, the next step is to evaluate the feasibility of your project to gauge its potential returns. This involves conducting a three-tiered feasibility analysis - preliminary, static, and detailed cash flow. These steps help you assess deal structures, site limitations, and overall financial performance [15].
Focus your analysis on five key components: Capital, Land, Zoning, Design, and Construction [16]. For logistics properties, pay particular attention to site-specific factors like topography, zoning regulations, and environmental restrictions. Zoning codes, for example, may impose limits on floor area ratios, building heights, or lot coverage, all of which can significantly affect your plans [16][17].
To refine your projections, use sensitivity analysis. For example, calculate how a 10% rise in construction costs or a 5% drop in rents would impact your internal rate of return (IRR) [15]. This is especially important given recent trends: by mid-2025, annual rent growth had slowed to just 1.6% - its weakest rate since 2012 [5]. Meanwhile, national vacancy rates climbed to 7.4% as of Q3 2025 [5], and free rent concessions on new leases reached nearly 3% of the total lease value [4].
Keep a close eye on the supply pipeline. Projections indicate that new building deliveries in the U.S. could shrink by over 35% in 2024 [6]. This slowdown might help stabilize vacancy rates, but sublease availability remains high, representing about 1.1% of the total inventory [5]. This "shadow supply" could continue to put pressure on rental rates. As Prologis Research highlights:
"For every dollar of U.S. gross domestic product, at least 20% more logistics space is needed than before the COVID-19 pandemic." [6]
This shift toward "just-in-case" inventory strategies underscores the strong long-term demand for logistics space, even as near-term challenges persist. Spot potential roadblocks early - such as zoning conflicts or delays in accessing utilities [7][14] - to avoid wasting resources on projects that may not pan out.
Use Advanced Tools for Data Analysis
To make your feasibility analysis more efficient, consider adopting advanced tools that simplify data tracking and scenario modeling. Relying solely on spreadsheets won’t cut it when you need to validate assumptions in real time or monitor how your pipeline evolves through different deal stages. For logistics investments, tools that integrate underwriting, competitive mapping, portfolio analysis, and stakeholder reporting are essential.
One such tool is CoreCast, an all-in-one platform tailored for these needs. CoreCast allows you to underwrite assets across various risk profiles, track your pipeline at every stage, and view both your properties and competitors on a single map. It also offers advanced portfolio analysis and a stakeholder center for creating branded reports.
This kind of platform is invaluable for comparing scenarios, staying updated on market trends, and adjusting your projections as needed. For instance, CoreCast provides real-time insights, which are especially useful when average cap rates for stabilized multi-tenant warehouse assets have risen to 6%–7%, compared to around 4.5% at their peak in 2021 [5][4].
It’s worth noting that while CoreCast integrates with property management systems, it isn’t designed for managing day-to-day operations or bookkeeping. Its primary focus is on delivering actionable investment intelligence to inform your decisions.
Industrial Real Estate Trends: Forces Reshaping Warehousing Today
Conclusion
Understanding logistics real estate markets requires a structured approach that blends overarching trends with specific local market details. Start by pinpointing major demand drivers like the surge in e-commerce, the rise of third-party logistics, and the shift toward supply chain reshoring. Then, layer in local elements such as access to infrastructure, demographic changes, and zoning restrictions. This combination helps you assess both broad and localized factors effectively.
"Companies will continue a flight to quality in 2025 to facilitate their use of automation and artificial intelligence and provide more employee amenities" [2]
Recent data highlights a clear divide in property performance. Buildings constructed after 2022 saw over 200 million sq. ft. of positive absorption in 2024, while older properties built before 2000 faced more than 100 million sq. ft. of negative absorption [2]. These distinctions underscore the importance of understanding submarket dynamics when linking property performance to investment strategies.
Precision is key in decision-making. Tracking the construction pipeline and using location intelligence can transform qualitative insights into measurable data points [18] [19]. Advanced analytics play a crucial role here, helping reduce risks and improve forecasting accuracy.
For a streamlined analysis, consider using an integrated real estate intelligence platform like CoreCast. Such tools are particularly useful when evaluating multiple submarkets or tracking shifts in supply-demand dynamics across logistics categories - from Last Touch facilities catering to urban populations to Gateway properties near key ports.
As the logistics real estate market stabilizes after years of pandemic-driven disruptions, adopting the strategies and tools outlined in this guide will help you uncover promising opportunities, manage risks effectively, and make decisions that align with the sustained demand for modern distribution spaces.
FAQs
What drives demand in the logistics real estate market?
The rise of e-commerce has significantly increased the demand for logistics real estate. Companies are focusing on faster, more direct fulfillment to consumers, which has made warehouse efficiency and proximity to major population centers a top priority. This shift has also spurred the growth of last-mile delivery facilities in rapidly expanding markets.
At the same time, businesses are emphasizing supply chain resiliency, opting for long-term leases to secure crucial spaces in strategic locations. As these trends evolve, areas near urban centers and key transportation networks are emerging as prime spots for investment.
How does location influence the performance of logistics facilities?
Location plays a pivotal role in the performance and success of logistics facilities. Being situated near major highways, ports, rail terminals, and airports can significantly cut transportation costs, speed up delivery times, and boost service reliability. These are critical factors for businesses striving to meet next-day or even same-day delivery demands. Additionally, staying close to both customers and suppliers helps reduce last-mile delays, which not only keeps customers happy but also trims operational expenses.
Beyond proximity, other elements like regional economic health, available labor, tax incentives, and zoning laws influence the long-term success of a logistics site. Strong infrastructure access is another key piece of the puzzle, ensuring supply chains remain adaptable as market needs shift.
For real estate professionals, tools like CoreCast simplify the process of evaluating locations. This comprehensive intelligence platform combines transportation data, demographic insights, and cost metrics into an interactive map. With it, users can analyze potential sites, compare options, and create polished reports, making it easier to make smart, data-backed decisions when investing in logistics facilities.
How does technology impact logistics real estate analysis?
Technology has reshaped the logistics real estate sector, turning it into a fast-paced, data-driven field. Today, advanced tools like analytics, AI-driven forecasting, and location intelligence are at the heart of this transformation. These tools help identify demand patterns, fine-tune site selection, and simplify decision-making processes. For investors, this means better risk assessments, more accurate asset pricing, and sharper leasing strategies.
Platforms like CoreCast take things a step further by bringing together market data, pipeline tracking, and portfolio analysis in one streamlined system. With features to underwrite various asset types, map out competitive landscapes, and produce professional-grade reports, users gain real-time insights and can automate time-consuming tasks. By weaving technology into logistics real estate, professionals can act faster and make smarter, more informed investment choices.