
Key Metrics for Marina Property Appraisals

Marina property appraisals are complex, requiring specialized methods to evaluate their value accurately. Unlike typical real estate, marinas combine unique physical features, diverse revenue streams, and operational intricacies. Here’s what you need to know:
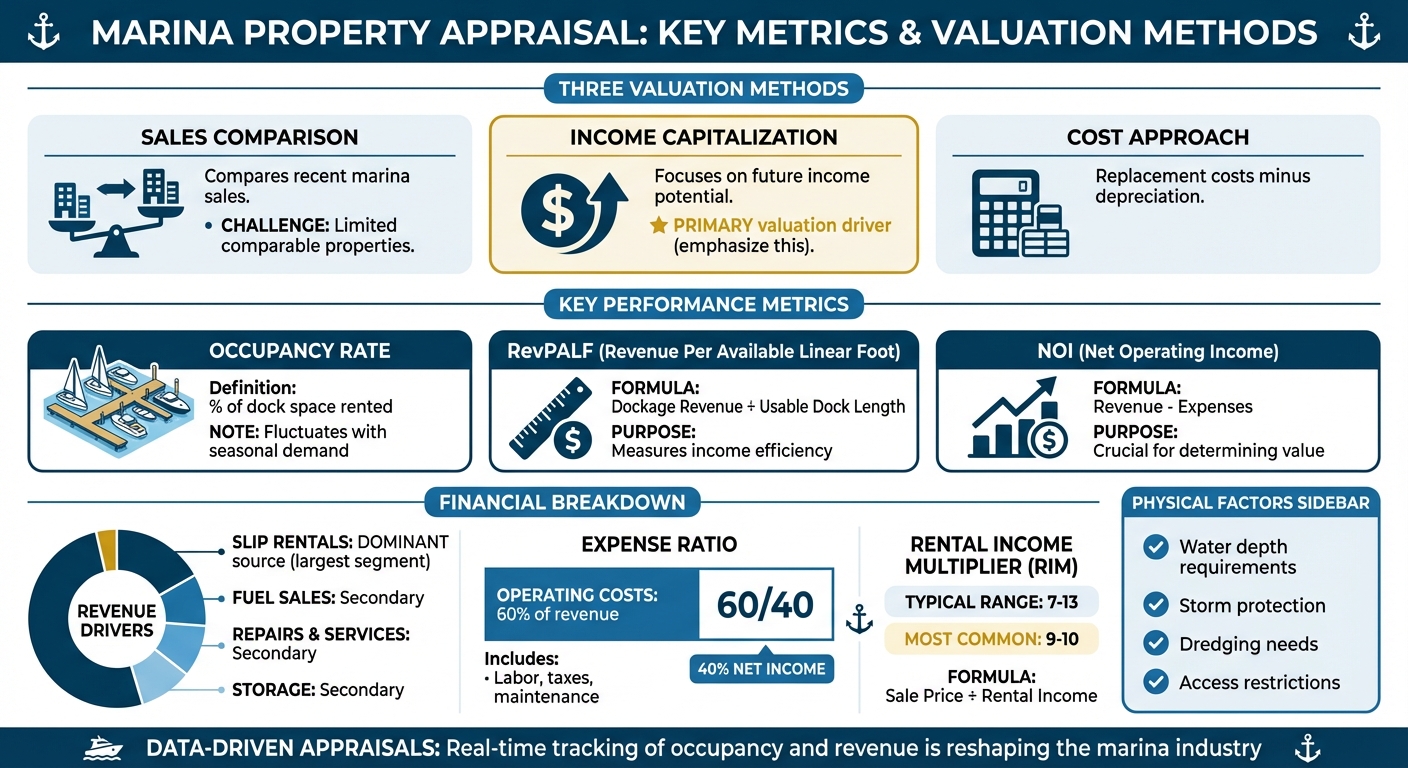
- Three Valuation Methods:
- Sales Comparison: Compares recent marina sales but faces challenges due to limited comparable properties.
- Income Capitalization: Focuses on future income potential, often the primary valuation driver.
- Cost Approach: Calculates replacement costs minus depreciation.
- Key Metrics:
- Occupancy Rates: Tracks dock space usage, fluctuating with seasonal demand and transient bookings.
- Revenue Per Available Linear Foot (RevPALF): Measures income efficiency by dividing dockage revenue by usable dock length.
- Net Operating Income (NOI): Revenue minus expenses, crucial for determining value.
- Revenue Drivers: Slip rentals dominate income, with additional earnings from fuel, repairs, and storage.
- Expense Considerations: Operating costs typically consume 60% of revenue, including labor, taxes, and maintenance.
- Physical Factors: Water depth, storm protection, dredging needs, and access restrictions influence marina value.
Investors increasingly demand data-driven appraisals using tools that track occupancy and revenue in real-time. Metrics like RevPALF and NOI help standardize valuations, while platforms like CoreCast simplify reporting and portfolio analysis. This shift toward detailed, digital records is reshaping the marina industry, especially as institutional buyers grow their presence.
Marina Valuation Methods and Key Performance Metrics Comparison
99% of Marina Buyers Don't Know How Value is Calculated
Occupancy Rates and Slip Utilization
Occupancy rate is the key metric for evaluating marina performance, representing the percentage of total dock space rented within a specific timeframe [8][6]. Unlike traditional real estate, where occupancy tends to remain steady, marina occupancy can vary daily due to factors such as seasonal demand, transient bookings, and long-term tenant patterns. Adrian Mott highlights its importance:
Occupancy rate is really the foundation of metrics for a marina. It helps you get beyond relying on observations about how full you are into data you can rely on [8].
Tracking occupancy daily helps identify slow periods and adjust operations accordingly [8][2]. This detailed tracking is increasingly critical as institutional investors expand their marina portfolios across multiple regions [4]. Occupancy also directly impacts Revenue per Available Linear Foot (RevPALF), a widely used measure of asset productivity. Institutional buyers rely on RevPALF to compare marinas across different locations and assess their financial performance [6][4].
A high occupancy rate compared to competitors often indicates pricing flexibility. For instance, a marina consistently operating at 100% occupancy while nearby marinas hover around 60% may signal an opportunity to increase rental rates [8]. On the other hand, low occupancy might require strategies like transient promotions or rate adjustments. However, there’s typically an inverse relationship between slip rental rates and occupancy - higher rates often lead to reduced occupancy unless demand remains inelastic [9].
Seasonal Patterns and Market Stabilization
Daily occupancy data is just the starting point. Seasonal trends add another layer of insight, refining valuations further. Seasonal fluctuations play a significant role in occupancy and must be accounted for when appraising marinas. Factors like storm protection, ice damage risk, and restricted access - such as low bridges or tidal limitations - directly influence a marina’s ability to operate year-round [1][9][7]. Appraisers assess "potential occupancy" by reviewing occupancy trends over at least three years leading up to the valuation date [7].
Amenities like fuel docks, repair facilities, restaurants, and laundry services can help marinas maintain occupancy during slower seasons [9][7]. Customer behavior also impacts occupancy - seasonal tenants may leave for extended cruises, or transient boaters might cancel due to bad weather [2]. To create stable valuations, appraisers compare a marina’s performance against a "comp set" of three to five similar properties, determining whether the current performance reflects a steady baseline or if there’s room for operational improvement [6][4].
Comparing Performance to Industry Standards
To gauge a marina’s competitive standing, appraisers benchmark its occupancy against industry norms. Mike Melillo, CEO of The Wanderlust Group, underscores the value of this approach:
The bottom line is: you have to know where you stand in order to see where you can grow [4].
Standardized reporting is a must for institutional investors, as it allows them to assess ROI consistently across their portfolios [6][4]. When building a comp set, appraisers focus on marinas with similar features - such as location, amenities, water depth, and slip size distribution - rather than simply looking at geographic proximity [6]. Breaking down rates by slip size tiers ensures more accurate comparisons, as uneven slip distributions can skew results [9].
This growing reliance on data has driven the adoption of advanced management platforms that automate occupancy tracking and provide real-time metrics. Appraisers now expect detailed daily, weekly, and monthly occupancy reports rather than relying solely on seasonal data [8][4].
Revenue Streams and Financial Performance
Revenue Per Slip and RevPALF
Revenue Per Available Linear Foot (RevPALF) is a key metric for evaluating how effectively a marina generates income from its dock space. It’s calculated by dividing total dockage revenue by the available linear feet of dock, taking into account that sellable space can sometimes exceed the physical dock length through configurations like med-mooring [4][6][8]. Adrian Mott highlights its significance:
Revenue per Available Linear Foot is a combination metric that enables you to assess your asset productivity over a given period of time. This is the key to unlocking your marina's potential revenue which is a major factor in benchmarking your value [6].
For appraisers and institutional investors, RevPALF provides a standardized benchmark to compare marinas, regardless of their size or location [4][6]. For example, a marina with full occupancy but a lower RevPALF than competitors might indicate untapped pricing potential. On the other hand, a high RevPALF paired with moderate occupancy could reflect strong pricing strategies. As institutional ownership expands, investors managing multi-state portfolios increasingly rely on RevPALF to evaluate return on investment consistently [4][6]. This metric plays a crucial role in understanding how rental revenues influence marina valuations.
Primary Revenue Sources
While RevPALF is an important performance indicator, the backbone of marina revenue lies in rental fees. These include slip, rack, and land storage rentals, which are the primary contributors to profitability. As Jeff Dugas, an appraisal expert at Leisure Appraisal, explains:
The most profitable form of income for a marina is slip, rack or land storage rental fees. Income from these sources fundamentally drives marina income [10].
Rental fees are attractive because they involve low overhead costs and deliver high margins. Revenue streams such as transient slip rentals, seasonal leases, and annual contracts form the core of most marina income statements [2][10]. Although additional services like fuel sales or retail can generate significant gross revenue, they rarely match the profitability of direct rentals.
When it comes to marina sales, Rental Income Multipliers (RIM) - calculated by dividing the sale price by actual rental income - typically fall between 7 and 13, with most transactions landing in the 9 to 10 range [10]. This highlights how heavily buyers prioritize rental revenue when assessing property value. While amenities can help a marina charge higher rates, the real value remains rooted in how well dock space is utilized [9][10].
Operating Expenses and Maintenance Costs
Expense Ratios and Major Cost Drivers
Net Operating Income (NOI) serves as the cornerstone for valuing marina properties. It's calculated by deducting all operating expenses from total revenue [11][13]. For appraisers, capturing every relevant expense is key to ensuring an accurate valuation.
MarinaAppraisal.com critiques income approaches that oversimplify expenses, stating:
Can the expenses of any business be completely shown in so few line items? It's not possible... You should see between one and three dozen expense line items [5].
Operating expenses generally fall into two categories. Controllable expenses include costs like payroll, marketing, administration, repairs, and management fees - areas where owners have some ability to adjust or optimize [15]. On the other hand, non-controllable expenses include property taxes, insurance, and utilities such as electricity and water, which are influenced by external market conditions [12][15]. Payroll often represents the largest controllable expense, and appraisals that underestimate labor needs risk producing valuations that don't reflect reality [5].
A realistic benchmark for operating expenses in basic marina operations is roughly 60% of revenue [16]. Keeping operating costs lower increases NOI, which in turn boosts property value when divided by the capitalization rate [15]. This detailed expense analysis is essential for understanding long-term maintenance and capital requirements.
Depreciation and Site Development Costs
After analyzing operating expenses, it’s important to consider depreciation and site development costs to assess future capital needs. Marina infrastructure is subject to unique maintenance challenges caused by environmental factors like storms, waves, wind, and ice [1]. Coastal marinas, in particular, face harsher saltwater conditions and stricter regulations compared to their inland counterparts [16][17].
Physical depreciation is typically calculated using the age-life method. For example, docks and pilings generally have a useful life of 30 years [16]. A dock installed five years ago would show 16.67% depreciation (5 years ÷ 30 years) [16][18]. However, functional obsolescence can speed up depreciation when infrastructure no longer meets market expectations. Examples include outdated 50-amp single electrical outlets when doubles are now standard, or docks sized for 30-foot boats when the market demands 35- to 40-foot capacity [16].
Accurate replacement cost estimates require local expertise. MarinaAppraisal.com notes:
You can't use a cost service to get an accurate estimate of dock replacement cost new... the sample size is way too low to be reliable [16][18].
Costs for bulkhead and dock replacement can vary significantly depending on local labor markets, with unionized areas typically incurring higher expenses [16]. Dredging costs, meanwhile, depend on factors like water depth, sediment quality, and proximity to environmentally sensitive areas such as wetlands or flood zones [1][3].
While depreciation is a non-cash expense that provides tax benefits, it is added back to maintain an objective view of a marina's financial performance [13][15]. Significant projects like replacing dock systems or undertaking large-scale dredging are classified as Capital Expenditures (CapEx) rather than operating expenses, ensuring NOI remains accurate and not artificially reduced [14][15].
sbb-itb-99d029f
Location and Market Demand Factors
Demographics and Demand Drivers
Marinas located near affluent neighborhoods tend to perform better financially. Why? They attract boaters with higher disposable incomes, ensuring steady demand for slips and services. This consistent demand leads to higher occupancy rates and stronger revenues [7].
Adding to this, limited supply plays a big role in boosting the value of marinas in prime locations. Getting planning permissions for new marinas in popular coastal areas is notoriously difficult [7]. As a result, existing marinas in these sought-after spots can charge premium rates. According to GOV.UK's Rating Manual:
The south coast still leads the way as the prime location for boating in terms of interest, numbers and facilities, and hence has the most expensive berthing charges [7].
Another factor driving demand is network connectivity. Marinas positioned within easy sailing distance of other popular harbors, scenic coastlines, or extensive river and canal systems tend to attract more boaters. This regional advantage allows these marinas to charge higher slip rates compared to those in more isolated areas [7].
Interestingly, institutional investors are now using standardized metrics like RevPALF (Revenue per Available Linear Foot) to compare marinas across regions, moving beyond just local market knowledge [4][6]. A 2021 survey revealed a growing trend: 40% of marina owners were considering selling, driven by increased interest from institutional buyers [4]. Mike Melillo, CEO of The Wanderlust Group, highlighted this shift:
Interest in buying a marina has reached an all-time high... we're entering into a new era of institutional capital [4].
While demographics are crucial, a marina's physical characteristics also play a big role in determining its operational efficiency and long-term costs.
Environmental and Physical Site Features
Water depth is a key factor in a marina’s success. To accommodate a wide range of vessels, marinas need to maintain a minimum depth of 4.9 to 6.6 feet (1.5 to 2 meters) at pontoons and channel entrances, regardless of tidal conditions [7]. Marinas that fail to meet this standard risk losing customers, especially as boat sizes continue to grow.
Shelter from environmental forces is another critical element. Marinas protected from storms, strong winds, and ice benefit from lower repair and insurance costs. On the flip side, exposed marinas face higher maintenance expenses and reduced occupancy during severe weather events [1][7][19].
Dredging requirements can significantly impact a marina’s profitability. Facilities that frequently need dredging to maintain navigable depths see higher operational costs, cutting into their bottom line. The frequency and cost of dredging depend on factors like siltation rates, sediment quality, and local environmental regulations [7].
Access restrictions also play a role in a marina's value. Properties that require navigating locks or tidal gates are less convenient for boaters, which leads to lower rates compared to marinas with direct, unrestricted access to open water [7]. Similarly, marinas with irregular basin shapes that reduce slip efficiency may struggle with operational challenges and diminished overall value [1][7].
Using Technology for Data-Driven Appraisals
Tracking Occupancy and Revenue Data
Gone are the days when marina appraisals relied on pen-and-paper methods. Institutional investors now demand standardized, verifiable data, and digital platforms have stepped in to meet these expectations. These tools automate the calculation of key metrics like Occupancy Rate, Average Daily Rate (ADR), and Revenue per Available Linear Foot (RevPALF) [4][2]. By removing guesswork, automation provides the reliable data needed for informed investment decisions. Beyond simplifying calculations, these platforms integrate seamlessly with broader valuation approaches.
Take CoreCast, for example. It consolidates transient, short-term, and long-term revenue data into a single, user-friendly dashboard. This real-time visibility allows marina owners to monitor performance across all slip categories, helping them identify which areas generate the most revenue and where improvements can be made. This shift to digital tracking is reshaping how marina appraisals are conducted.
Digital tools also enhance occupancy management. By identifying and filling vacant slips - such as when seasonal boaters are away - these platforms can even push occupancy rates beyond 100% [8]. Additionally, they support competitive benchmarking, enabling marina owners to compare their performance against a "comp set" of 3–5 similar marinas. This reveals pricing gaps and uncovers hidden revenue opportunities [4][20].
Experts recommend digitizing operations 1–3 years before planning to sell a marina. This allows owners to present potential buyers with verified, multi-year performance records instead of relying on incomplete historical data [4][20]. In fact, a survey of over 100 marina owners found that 40% to 45% were considering selling their properties, largely driven by the demand for such detailed documentation [4][20].
Pipeline and Portfolio Management
Real-time metrics are just the beginning. Comprehensive pipeline and portfolio management tools take appraisal accuracy to the next level. For investors managing multiple marinas across vast distances, platforms like CoreCast are indispensable. They allow users to track deals through every stage - from initial underwriting to final acquisition - and include mapping features to visualize how nearby marinas compare in pricing, occupancy, and amenities.
Portfolio analysis tools consolidate performance data across all properties, making it easier to spot underperforming assets or untapped markets. The platform's stakeholder center also simplifies reporting by enabling marina owners to create branded reports for investors, lenders, and partners - all without juggling multiple software systems. Mike Melillo, CEO of The Wanderlust Group, sums up the industry's evolution:
The marina industry of today is rapidly becoming more data-driven and those who learn this language will come out stronger [4].
While CoreCast integrates with property management systems to pull operational data, it focuses on strategic analysis rather than bookkeeping. It tracks forward-looking metrics like "Dockage Leads" and "Reservation Requests", which serve as indicators of future revenue [2]. This approach helps marina owners evaluate their marketing efforts and forecast cash flow with greater precision. As Jordan Ivey puts it:
Starting to collect and aggregate your bookings digitally will give you all the data you'll need to evaluate your property value [20].
Conclusion
Marina valuations have evolved to mirror the intricate nature of their operational performance. Today, marinas are assessed as active businesses, with metrics like Occupancy Rate, ADR (Average Daily Rate), and RevPALF (Revenue Per Available Linear Foot) taking center stage. This shift highlights the industry's growing focus on precision and efficiency in asset valuation.
A thorough appraisal now hinges on capturing every relevant operating expense. The rise of data-driven methodologies has become undeniable, with standardized metrics forming the backbone of modern appraisals to meet investor expectations. As Mike Melillo, CEO of The Wanderlust Group, aptly puts it:
We are at a watershed moment for the marina industry - one which will change the face of marina ownership and management for a generation to come [4].
Digital tools like CoreCast are revolutionizing the process by combining occupancy tracking, revenue analysis, and portfolio management into a single platform. These platforms automate complex calculations, facilitate competitive benchmarking, and generate standardized reports - meeting the needs of buyers and lenders alike. For marina owners considering a sale, starting the digitization process 1 to 3 years in advance can be a game-changer, ensuring they have verified performance data rather than incomplete historical records [20].
The benefits of adopting management software are clear. Marinas utilizing such tools have, on average, increased their property value by $800,000 through reduced operating expenses and improved Net Operating Income (NOI) [20]. By embracing data-driven metrics, marina owners and investors can unlock greater value and thrive in an increasingly competitive marketplace.
FAQs
How do occupancy rates impact the value of a marina property?
Occupancy rates are a key factor in assessing the value of a marina property. When more dock spaces are rented out, the effective gross income rises, directly boosting the marina's revenue. This increase in income significantly impacts the property’s valuation, particularly when applying the income-based approach.
On the flip side, lower occupancy levels mean fewer revenue streams, which can ultimately decrease the property’s value. Keeping occupancy rates high not only improves financial performance but also makes the marina more attractive in the market.
How is Revenue Per Available Linear Foot (RevPALF) used to evaluate marina performance?
Revenue Per Available Linear Foot (RevPALF) is a metric used to determine how much revenue a marina earns for every foot of dock space. This figure offers a clear picture of how efficiently the marina generates income, making it a useful indicator of financial performance.
Examining RevPALF allows owners and investors to pinpoint areas for improvement, whether that's adjusting pricing, increasing occupancy, or refining operational strategies. It's a crucial tool for understanding a marina's profitability and its potential for sustained growth.
Why is digital tracking crucial for marina property appraisals?
Digital tracking plays a key role in marina property appraisals by delivering precise, real-time data on critical metrics that influence a marina’s value. Metrics such as occupancy rates, revenue streams (like slip rentals, fuel sales, and on-site services), and operating expenses (including maintenance, utilities, and payroll) can change frequently. Digital systems capture these shifts instantly, giving appraisers a dependable and up-to-date basis for their evaluations.
For investors - particularly institutional buyers - digital tracking adds a layer of transparency by standardizing reports, making it easier to compare marinas and boosting confidence in valuation models. Tools like CoreCast streamline this process by centralizing all relevant data into one platform. This allows marina owners and appraisers to generate precise inputs and perform in-depth portfolio analyses, eliminating the need for cumbersome manual spreadsheets.