
Portfolio Performance: DSCR Benchmarking Best Practices

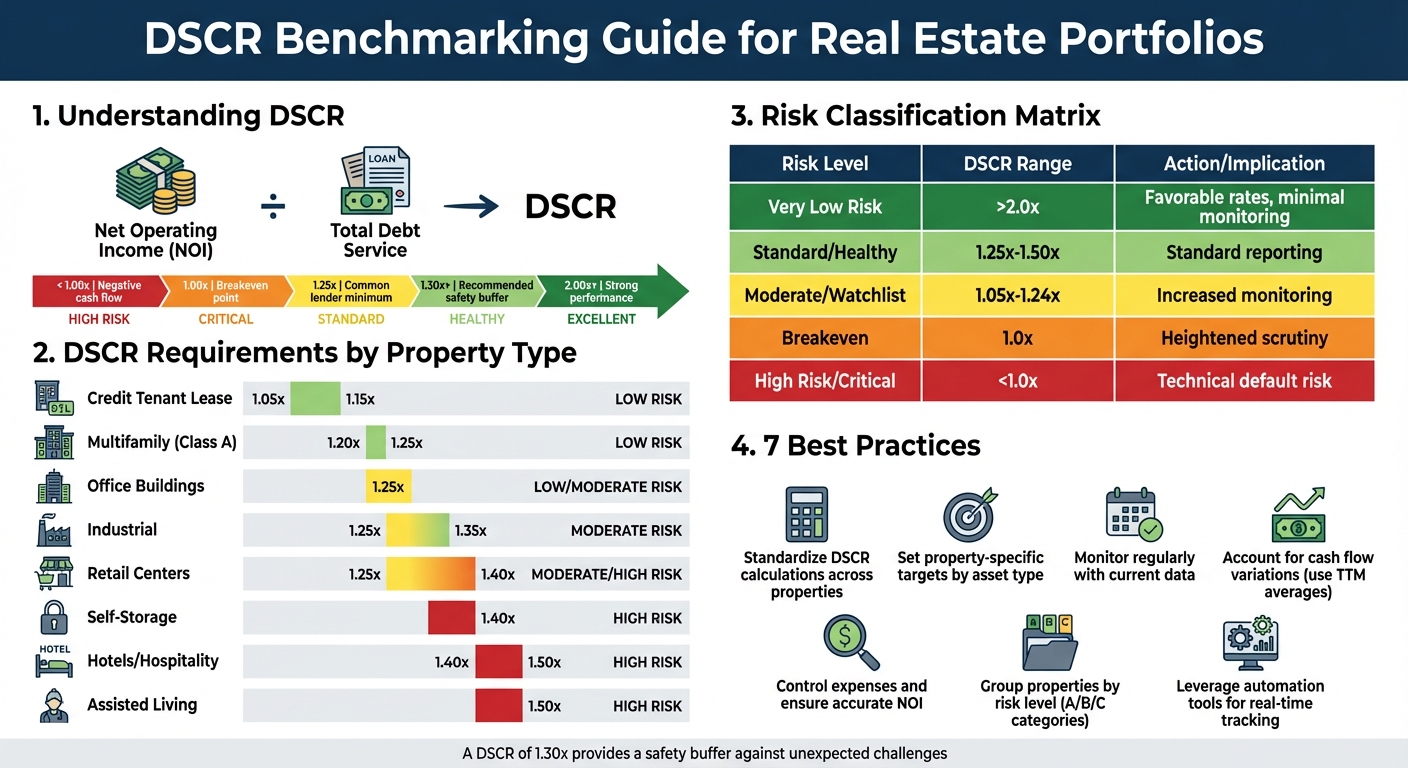
Debt Service Coverage Ratio (DSCR) is a critical metric in real estate for assessing a property's ability to cover its debt obligations. It’s calculated as Net Operating Income (NOI) ÷ Total Debt Service. A DSCR of 1.25x is a common minimum for lenders, meaning the property generates $1.25 in income for every $1.00 of debt payment. Ratios above 2.00x signal strong performance, while anything below 1.00x indicates negative cash flow and higher default risk.
To improve portfolio management, here are the key practices:
- Standardize DSCR Calculations: Use consistent NOI adjustments (e.g., vacancy rates, reserves) across properties.
- Set Property-Specific Targets: Adjust DSCR benchmarks for asset types (e.g., multifamily: 1.20x–1.25x; hotels: 1.40x+).
- Monitor Regularly: Track DSCR trends using current data to detect risks early.
- Account for Cash Flow Variations: Use trailing 12-month averages for seasonal properties.
- Control Expenses: Accurate NOI and expense management directly impact DSCR reliability.
- Group Properties by Risk: Classify properties by DSCR levels (e.g., low risk: 1.30x+; high risk: below 1.00x).
- Leverage Automation: Use portfolio software for real-time DSCR tracking and scenario modeling.
Quick Tip: A DSCR buffer of 1.30x or higher provides a safety net against unexpected challenges like rising vacancies or operating costs.
For lenders, properties with higher DSCRs often secure better financing terms, while underperforming assets face stricter scrutiny. Regular benchmarking and automation tools like CoreCast simplify tracking, enabling smarter decisions and improved financial outcomes.
DSCR Benchmarks by Property Type and Risk Level for Real Estate Portfolios
Debt Service Coverage Ratio (DSCR) Explained [Real Estate]
1. Use Consistent DSCR Calculations Across All Properties
When managing multiple properties, keeping your DSCR (Debt Service Coverage Ratio) calculations consistent is crucial for accurate portfolio analysis. The formula - DSCR = Net Operating Income (NOI) / Total Debt Service - stays the same, but how you calculate NOI can vary widely, leading to metrics that aren't directly comparable and potentially hiding critical warning signs[6][9].
To maintain consistency, rely on "Underwritten NOI" instead of raw operating income. This adjusted figure accounts for factors like a 5% vacancy rate, management fees, and replacement reserves. These adjustments align with what lenders typically include in their assessments, ensuring your internal calculations match industry standards[7][8]. For multifamily properties, replacement reserves are usually between $200 and $300 per unit annually, covering future capital expenses like roof or HVAC replacements[7].
To dig deeper, calculate Net Cash Flow (NCF) by subtracting capital expenditures (CapEx), leasing commissions (LC), and tenant improvements (TI) from NOI. Then, divide the result by total debt service. This NCF-based DSCR offers a clearer picture of the cash available after accounting for the costs needed to keep your property competitive[3].
It's also important to match your calculations to the loan structure. For Interest-Only loans, exclude amortization, and for adjustable-rate mortgages (ARMs), use either the initial rate or a stressed rate to factor in potential rate changes[8].
Different property types come with varying levels of risk, which influence their DSCR requirements. For example, multifamily properties typically need a minimum DSCR of 1.20x to 1.25x, reflecting their steady income streams. On the other hand, hotels and assisted living facilities often require a higher DSCR of 1.40x to 1.50x due to their operational complexity and revenue volatility[6]. A DSCR of 1.20x provides a safety margin, allowing NOI to drop by 16.7% while still covering all debt obligations[6].
2. Set Different DSCR Targets for Each Property Type
Not all properties carry the same level of risk, so it’s important to adjust DSCR targets accordingly. Managing a 100-unit multifamily building isn’t the same as running a hotel, and your benchmarks need to reflect those differences[10][12].
For properties with stable, diversified income streams - like Class A multifamily buildings or industrial properties - DSCR targets typically fall between 1.20x and 1.30x. These types of assets benefit from consistent housing demand and long-term leases, which help reduce volatility[10][12]. On the other hand, properties like hotels or self-storage facilities, where daily revenue can swing dramatically and operations are more complex, often require a DSCR of 1.40x or higher[10].
Tenant concentration also plays a big role in setting DSCR requirements. Office and retail properties often need a DSCR in the range of 1.30x to 1.40x because losing a key anchor tenant could severely impact your ability to cover debt payments[10][12]. Special-use properties - such as car washes or bowling alleys - are even riskier, with DSCR benchmarks typically ranging from 1.35x to 1.70x due to their limited resale appeal[12]. On the flip side, Credit Tenant Leases, which are backed by investment-grade companies, may qualify for significantly lower DSCRs, between 1.05x and 1.15x, thanks to the strong credit ratings that reduce perceived risk[10][12].
"The riskier a loan, the higher the DSCR a lender may demand to help mitigate this risk, with factors like volatile markets, low number of tenants, [and] special purpose facilities... contributing to this risk." - Trepp[11]
Market conditions also influence DSCR targets. For instance, during periods of rising interest rates or economic uncertainty, lenders often increase requirements by 0.10 points - so a typical 1.25x threshold for a multifamily property could shift to 1.35x[10]. For properties with seasonal income patterns, such as student housing or resorts, it’s smarter to evaluate performance using trailing twelve-month (TTM) averages rather than quarterly data. This approach helps avoid overreacting to predictable income dips during off-seasons[10]. Similarly, Class B properties in secondary markets might require higher DSCRs (around 1.30x) compared to Class A properties in primary markets (closer to 1.25x) to account for added risk perception[10].
Tailoring DSCR targets by property type and market dynamics allows for better risk management and more accurate performance tracking across your portfolio.
3. Factor in Cash Flow Fluctuations
When calculating DSCR, it's crucial to account for fluctuations in cash flow caused by seasonal trends, tenant turnover, and market cycles. These factors can create significant variability in a property's ability to cover debt service. Using a single month's data - especially during a seasonal high - can paint an overly optimistic picture that doesn’t accurately reflect the property’s performance over the course of a year[16].
For properties with high cash flow variability, relying on trailing twelve-month (TTM) averages is a smarter approach. Base DSCR calculations on collected rent to smooth out seasonal peaks and valleys, while also accounting for tenant turnover[16]. To further normalize income, factor in a vacancy and credit loss adjustment of 5%-10%[15].
Tenant turnover can take a toll on net operating income (NOI) through vacancy losses and bad debts. It also reduces net cash flow (NCF) due to added costs like leasing commissions and tenant improvements[3][4]. A key metric to monitor here is the Percentage of Uncollected Rent (POUR), which is calculated as:
(Vacancy Loss + Bad Debt Expense) ÷ Total Potential Rental Revenue
A well-managed property typically keeps its POUR at 5% or below. If this figure exceeds 11%, it may indicate problems with leasing or rent collection[4].
"An NOI that is artificially high will overstate the amount of income available to service the debt, while an NOI that is low due to a miscalculation will understate the amount of income that can be used to pay the mortgage." – Stessa[15]
To maintain a healthy financial cushion, aim for a DSCR buffer of around 1.30x - higher than the standard lender requirement of 1.20x to 1.25x. This ensures the ratio holds steady during unexpected challenges, such as increased vacancy rates or costly repairs[13]. Additionally, model downside scenarios, like a 10% vacancy spike or major capital expenses, to assess how the DSCR might perform under stress. Using NCF to account for irregular, one-time expenses provides a clearer picture of cash available for debt service[3][13]. These proactive adjustments not only improve the accuracy of DSCR calculations but also set the stage for categorizing properties by DSCR risk, which will be discussed in the next section.
4. Track DSCR Changes with Current Data
Keeping an eye on DSCR isn’t something you do just once during underwriting and then forget about. It’s an ongoing process. Regularly tracking DSCR with up-to-date data acts as an early warning system, alerting you to potential issues like rising vacancy rates or climbing operating costs before they create cash flow problems [13]. This consistent monitoring also lays the groundwork for the automated portfolio-wide analysis we'll touch on later.
As of December 31, 2024, Fannie Mae reported some revealing numbers: 6% of its multifamily guaranty book had a DSCR below 1.0. Meanwhile, properties acquired between 2017–2020 showed a weighted-average DSCR of 2.2, compared to 1.6 for those acquired in 2023 and 2024 [17]. These figures highlight how market conditions can significantly influence DSCR over time, depending on when the property was acquired.
"These statistics are extremely useful because they not only give live insight into loan and property performance but include the crucial reference point of the expectation established during underwriting."
– Vivek Denkanikotte, Trepp [3]
Comparing current DSCR with the benchmarks set during underwriting helps you see if properties are meeting their financial targets or falling short. This becomes particularly important when planning for refinancing. A declining DSCR can complicate refinancing efforts, potentially leading to higher interest rates, reduced options, or even "cash-in" requirements to stay compliant with loan terms [13].
The industry is quickly moving toward real-time DSCR monitoring. Investors are increasingly turning to integrated portfolio management platforms that link underwriting models with live performance data. These tools allow you to consolidate asset-level DSCR metrics into a portfolio-wide view, making it easier to spot systemic risks across different property types or regions [18]. For example, platforms like CoreCast provide automated DSCR tracking and data visualization, helping to identify trends early and take proactive steps.
5. Compare Your DSCR to Market Standards
Once you’ve nailed down consistent DSCR calculations and are actively tracking your data, the next step is to see how your numbers stack up against industry benchmarks. Why? Because understanding where you stand can help you evaluate risk and potentially secure better financing. For most commercial lenders and CMBS originators, the minimum DSCR typically falls between 1.20x and 1.25x - a cushion designed to handle market ups and downs [3][13]. These benchmarks act as a guide for gauging performance levels and asset-specific requirements.
Here’s a quick breakdown: a DSCR of 1.0x is the breakeven point - your income just covers your debt. Ratios above 1.30x signal strong performance, while anything under 1.0x raises red flags about cash flow issues [14][4]. For instance, as of December 31, 2024, Fannie Mae’s multifamily guaranty book showed a weighted-average DSCR of 2.0, though some properties still underperformed [17].
Different asset classes come with different DSCR expectations. Take Fannie Mae’s 2024 portfolio as an example: Seniors Housing averaged a DSCR of 1.5, while Manufactured Housing hit 2.2. Higher-risk assets like hotels and healthcare facilities often require DSCRs between 1.40x and 1.50x [17][3][6]. These variations underline the importance of setting tailored DSCR targets based on your asset type and risk profile.
If you’re looking for reliable benchmark data, you’ve got options. CMBS analytics providers like Trepp offer insights into loan-level DSCRs, tracking both securitized and current performance [3]. Government-sponsored enterprises such as Fannie Mae and Freddie Mac release quarterly supplements that detail portfolio-wide DSCR averages [17]. Additionally, public agencies like the DCHFA categorize properties by DSCR ranges in their performance rating scales [4].
Falling below market DSCR standards can lead to financing challenges - think higher interest rates or lower loan-to-value ratios [3][13]. On the other hand, properties with DSCRs above the 1.25x benchmark often enjoy better leverage and refinancing terms [13][19]. To stay ahead, aim for a DSCR cushion of 1.30x, even if your lender’s minimum is 1.20x. This extra buffer can shield you from sudden vacancies or unexpected cost increases [13].
6. Ensure Accurate NOI and Control Expenses
To maintain a reliable Debt Service Coverage Ratio (DSCR), it’s essential to ensure your Net Operating Income (NOI) reflects the actual performance of your property. Since DSCR is calculated as NOI divided by total debt service, any inaccuracies in your NOI can significantly distort the DSCR. For instance, what looks like a solid 1.30x DSCR could drop to 1.11x once lender-required expenses, such as replacement reserves and management fees, are factored in [6].
Inflating NOI by excluding owner-managed savings or skipping capital expenditure reserves can be misleading. Lenders typically adjust these figures to a standardized "Underwritten NOI", which accounts for a 5% management fee and annual reserves [6][8]. As Robert Schmidt, CCIM at PropertyMetrics, points out:
"In the event of foreclosure, a professional management team will need to be paid out of the project's NOI... the lender will likely not consider [owner-managed] savings in the DSCR calculation" [6].
This adjustment can have a big impact. Take, for example, a property with $1,000,000 in gross income and $221,800 in operating expenses. Its initial NOI is $778,200, resulting in a DSCR of 1.23x on $633,558 in annual debt service. However, adding a $50,000 management fee and $25,000 in reserves reduces the NOI to $703,200, dropping the DSCR to 1.11x [6]. This difference could determine whether you meet loan covenants or face a technical default.
Controlling expenses is another way to strengthen your DSCR. Gene Godick from G-Squared Partners explains:
"A 5% drop in operating expenses can improve DSCR just as much as a 5% rent increase - and expense reductions are usually faster and more predictable to implement" [10].
High-performing properties typically keep operating expenses at or below $500 per unit per month, while costs exceeding $700 per unit might raise red flags with lenders [4]. To manage expenses effectively, consider these strategies:
- Renegotiate service contracts annually.
- Invest in energy-efficient upgrades to cut utility costs.
- Monitor your Percentage of Uncollected Rent (POUR), aiming to keep it under 5% to safeguard income [4][20].
It’s worth noting that a DSCR of 1.20x means your NOI can drop by 16.7% before you’re unable to cover debt service [6]. This margin can shrink quickly if expenses aren’t carefully managed or if income projections are overly optimistic. To avoid pitfalls, rely on actual collected rent and standardize NOI calculations to reflect true performance [10][5]. Accurate NOI is the backbone of reliable DSCR benchmarking and effective portfolio management.
sbb-itb-99d029f
7. Build Future DSCR Scenarios from Past Performance
Leverage historical DSCR data to predict future performance by analyzing trends on a monthly or quarterly basis. This method transforms benchmarking from a static snapshot into a forward-looking tool, helping you anticipate potential challenges and opportunities [22][10].
Start by cleaning up your historical data. Take a close look at past operating expenses and remove any one-time costs that are unlikely to occur again. Including these in your projections could skew your expected NOI, leading to overly pessimistic forecasts [23]. For properties with seasonal income patterns - like student housing or resort rentals - rely on Trailing Twelve-Month (TTM) averages instead of quarterly snapshots. This approach provides a steadier, more accurate baseline [10][3].
Next, apply sensitivity modeling to create realistic scenarios. For properties with variable-rate debt, model potential impacts of interest rate increases, such as 50 to 100-basis-point hikes. Even a modest 50-basis-point rise can push a DSCR from 1.35x to 1.28x, which might trigger lender concerns [10]. Similarly, assess how reducing vacancies can improve your DSCR. For example, lowering vacancy rates from 8% to 4% in multifamily properties could boost the DSCR by approximately 0.12 points [10]. Sensitivity modeling allows you to simulate DSCR changes under varying market conditions.
Once you’ve built these projections, compare current DSCR trends against the original underwriting pro forma. This comparison helps you determine whether the property is meeting, exceeding, or falling short of its long-term financial goals [3]. Properties that exceed their underwritten DSCR by 1.10x are typically viewed as strong performers [4]. For a more conservative outlook, consider using Net Cash Flow (NCF) instead of NOI in your calculations. Unlike NOI, NCF accounts for capital expenditures, leasing commissions, and tenant improvements, offering a more comprehensive financial picture [3].
"DSCR looks at how a firm's operating income measures up against its annual debt payments... giving us a quick glimpse into the financial health of the property" [21].
When you extend this "glimpse" into the future, it becomes a powerful tool for identifying potential risks and opportunities based on past performance. By doing so, you can better prepare for what lies ahead.
8. Group Properties by DSCR Risk Level
To manage your portfolio effectively, consider grouping properties based on their DSCR (Debt Service Coverage Ratio) risk levels. This approach helps you prioritize resources and focus on properties that need the most attention.
Start by dividing properties into three risk categories:
- Category A (Low Risk): Properties with a DSCR of 1.30 or higher. These properties have strong cash flow and only need routine monitoring [4].
- Category B (Moderate Risk): Properties with DSCRs between 1.00 and 1.25. While they can cover their debt, they show signs of underperformance and require closer observation [4].
- Category C (High Risk): Properties with a DSCR below 1.00. These properties aren't generating enough income to meet debt obligations and are at a high risk of default [4].
To fine-tune this system, use a 1–5 rating scale. A score of 5 represents a DSCR of 1.30 or above, while a 1 reflects a DSCR below 0.99 [4].
"The higher the DSCR, the more comfortably the property's NOI can cover its debt service." – JPMorgan Chase [9]
This risk-based grouping allows you to focus your efforts strategically. Category C properties demand immediate action, such as financial audits, property inspections, and aggressive rent collection [4]. For Category B properties, increasing monitoring frequency - like switching from quarterly to monthly reviews - can help catch problems early [4]. Meanwhile, Category A properties can remain on standard reporting schedules, letting your team concentrate on higher-priority risks.
9. Combine DSCR with Other Coverage Ratios
Adding other coverage ratios to your DSCR (Debt Service Coverage Ratio) analysis can provide a more detailed picture of financial health. While DSCR is a key metric for evaluating a property's ability to handle debt payments, relying on it alone might leave certain financial risks unchecked. By pairing DSCR with additional ratios, you can develop a more well-rounded understanding of a property's financial stability.
Take the Interest Coverage Ratio (ICR), for instance. This metric is particularly relevant for interest-only loans because it focuses solely on interest payments. However, for amortizing loans, DSCR is generally the better choice, as ICR may paint an overly optimistic picture by ignoring principal payments [2][1]. In these cases, DSCR provides a more realistic measure of financial safety [1].
For properties with large fixed expenses - like lease payments, insurance, or property taxes - the Fixed Charge Coverage Ratio (FCCR) comes into play [1]. Unlike DSCR, FCCR accounts for these additional fixed costs, offering a more comprehensive view of whether cash flow can handle all financial obligations.
Another useful tool is the Net Cash Flow (NCF)-based DSCR, which subtracts capital expenditures, leasing commissions, and tenant improvements from Net Operating Income [3]. This approach takes a more conservative stance by factoring in these additional expenses, giving a clearer picture of long-term financial sustainability.
"The DSCR is a more conservative, broad calculation compared to the interest coverage ratio." – Investopedia [2]
In some cases, customized ratios can offer even more insights. For example, Global DSCR is particularly helpful for owner-operated properties or small business real estate. This ratio combines both business income and the owner's personal income and debt obligations [6]. By evaluating all cash flows, it provides a thorough assessment of financial capacity across properties with different ownership structures. This broader perspective is especially useful in portfolio management, helping investors make better-informed decisions.
10. Automate DSCR Tracking with Portfolio Software
Relying on spreadsheets to monitor DSCR (Debt Service Coverage Ratio) across multiple properties can bog down decision-making and open the door to costly errors. Matt LaHood, Head of Platform, Data & Analytics at Altus Group, puts it plainly:
"Managing large, unwieldy spreadsheets quarter after quarter introduces inefficiencies and a high risk of errors, making the need for more streamlined, automated benchmarking solutions clearer than ever" [25].
This outdated approach highlights the need for a faster, more accurate solution - automated portfolio software.
Why Automate DSCR Tracking?
Automated software takes the guesswork out of tracking key metrics like DSCR and NOI (Net Operating Income). Instead of juggling disconnected spreadsheets, portfolio managers gain access to centralized dashboards that provide real-time insights. This shift allows them to focus on analyzing performance - pinpointing underperforming properties or identifying what’s driving success - rather than double-checking formulas. By automating DSCR tracking, managers can make timely, data-driven decisions that align with the benchmarking practices discussed earlier.
One standout feature of automated tools is live performance tracking. These tools compare current DSCR against underwriting targets, quickly flagging discrepancies. For example, if a property was underwritten at a 1.35 DSCR but has dropped to 1.15, automated alerts can signal a need to review expenses or adjust rents. As James Harkness, Senior Director at Altus Group, explains:
"When firms know what's going on at the asset level, they can apply that understanding to evaluate their portfolio's performance in real time" [25].
Enhancing Decision-Making with Scenario Modeling
Beyond live tracking, automated software also supports scenario modeling, a game-changer for strategic planning. These tools allow managers to test variables like interest rates, holding periods, or equity contributions, instantly revealing how changes impact the portfolio as a whole. This shifts benchmarking from a reactive, quarterly task to a proactive strategy. For instance, Real Property Management uses its proprietary "Wealth Optimizer" system to manage over $16 billion in rental property assets, demonstrating the power of automation [24].
A Centralized Solution for Portfolio Management
For those seeking a comprehensive platform, CoreCast offers an all-in-one solution that integrates deal analysis, portfolio rollups, and stakeholder reporting. Spencer Vickers, CoreCast founder, highlights the common challenges his software addresses:
"Data is scattered across applications, underwriting models don't connect to real performance, and pipeline tracking is more guesswork than strategy" [18].
Comparison Tables
The following tables outline DSCR benchmarks by property type and risk tier, offering a clear framework for resource allocation and risk communication with lenders. These benchmarks align with the strategies discussed earlier, providing a practical reference.
For example, multifamily properties typically require a DSCR of 1.20x–1.25x due to their stable income streams from diverse tenants. On the other hand, hotels demand a DSCR of 1.40x or higher because of their daily revenue fluctuations and seasonal income patterns. Nathan Jennison, Founder & Owner at The Mortgage Architects, explains:
"A DSCR of at least 1.25 is generally considered ideal for real estate investments, indicating sufficient income to cover debts and a margin for unexpected expenses" [21].
| Property Type | Typical Minimum DSCR | Risk Level | Rationale |
|---|---|---|---|
| Multifamily (Class A) | 1.20x–1.25x | Low | Stable, granular income streams |
| Office Buildings | 1.25x | Low/Moderate | Long-term leases provide predictability |
| Industrial | 1.25x–1.35x | Moderate | Generally stable but tied to economic cycles |
| Retail Centers | 1.25x–1.40x | Moderate/High | Income variability from consumer spending |
| Self-Storage | 1.40x | High | High turnover and revenue fluctuations |
| Hotels/Hospitality | 1.40x–1.50x | High | High sensitivity to seasonality and economic shifts |
| Assisted Living | 1.50x | High | Operational and regulatory complexities |
| Credit Tenant Lease | 1.05x–1.15x | Low | Backed by investment-grade tenant creditworthiness |
Most commercial banks set a minimum DSCR requirement of 1.25x, although ratios closer to 2x are often preferred for added financial security [26].
| DSCR Risk Tier | Ratio Range | Risk Description | Lender Response |
|---|---|---|---|
| Very Low Risk | > 2.0x | Exceptionally strong cash flow with a large cushion | Favorable interest rates and minimal monitoring |
| Standard/Healthy | 1.25x–1.50x | Adequate coverage with a 25%+ buffer over debt obligations | Standard reporting and annual reviews |
| Moderate/Watchlist | 1.05x–1.24x | Narrow margin; minor income drops could impact debt service | Increased monitoring and potential principal paydowns |
| Breakeven | 1.0x | No excess income for the owner; zero cushion for vacancies | Heightened scrutiny and possible restructuring |
| High Risk/Critical | < 1.0x | Negative cash flow; property cannot meet debt obligations | Technical default; requires immediate mitigation |
These classifications help you quickly identify properties that are stable, under observation, or in need of immediate intervention. For instance, assets in the Watchlist category (1.05x–1.24x) require close monitoring since even a single vacancy or unexpected maintenance cost could lead to financial strain. By organizing assets this way, you can focus on operational adjustments or capital injections before lenders raise concerns about covenant breaches.
When combined with real-time tracking tools like CoreCast, these benchmarks become even more actionable. Platforms like CoreCast offer comprehensive real estate intelligence, enabling seamless monitoring and smarter decisions across your portfolio. Incorporating these benchmarks into your portfolio analysis ensures a proactive approach to managing risk and enhancing performance.
Conclusion
Managing DSCR benchmarking effectively is a continuous process that separates strong portfolios from those at risk of default. By standardizing calculations, setting risk-adjusted goals, and using up-to-date data to track performance, you can establish a system that spots potential issues early and supports informed refinancing decisions [14].
In addition to regular monitoring, periodic reassessments are essential to account for changing conditions. Best practices - like factoring in cash flow variations and categorizing properties by risk - help provide a comprehensive view of portfolio health. Tracking DSCR trends over time is crucial; a property underwritten at 1.30× a few years ago might now show a lower DSCR due to deferred maintenance or shifts in the market [14].
For commercial loans, lenders often look for a DSCR between 1.2× and 1.4×, with 1.25× being a common benchmark for CMBS loans [3][14]. However, simply meeting these thresholds isn’t enough. Ongoing monitoring can reveal when DSCR dips below underwriting expectations, highlighting potential covenant risks [3].
To move beyond the limitations of manual processes, consider using portfolio management platforms. Spreadsheets can restrict effective oversight, while tools like CoreCast consolidate asset-level data into a single, streamlined view [18]. With features like integrated underwriting and real-time tracking, these platforms allow you to compare current performance against initial projections across various asset types and risk levels - all in one place [18].
This proactive strategy combines rigorous benchmarking with strategic risk management, turning DSCR from a static metric into a dynamic decision-making tool. It provides clarity on properties requiring operational improvements, those ready for refinancing, and areas where capital can deliver the most impact. By leveraging automation and live data, DSCR benchmarking becomes a powerful tool for smarter, more informed investments.
FAQs
What should I consider when setting DSCR targets for different types of properties?
When determining Debt Service Coverage Ratio (DSCR) targets, it’s crucial to align benchmarks with the specific risks and cash-flow dynamics of each property type. While a DSCR of 1.25× is commonly used for most commercial properties, riskier assets like hotels or short-term rentals may demand higher ratios - sometimes reaching 2.0× or more. On the other hand, more stable property types with predictable income streams might justify lower ratios.
Some key considerations include:
- Tenant quality and lease structure: Properties with long-term, triple-net leases tend to offer steady income, unlike those relying on short-term or percentage-based rent agreements.
- Predictability of operating expenses: For properties like industrial warehouses, where operating costs are relatively stable, lower DSCRs can often be supported.
- Market and location risk: Properties in high-demand markets may justify lower DSCRs, while those in slower markets typically require a higher cushion.
- Loan terms and interest rates: Rising interest rates directly impact debt service costs, often necessitating a higher DSCR to ensure financial stability.
Leveraging tools like CoreCast can make this process more efficient. By standardizing data, applying property-specific adjustments, and offering real-time DSCR benchmarks, platforms like this ensure assets are evaluated against appropriate, risk-adjusted targets.
How does automation enhance DSCR tracking and portfolio management?
Automation simplifies DSCR tracking by standardizing how data is collected, minimizing human errors, and delivering instant calculations. Tools like CoreCast make it easy to create real-time reports, keep a close eye on portfolio performance, and make faster, informed decisions. The result? Greater accuracy, significant time savings, and more opportunities to concentrate on strategic planning and scaling your business.
Why should trailing twelve-month averages be used for properties with seasonal income fluctuations?
Using trailing twelve-month (TTM) averages is a smart way to evaluate properties with seasonal income patterns. Why? Because it gives a clearer, more stable picture of financial performance by looking at a full year of income and expenses. This method smooths out the highs and lows caused by seasonal fluctuations, offering a more reliable view of a property’s earning potential.
For real estate professionals, this means making decisions based on data that truly reflects the property’s performance, rather than being swayed by short-term trends. It’s especially useful for benchmarks like the DSCR (Debt Service Coverage Ratio), which depends on consistent and accurate data for meaningful analysis.