
Multifamily Market Trends: Policy Impacts in 2025
The multifamily housing market in 2025 underwent major shifts due to new federal, state, and local policies aimed at addressing the housing crisis. Key changes included increased funding for affordable housing, relaxed zoning rules, and expanded tenant protections. These policies reshaped investment strategies and development priorities while creating new challenges for landlords and developers.
Key Highlights:
- Federal Policy Changes:
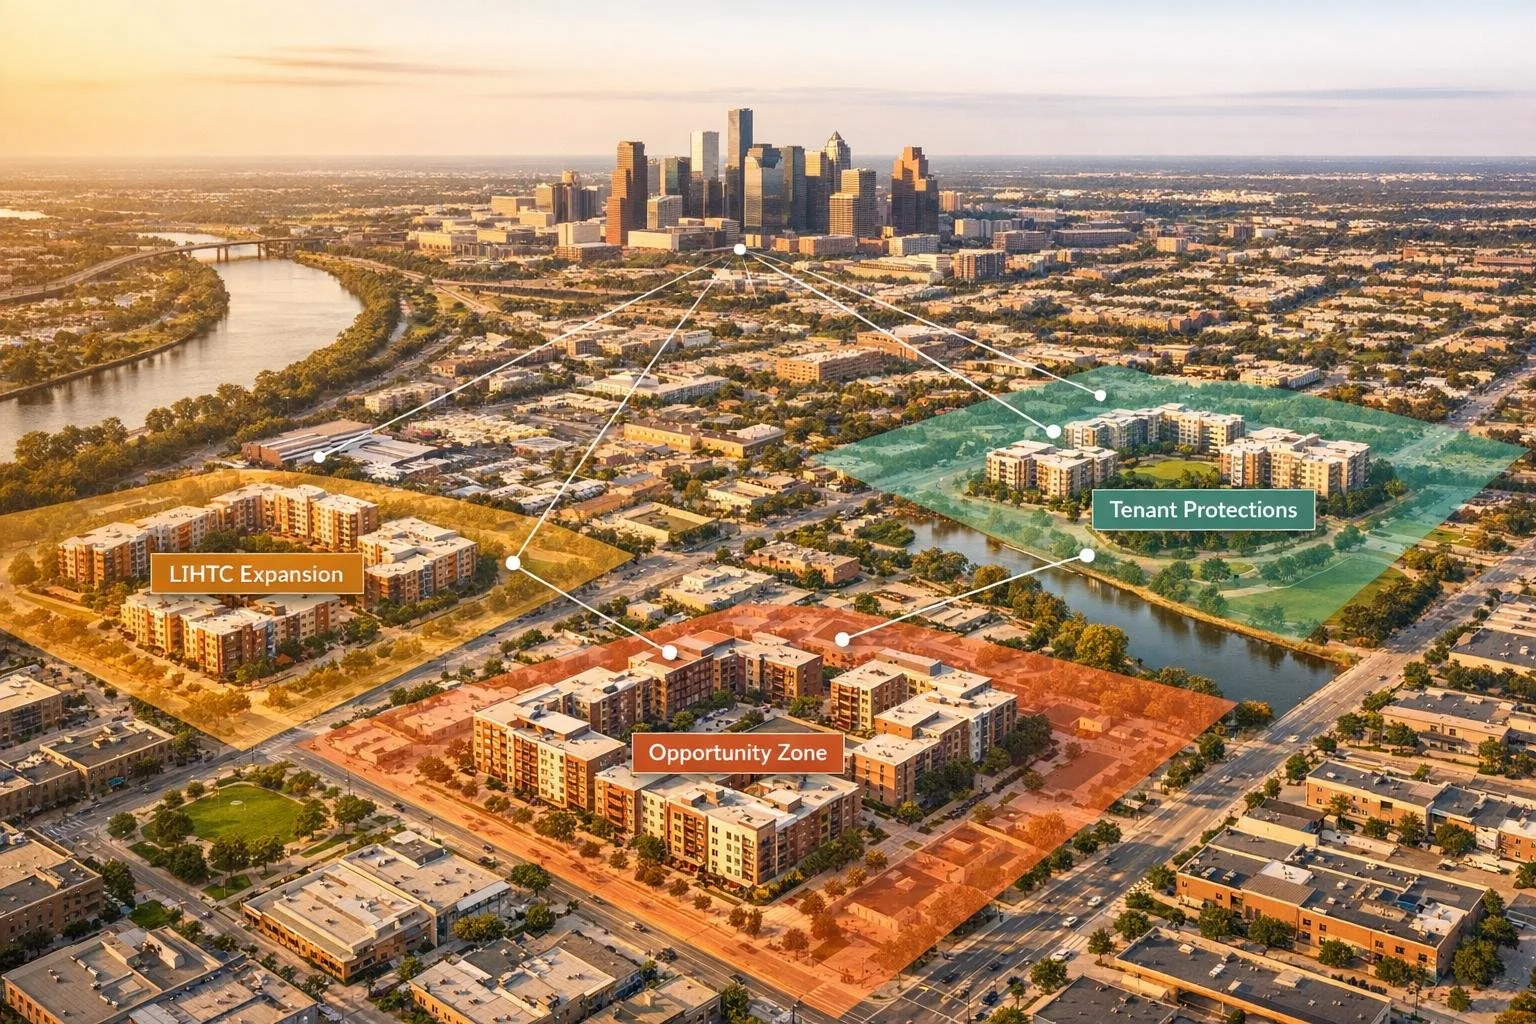
- ROAD to Housing Act: Removed limits on the Rental Assistance Demonstration (RAD) program and extended Opportunity Zones starting July 2026.
- One Big Beautiful Bill Act (OBBBA): Boosted Low-Income Housing Tax Credits (LIHTC) by 12% and reduced bond financing thresholds, enabling 1.22 million affordable homes by 2035.
- Tenant protections: Mandatory 30-day rent increase notices and 5-day late payment grace periods for federally backed properties.
- State and Local Reforms:
- New zoning laws allowed taller buildings near transit hubs and eased restrictions for adaptive reuse of commercial properties.
- California’s SB 79 permitted nine-story apartments near transit, while other states streamlined permitting and reduced parking mandates.
- Market Trends:
- Rent growth rebounded to 2.6% after a decline in 2024.
- Vacancy rates fluctuated between 4.9% and 6.7%, with Sun Belt cities facing oversupply and Midwest/Northeast markets experiencing stronger demand.
- Construction starts dropped 11%, reflecting tighter financing and regulatory hurdles.
These policy changes introduced new opportunities for affordable housing development but also increased regulatory complexity for investors and operators. Developers are focusing on markets with favorable policies and leveraging tools to navigate compliance and maximize returns. This often involves using data-driven strategies to track real estate portfolio performance across diverse markets.
Multifamily Market Trends in 2025
Monitoring these shifts requires real-time dashboards for CRE portfolio management to track how policy changes influence asset performance.
sbb-itb-99d029f
Federal Policy Effects on Multifamily Development
The One Big Beautiful Bill Act (OBBBA), signed into law on July 4, 2025, introduced the most sweeping federal housing incentives in over 20 years[7][8]. This legislation reshaped how developers finance affordable multifamily projects, with two key provisions standing out: a permanent 12% increase in annual 9% Low-Income Housing Tax Credit (LIHTC) allocations starting January 1, 2026, and a reduction in the Private Activity Bond (PAB) threshold from 50% to 25% for projects placed in service after December 31, 2025[6][7]. These changes are expected to fund about 1.22 million additional affordable rental homes between 2026 and 2035, while supporting 1.83 million jobs and generating $206.6 billion in wages and business income over the same period[6][8].
Beyond new construction, the Federal Housing Finance Agency (FHFA) doubled the LIHTC equity investment capacity for Fannie Mae and Freddie Mac to $2 billion each per year ($4 billion total) in July 2025, with half of that total earmarked for harder-to-serve markets. Meanwhile, HUD enacted a mandatory waiver of the "Qualified Contract" provision for projects seeking FHA Multifamily Rental or Risk Share insurance, ensuring a minimum 30-year affordability period for new developments[3][8]. LIHTC projects have played a growing role in multifamily financing, accounting for over 27% of all FHA-financed multifamily projects since 2020 and nearly 43% by fiscal year 2024[3]. These measures, coupled with adjustments to tax credits and bond thresholds, set the stage for the in-depth reforms discussed below.
Low-Income Housing Tax Credit (LIHTC) Expansion
The expanded LIHTC provisions introduced through OBBBA provide developers with new financial opportunities. One of the most impactful changes is the reduction of the bond financing threshold from 50% to 25%, a shift that is expected to fund 468,400 additional affordable rental homes over the next decade[5]. This change is especially transformative in bond-constrained states like California, New York, and Texas, where projects previously stalled due to funding caps are now moving forward. Additionally, the federal per-capita multiplier for calculating state credit ceilings increased to $3.05 for 2026, up from $3.00 in 2025, further boosting financing capacity in these markets[6].
Targeted incentives like the 30% basis boost for rural properties and tribal communities are channeling resources into underserved areas[5]. In response, Arizona doubled its annual state LIHTC award limits from $4 million to $8 million, with plans to extend these increases through 2031[6]. Lanie Beck, Senior Director at Northmarq, emphasized the importance of adapting to these changes:
success in this new era will depend not just on understanding the policy, but on leveraging local relationships, structuring creatively and securing soft funding[8].
Developers should revisit projects that were previously unworkable under the old 50% bond test and collaborate with State Housing Finance Agencies, many of which are updating their 2026 Qualified Allocation Plans to reflect the 12% credit increase[6][7]. Additionally, Opportunity Zone extensions are expanding federal incentives, as outlined below.
Opportunity Zone Extensions
The OBBBA made the Qualified Opportunity Zone (QOZ) program permanent, eliminating its original December 31, 2026, sunset date[10][11]. The extension introduced a rolling five-year deferral period for capital gains invested after 2026, replacing the fixed 2026 tax payment deadline with a timeline tied to the specific investment date[10][11]. By early 2025, Qualified Opportunity Funds had raised over $40 billion, financing nearly 200,000 housing units, most of which were multifamily projects[9]. Interestingly, individual investors make up 84% of participants, rather than institutions[9].
One example of this program’s success is "Jasper", a 296-unit luxury multifamily complex in a West Adams Opportunity Zone, completed by Los Angeles-based developer Cityview in early 2025. Built on the site of a former bookbinding factory, the project attracted high-net-worth individuals and family offices. Damian Gancman, Cityview’s CFO, shared the company’s vision for the future:
it is proven to be successful in ways that other policies haven't in very tangible ways[9].
Rural Opportunity Zones are also seeing new benefits, including a reduced 50% substantial improvement threshold, compared to the standard 100% for urban zones. This adjustment makes rehabilitating existing multifamily properties much more financially viable[10][8]. The next round of Opportunity Zone designations is set to begin in July 2026, with new zones taking effect on January 1, 2027[10][11].
State and Local Policies Affecting Multifamily Markets
In 2025, state legislatures across the U.S. passed over 100 pro-housing laws, a dramatic increase from an average of 48 per year in 2023–2024 and just one annually between 2011 and 2016[14]. These laws are reshaping the multifamily housing market by loosening restrictive local policies, streamlining permitting processes, and enabling the conversion of underutilized commercial properties into residential spaces. The growing trend of state governments overriding local zoning restrictions marks a significant shift in housing policy. For instance, states like Texas, Montana, and Maine now require cities to allow multifamily developments in commercial zones and near transit hubs, even in the face of local opposition[14].
A key example of this shift came in October 2025, when California Governor Gavin Newsom signed Senate Bill 79. This legislation permits developers to construct up to nine-story apartment buildings within half a mile of major transit stops in eight urban counties, bypassing local zoning laws[12]. Senator Scott Wiener highlighted the importance of this bill, stating:
SB 79 unwinds decades of overly restrictive policies that have driven housing costs to astronomical levels, forcing millions of people away from jobs and transit[12].
Matthew Lewis of California YIMBY called it:
The most transformative housing legislation that's ever been signed into law by any governor[12].
The ripple effects of SB 79 are already being felt, with states like Washington, Oregon, and Colorado considering similar policies focusing on transit-oriented development.
Zoning and Permitting Reforms
States have also tackled zoning and permitting hurdles to speed up development. Eliminating parking mandates in cities such as Denver, Austin, New York, and Dallas has slashed construction costs by $30,000 to $60,000 per unit. In Austin, these changes contributed to a 20% drop in rents relative to median incomes over three years[14].
Efforts to streamline permitting processes have also gained momentum. Arizona, for example, passed legislation in 2025 requiring cities to provide preapproved building designs and allowing third-party reviewers to issue building permits, reducing reliance on overburdened municipal offices[14]. Texas and Tennessee have adopted similar measures to address local permitting delays[14]. California's AB 818, implemented in January 2025, mandates that local agencies approve or deny permit applications for rebuilding homes after emergencies within 10 days - a policy inspired by the Los Angeles fires and now applied more broadly to cut delays[13].
Modernizing building codes has been another focus. States like Montana, Texas, Colorado, and Maryland now permit single-staircase designs for buildings up to six stories, a shift from the traditional two-staircase requirement for structures over three stories. This change increases usable space and allows for more flexible designs on smaller lots[14].
By-Right Development and Adaptive Reuse Policies
By-right development policies are further simplifying project approvals and encouraging innovative housing solutions. California's AB 507, for example, allows adaptive reuse projects that meet specific standards to receive administrative approvals and tax incentives for converting office spaces into housing[13].
In Florida, the 2023 Live Local Act has already led to the construction of over 20,000 apartments in commercially zoned areas of Miami by 2025[14]. This legislation, sponsored by State Senator Alexis Calatayud, requires cities to permit multifamily developments if a portion of the units is designated as affordable[14]. Texas has also introduced policies to promote affordability, such as allowing the subdivision of land parcels into lots as small as 3,000 square feet. In Houston, these reforms have resulted in the construction of at least 40,000 additional homes, priced 37% lower than traditional single-family homes[14].
California has also addressed environmental review bottlenecks with AB 130, which exempts infill housing projects on sites up to 20 acres from the California Environmental Quality Act. This is a significant expansion of the previous five-acre limit and is expected to speed up approvals for thousands of new housing units while reducing litigation risks for developers[13].
J.H. Cullum Clark, Director of the Bush Institute-SMU Economic Growth Initiative, captured the broader impact of these reforms:
Bad local policies constitute the largest obstacle to new housing supply in most parts of the United States, so it's good news that cities are leading the charge for pro-housing reforms[14].
Regulatory Challenges: Rent Control and Tenant Protections
New regulatory measures are shaking up the economics of multifamily investments, forcing investors to rethink how they approach asset performance. Rent control and tenant protection policies are playing a significant role in complicating returns, especially for owners of older, rent-stabilized properties. These policies, which are expanding in many major metro areas in 2025, are reshaping the landscape for multifamily investments.
Effects on Rent Growth and Cap Rates
Take New York City as an example: cap rates for rent-stabilized properties have jumped from roughly 3% before 2019 to over 9% in 2025. Meanwhile, delinquency rates for these properties have climbed to 10.8% as of late 2025, compared to just 0.7% for market-rate properties [15]. This disparity highlights growing investor concerns about regulatory risks and reduced profitability.
The gap between regulated and market-rate properties is becoming more pronounced across the country. Since 2019, market-rate property values have grown by 1.75% annually, reaching a median of $438,000 per unit. In contrast, stabilized units saw only a 0.27% annual increase, with a median value of $356,000 per unit [15]. Nationwide, multifamily delinquency rates hit over 7% in late 2025, the highest in nearly a decade, largely driven by older rent-regulated properties that can’t raise rents enough to keep up with rising costs [15].
States and cities are also tightening rent control regulations. For instance, Washington state introduced RCW 59.18.700 in May 2025, capping annual rent increases at the lower of 7% plus the Consumer Price Index or 10%. The law also prohibits rent hikes during the first year of a lease and requires a 90-day notice for any increase [16]. Similarly, Passaic, New Jersey, amended its rent stabilization ordinance in September 2025, reducing allowable annual rent increases from 6% to 3% and eliminating vacancy decontrol for buildings constructed before 1996. This prevents landlords from resetting rents to market rates when tenants move out [16].
Other cities are feeling the impact too. In St. Paul, Minnesota, property values for rent-controlled units dropped between 7% and 13% after rent control was introduced in 2021 [17]. Critics, like the National Apartment Association, argue that such policies can backfire. Ravi Ehrbeck-Malhotra and Ben Harrold have stated:
Decades of empirical research show [rent control] does more harm than good, worsening supply, affordability, mobility, equity and overall economic health [16].
Rising Operational Costs
Tenant protection laws are also driving up compliance costs while squeezing net operating income. For example, source-of-income and eviction laws are estimated to add $1,104 and $1,224 annually, respectively, to rents as operators pass along these higher costs [18]. Just-cause eviction laws and right-to-counsel requirements have further increased legal expenses and prolonged eviction timelines.
Federal regulations are adding to the burden. As of February 28, 2025, new tenant protections from the FHFA require 30-day notices for rent increases and lease expirations, along with a 5-day grace period for late payments on properties with GSE-backed mortgages [1]. While these measures aim to protect tenants, they create additional administrative challenges for landlords already grappling with rising insurance, utility, and labor costs.
The strain is evident in maintenance quality, especially in regulated units. In New York City, 64% of rent-controlled units reported maintenance issues, compared to 47% of unregulated units. This disparity reflects how limited revenue streams in regulated properties are cutting into maintenance budgets [17].
As these policies continue to evolve, their effects are being felt across the board - from analyzing new deals to day-to-day operations. The multifamily market is increasingly divided, with investors leaning toward market-rate properties and accepting lower returns to avoid regulatory headaches. This growing split between regulated and unregulated assets is shaping the multifamily investment landscape in 2025.
Market Data and Forecasts for Multifamily Trends in 2025
Multifamily Market Trends 2024-2026: Policy Impact Comparison
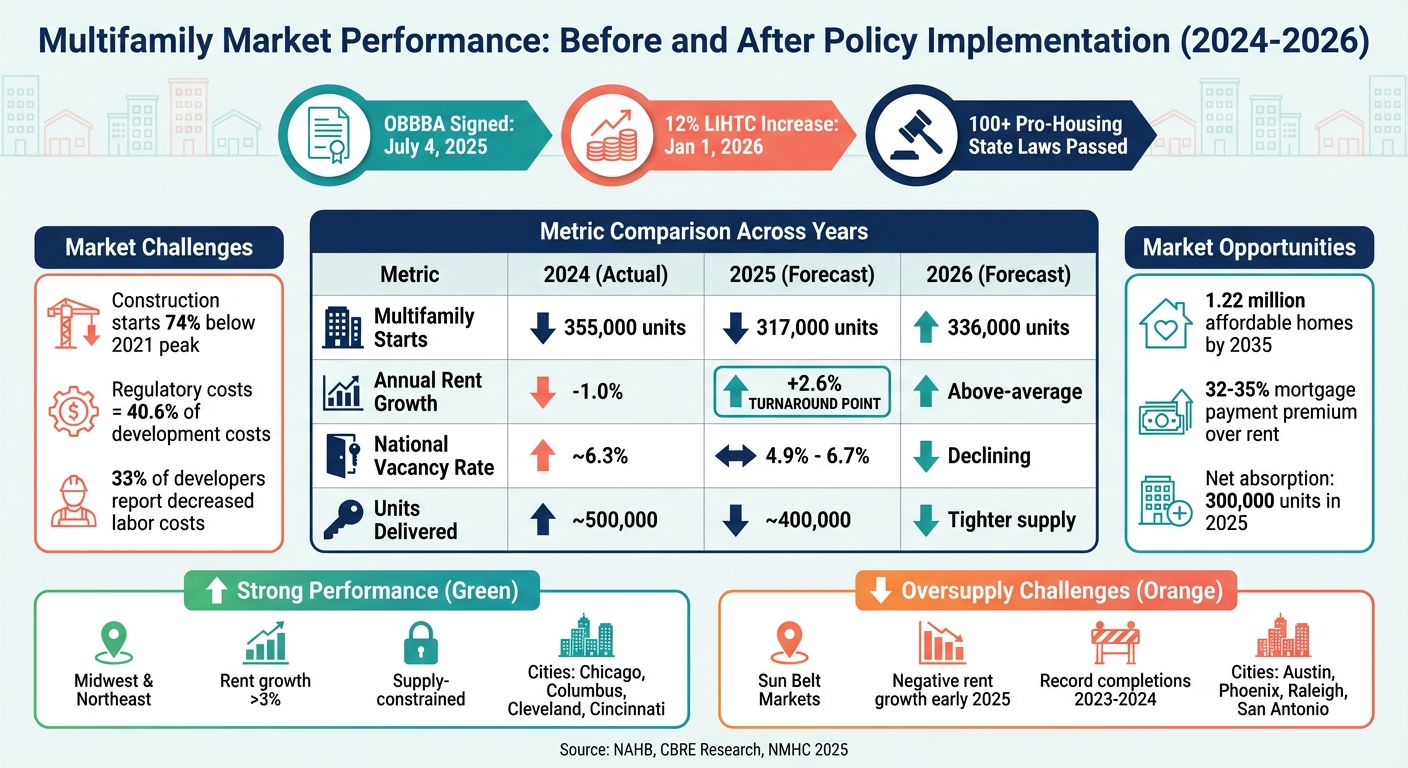
The multifamily housing market in 2025 reflects a mix of challenges and stabilization efforts following recent policy changes. Construction starts fell by 11% to 317,000 units, following a sharper 25% drop in 2024[20]. By mid-2025, starts were 74% below their 2021 peak and 30% lower than pre-pandemic levels[25]. However, improved financing conditions helped make more projects financially feasible.
Renter demand remained strong, largely driven by a 32–35% premium on new home mortgage payments compared to average apartment rents[25]. This affordability gap kept many potential homebuyers in the rental market, which supported absorption rates even as new supply entered the market. National rent growth was projected at 2.6% for 2025, signaling recovery from the negative growth experienced in late 2024[25].
Vacancy rates presented a mixed picture. CBRE estimated the national vacancy rate would close 2025 at 4.9%, while other analysts predicted it could rise to 6.7%[23][25]. Net absorption was anticipated to hit around 300,000 units, down from the 480,000 units absorbed in 2024. This decline reflects the substantial supply wave from 2023–2024, when nearly 1 million units entered the market[23]. These metrics highlight how market conditions evolved in response to key policy shifts.
Before and After Policy Implementation: A Comparison
The table below illustrates how policy-driven economic changes influenced the multifamily market:
| Metric | 2024 (Actual/Est.) | 2025 (Forecast) | 2026 (Forecast) |
|---|---|---|---|
| Multifamily Starts | 355,000[20] | 317,000[20] | 336,000[20] |
| Annual Rent Growth | -1.0%[20] | 2.6%[25] | Above-average[25] |
| National Vacancy Rate | ~6.3%[23] | 4.9% - 6.7%[23][25] | Declining[25] |
| Units Delivered | ~500,000[23] | ~400,000[23] | Tighter supply[21] |
One notable shift was the rebound from negative rent growth in 2024 to positive growth in 2025, signaling a turning point. Danushka Nanayakkara-Skillington, Assistant Vice President for Forecasting and Analysis at NAHB, explained:
NAHB is projecting that multifamily construction will decline again in the first half of 2025 before moving back to long-term trends toward the end of the year[20].
By the end of 2025, 33% of developers reported decreases in labor costs, and 25% noted a decline or slowdown in material costs[22]. These reductions helped stabilize construction expenses, paving the way for a modest recovery in starts by 2026.
Regional Differences in Multifamily Performance
While national trends provide a broad overview, regional variations tell a more nuanced story. Supply-constrained areas in the Midwest and Northeast saw rent growth exceeding 3% in 2025, driven by limited new construction in recent years. Cities like Chicago, Columbus, Cleveland, and Cincinnati performed particularly well[24][25].
On the other hand, Sun Belt markets such as Austin, Phoenix, Raleigh, and San Antonio faced negative rent growth in early 2025. These markets were grappling with oversupply from record-high completions over the past two years[21][24].
Urban gateway markets, including Los Angeles and New York, continued to attract renters despite higher costs. In these areas, the cost of buying a home was over 2.5 times the average rent, keeping rental demand strong[25]. Meanwhile, metros like Columbus, Austin, Houston, Phoenix, and New York showed significant permit growth in May 2025, with year-over-year increases ranging from 660 to 1,288 permits[21].
CBRE Research highlighted the regional divide:
Investors will have to wait until 2026 or later for market fundamentals in the Sun Belt and Mountain regions to be as strong as those of the Midwest, Northeast and coastal regions[25].
These regional differences emphasize how local supply levels and regulatory environments, shaped by recent policies, continue to influence investment strategies and market performance.
Using Technology for Policy-Driven Investment Strategies
Policy changes in 2025 have made timing and access to accurate data more critical than ever for multifamily investors. Recent tenant protection measures have further complicated cost structures, and new regulations now account for 40.6% of development costs[19]. This makes real-time tracking essential for navigating these challenges.
Caitlin Sugrue Walter, Ph.D., SVP and Head of Research and Innovation at NMHC, captured the difficulty of the situation:
New policies increase uncertainty for housing providers and their financial backers, with the only certainty being that it will likely increase their costs and, as a result, necessitate rent increases.[19]
This growing uncertainty has underscored the importance of integrated, real-time tools that allow investors to adapt quickly to market changes. Relying on static quarterly reports has left some professionals reacting weeks - or even months - too late. For instance, the 63,583 federal employee layoffs in January and February 2025 sent shockwaves through markets like Washington, D.C., where 34% of apartment residents are federal employees[19]. Similarly, during previous supply chain disruptions, 52% of developers faced construction delays, and repriced deals saw an average cost increase of 11%[19]. These kinds of challenges demand tools that provide immediate, precise insights for policy-focused investment strategies.
Real-Time Data Integration for Better Decisions
CoreCast has emerged as a solution to these challenges by integrating underwriting, pipeline tracking, and portfolio analysis into a single platform. Instead of juggling multiple systems, investors can track how policy changes impact their assets in real-time. The platform pulls data directly from property management systems, ensuring that forecasts are always based on the latest market conditions.
One standout feature is its integrated mapping tool, which visualizes properties alongside competitors, demographic trends, and local market indicators. This is particularly useful for tracking zoning reforms tied to housing policies. For example, investors monitoring the ROAD to Housing Act of 2025 can pinpoint municipalities implementing zoning changes and identify areas likely to receive federal incentives[2].
The pipeline tracking feature allows users to monitor potential deals and tenant prospects at every stage, helping refine vacancy forecasts before they affect the broader portfolio. Additionally, the platform’s ability to recognize patterns across multiple assets - like seasonal vacancy trends - enables investors to apply successful strategies from one property to others.
Portfolio Analysis with Predictive Tools
CoreCast builds on its real-time data capabilities with advanced predictive tools that help investors model compliance costs and evaluate the impact of new incentives instantly. For example, its underwriting features allow investors to account for rising compliance costs when assessing acquisitions. With a 12% permanent increase in 9% Low-Income Housing Tax Credits and the extension of the Opportunity Zone program[27], CoreCast enables users to quickly calculate how these incentives might affect portfolio yields. The platform also adjusts assumptions to reflect the new maximum per-unit subsidy limits, which have risen to 270% in designated High Cost Areas[28].
Another key feature is its stakeholder center, which generates custom-branded reports. These reports clearly outline vacancy trends, recommended actions, and confidence levels for predictions, making it easier to communicate the impact of tenant protection requirements or compliance costs on returns. Instead of manually gathering data from various sources, investors can share polished, professional reports that show how they’re adapting to policy changes.
For operators managing properties backed by Fannie Mae or Freddie Mac mortgages, CoreCast simplifies compliance with new tenant notification standards. By standardizing data governance and using consistent naming conventions across properties, the platform ensures regulatory requirements and operational metrics are tracked effectively, helping operators stay ahead of evolving policies.
Conclusion
The policy landscape in 2025 has reshaped how multifamily investments are approached. Federal measures, such as the 12% permanent increase in 9% LIHTC funding to $14 billion annually and the ROAD to Housing Act, have opened new opportunities for affordable housing development[27]. At the same time, state-level initiatives like Florida's 75% property tax abatements and California's zoning changes are easing restrictions in previously tight markets[26]. However, new tenant protections from the FHFA and other regulatory adjustments add layers of complexity to investment analysis[19].
The market is undergoing a pivotal shift. Construction starts and deliveries have dropped significantly, signaling the end of the oversupply phase. Optimism is bolstered by record net absorption of 130,000 units in Q1 2025 and a 35% mortgage payment premium, reflecting strong demand[25][26].
In this evolving environment, data-driven tools are no longer optional - they’re critical. Market dynamics are diverging: Midwest and Northeast metros with limited development pipelines are experiencing stronger rent growth, while Sun Belt cities are still digesting the influx of 2024 deliveries[24][25]. Platforms like CoreCast offer a comprehensive solution, integrating underwriting, pipeline tracking, portfolio analysis, and compliance monitoring. These tools allow investors to model the impact of LIHTC expansions, track zoning reforms on interactive maps, and generate reports that clearly communicate policy implications - all within a single platform. This level of integration equips investors to navigate the growing complexity with greater efficiency.
To succeed, investors must combine strategic flexibility with operational precision. With cap rates hovering around 5.6% and transaction volumes nearing $380 billion in 2025, capital is flowing to markets aligned with federal housing priorities[4][26]. Those who can quickly adapt to regulatory changes, identify supply-constrained areas, and stay ahead on compliance will be well-positioned to capture the rent growth expected in 2026[25]. The market is poised for recovery - but only those armed with accurate, real-time insights will lead the charge.
FAQs
How do the 2026 LIHTC and bond-rule changes affect deal feasibility?
The updates to the 2026 LIHTC and bond rules bring some notable changes: a permanent 12% increase in LIHTC allocations and a reduction in the bond financing requirement from 50% to 25%. These adjustments are designed to make affordable housing projects more financially viable. With these changes, it’s estimated that around 1.22 million additional affordable homes could be developed over the next ten years.
Which markets are expected to perform best in 2025–2026 based on zoning and supply trends?
Markets with restricted supply growth are expected to stand out in 2025–2026. These include prominent coastal cities and metros with tight supply constraints, like Chicago, Cleveland, Cincinnati, and Louisville. In these areas, zoning restrictions and slower development activity create appealing opportunities for multifamily investments.
What new tenant-protection rules should owners budget for in 2025?
In 2025, property owners will need to prepare for new tenant-protection rules. These include providing 30-day notices for rent increases and lease expirations, a 5-day grace period for late rent payments, and additional safeguards for tenants. Among these are measures to support victims of domestic violence and more efficient eviction procedures. These updates are designed to strengthen tenant rights while promoting fair practices within the multifamily housing sector.