
Portfolio-Wide Energy Benchmarking Benefits

Portfolio-wide energy benchmarking helps property managers and stakeholders reduce energy costs, improve building performance, and meet regulatory requirements. By benchmarking real estate portfolios effectively, you can identify inefficiencies, prioritize upgrades, and track progress toward financial and environmental goals. Key takeaways include:
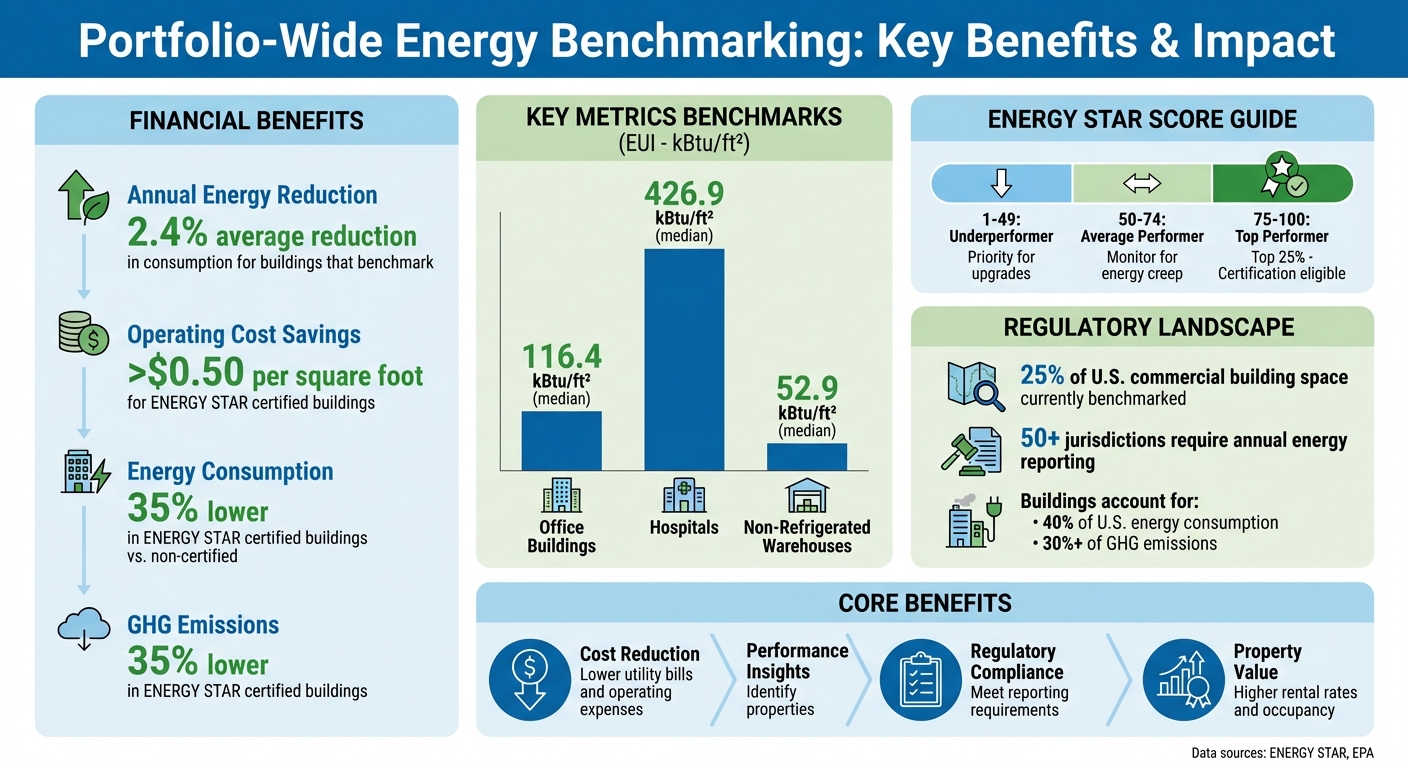
- Energy Savings: Buildings that benchmark energy use cut consumption by an average of 2.4% annually.
- Cost Reduction: ENERGY STAR-certified buildings save over $0.50 per square foot in operating costs.
- Performance Insights: Tools like ENERGY STAR Portfolio Manager provide metrics like Energy Use Intensity (EUI) and emissions tracking to pinpoint underperforming properties.
- Regulatory Compliance: Benchmarking supports adherence to energy reporting laws and prepares portfolios for future mandates.
- Informed Investment: Data-driven decisions ensure capital is allocated to projects with the highest returns.
Benchmarking turns raw utility data into actionable insights, helping you operate more efficiently while boosting property value and sustainability efforts.
Portfolio Energy Benchmarking Benefits: Key Statistics and Savings
Key Metrics for Portfolio Energy Benchmarking
Energy Use Intensity (EUI)
Energy Use Intensity (EUI) plays a key role in portfolio benchmarking. It quantifies a building's annual energy consumption per square foot, expressed in kBtu per square foot per year [4]. This allows buildings of all sizes to be compared on an even playing field - whether it’s a 50,000-square-foot office or a 500,000-square-foot skyscraper.
It’s important to distinguish between site energy, which reflects the energy shown on utility bills, and source energy, which accounts for production and transmission losses [4]. For portfolio benchmarking, source EUI is often a better indicator, especially when buildings rely on different energy types like electricity, natural gas, or steam [7].
To provide some perspective, median benchmarks show that a typical office building has a source EUI of 116.4 kBtu/ft², while hospitals average 426.9 kBtu/ft² [4]. Meanwhile, non-refrigerated warehouses operate at about 52.9 kBtu/ft² [4]. If a building’s EUI significantly exceeds its peer group’s median, it’s a red flag indicating inefficiencies that warrant further investigation.
In addition to EUI, tracking carbon emissions helps measure a building’s broader environmental footprint.
Carbon Emissions Tracking
Once energy demand is measured using EUI, tracking carbon emissions adds essential environmental context. Monitoring greenhouse gas (GHG) emissions has become increasingly important, both for achieving sustainability goals and complying with evolving regulations [3][6]. Tools like the ENERGY STAR Portfolio Manager integrate emissions tracking with energy data, giving a clear picture of a property’s environmental impact [6].
Emissions tracking also helps pinpoint which properties are the largest contributors to a portfolio’s overall carbon footprint. This insight allows stakeholders to focus decarbonization efforts where they can make the biggest difference.
While environmental metrics are crucial, understanding utility costs sheds light on financial performance.
Utility Cost Analysis
Analyzing utility costs offers a practical view of how inefficient energy use impacts the bottom line [3][6]. By comparing utility expenses across a portfolio to track performance, it’s easier to identify properties where high costs may indicate inefficiencies rather than necessary operational expenses [3][6].
The ENERGY STAR 1–100 score provides another layer of insight. This rating system normalizes performance, with scores below 50 signaling underperforming buildings that might benefit from cost-effective upgrades [5].
To ensure fair comparisons across different climates, weather-normalized metrics adjust for seasonal variations [5][3]. These adjustments help reveal a property’s true performance, eliminating distortions caused by external weather conditions. Modern benchmarking tools make it possible to account for these variables, delivering a clearer picture of energy efficiency.
sbb-itb-99d029f
Financial Benefits: Cost Savings and ROI Improvement
Reducing Operating Expenses
Efficiency insights can lead to direct financial advantages. Portfolio-wide benchmarking highlights areas of excessive energy spending. In fact, buildings that consistently benchmark their energy usage see a 2.4% annual reduction in energy consumption [2]. These savings translate into lower utility bills across an entire portfolio.
Focusing on properties with significantly higher energy use can yield immediate cost reductions [3][8]. For example, a building with an ENERGY STAR score below 50 performs worse than half of all comparable properties nationwide [1][8]. This indicates that its operating expenses are unnecessarily high. By prioritizing these underperforming properties, portfolio managers can quickly cut costs without wasting time guessing where improvements are needed [8].
Once the most efficient buildings in a portfolio are identified, their operational practices can be applied to underperforming sites [3]. This strategy ensures that capital is directed toward projects with the highest potential returns, avoiding unnecessary investments in properties that are already optimized.
Increasing Property Value
Lowering operating expenses doesn’t just cut costs - it also enhances property value. ENERGY STAR certified office buildings operate at over $0.50 per square foot less than their non-certified counterparts [9]. This cost efficiency makes these buildings more appealing to tenants who value sustainability and reduced operating costs.
Achieving an ENERGY STAR score of 75 or higher places a property in the top 25% of the market for energy performance. This distinction allows property owners to justify higher rental rates and attract better occupancy levels [9]. For portfolio owners, energy benchmarking not only reduces costs but also strengthens the overall asset value of their properties.
Optimizing Capital Expenditures (CapEx)
Benchmarking data takes the guesswork out of capital allocation. This process often involves scenario analysis for real estate portfolios to evaluate how different investment strategies perform under various market conditions. Instead of investing in systems that might not need upgrades, portfolio managers can rely on objective data to pinpoint which properties will yield the highest financial returns from efficiency improvements [3]. Financial tools allow for a direct comparison of potential savings across all properties, ensuring that limited capital is spent on projects with the greatest impact [3].
Ongoing tracking after upgrades ensures that projected energy savings are achieved and maintained [3]. This continuous monitoring prevents "snapback", where initial savings are lost over time due to poor maintenance or operational drift [3]. By measuring performance against a baseline, portfolio managers can confirm that their CapEx investments deliver lasting returns rather than short-lived improvements.
| Metric | ENERGY STAR Certified Buildings | Non-Certified Peer Buildings |
|---|---|---|
| Energy Consumption | 35% Lower [9] | Baseline |
| Operating Costs | >$0.50/sq. ft. Lower [9] | Baseline |
| GHG Emissions | 35% Lower [9] | Baseline |
| Efficiency Level | Top 25% [9] | Median or below |
Operational Benefits: Prioritizing Investments and Maintenance
Identifying Underperforming Properties
Benchmarking is a powerful tool for identifying buildings that consume more energy than they should, even when their systems appear to be working. For example, an ENERGY STAR score below 50 flags properties as underperformers, making them prime candidates for energy efficiency upgrades [1][8].
This scoring system takes the guesswork out of deciding where to allocate resources. Instead of spreading investments evenly across all buildings, portfolio managers can focus on properties with the lowest scores - where improvements are most likely to yield the greatest return. These insights also guide maintenance planning, highlighting which buildings need immediate attention.
| Performance Category | ENERGY STAR Score | Action/Strategy |
|---|---|---|
| Top Performer | 75 – 100 | Qualify for certification; analyze practices to replicate success. |
| Average Performer | 50 – 74 | Watch for "energy creep"; make minor operational adjustments. |
| Underperformer | 1 – 49 | Prioritize for audits; consider major upgrades or equipment replacement. |
Improving Maintenance Planning
Tracking energy use over time offers a clear picture of equipment performance, helping to spot problems before they lead to expensive repairs. For instance, a slow increase in energy consumption - known as energy creep - can signal that equipment is losing efficiency [8]. Similarly, sudden energy spikes might point to serious issues, like a failing HVAC system.
By regularly benchmarking energy data, maintenance shifts from being reactive to proactive. Instead of waiting for systems to break down, teams can address issues early, cutting repair costs and extending the life of building equipment. Using weather-normalized Energy Use Intensity (EUI) ensures that decisions are based on actual equipment performance, not just seasonal changes in climate [8].
Top-performing buildings can also serve as models. Their maintenance and operational strategies can be studied and applied to improve underperforming properties [3]. This approach leads to smarter, more effective management across an entire portfolio.
Making Better Portfolio-Wide Decisions
Benchmarking enables managers to make informed, data-driven decisions for their entire portfolio. Widely used across U.S. commercial properties [3], it allows buildings to be grouped by factors like size, function, or location, enabling fair comparisons with tools like weather-normalized EUI and cost metrics.
Financial features built into benchmarking platforms help managers evaluate cost-saving opportunities across properties. This kind of objective analysis ensures that limited capital expenditure (CapEx) funds are invested in projects that promise the highest financial return. By prioritizing these opportunities, portfolio managers can maximize both efficiency and cost-effectiveness.
How to Use Portfolio Manager to Comply With State and Local Benchmarking Ordinances
Meeting Environmental and Regulatory Requirements
In addition to saving costs and enhancing operations, aligning with environmental and regulatory standards is a key factor in maintaining a strong and forward-thinking real estate portfolio.
Supporting Sustainability Goals
Benchmarking plays a central role in advancing ESG strategies within real estate. Many green building certifications and financing programs - such as those offered by Fannie Mae, Freddie Mac, and the Department of Housing and Urban Development (HUD) - require the disclosure of benchmarking results [11]. This not only helps portfolios qualify for better financing terms but also appeals to investors and tenants who prioritize sustainability.
Moreover, benchmarking serves as the foundation for tracking progress toward climate goals. According to the EPA, "As state and local governments establish climate commitments, achieving emission reductions from buildings is critical for reaching decarbonization goals" [10]. For portfolio managers, this means benchmarking goes beyond compliance - it positions assets to meet increasing demand for environmentally conscious real estate. By providing the necessary sustainability data, benchmarking supports green financing opportunities and ensures readiness for evolving regulations.
Staying Compliant with Energy Regulations
The regulatory environment for energy efficiency is evolving quickly. Currently, around 25% of U.S. commercial building space is benchmarked using ENERGY STAR Portfolio Manager, and many jurisdictions now require annual energy reporting and public disclosure [3][11]. Adding to this, Building Performance Standards (BPS) are being implemented in various states and cities, setting energy or emissions targets with mandatory milestones [10].
Federal buildings also face specific requirements under the Federal Guiding Principles for High Performance Sustainable Buildings, which mandate benchmarking as part of compliance [5]. Even in areas without existing mandates, starting the benchmarking process now can help portfolios adapt to future regulations. As ENERGY STAR emphasizes, "By encouraging [clients] to start benchmarking now, you are positioning them to respond to any future laws or mandates that come their way" [11].
| Policy Type | What It Requires | How Benchmarking Helps |
|---|---|---|
| Benchmarking & Transparency Laws | Annual reporting of energy and water use | Provides data for public disclosure and market comparison |
| Building Performance Standards (BPS) | Meeting specific performance targets over time | Tracks progress toward mandated goals and sets baselines |
| Green Financing Requirements | Energy reporting for specialized loans | Confirms efficiency criteria for better loan terms |
Reducing Carbon Footprint
Buildings are responsible for nearly 40% of the energy consumed and over 30% of greenhouse gas emissions in the U.S. [10]. Benchmarking serves as the entry point for understanding and addressing a portfolio’s carbon footprint. With this data, decision-makers can identify areas for improvement, lower energy use, and reduce emissions. These efforts align real estate portfolios with broader national decarbonization objectives, making them more sustainable and competitive in the long run.
Implementing Portfolio-Wide Benchmarking with CoreCast

Managing energy data across multiple properties can be a daunting task. CoreCast, an all-in-one real estate intelligence platform, simplifies this process by integrating energy benchmarking with tools for performance tracking, deal analysis, and stakeholder communication.
Using CoreCast for Portfolio Insights
CoreCast's portfolio analysis tools make it easier to compare energy performance across your entire property portfolio from a single, centralized dashboard. The platform brings together energy metrics alongside data like occupancy rates, rental income, and operating expenses. This combined view helps you quickly spot properties using more energy than expected based on their size or type, allowing you to prioritize them for energy efficiency improvements.
With real-time analytics, CoreCast keeps you updated on key performance indicators. If energy costs surge or consumption patterns deviate from the norm, the platform flags these issues immediately - no need to wait for a scheduled review. Additionally, its market mapping feature overlays energy performance data on geographic views, offering insights into how your properties stack up against others in specific neighborhoods or markets. This level of integration makes managing energy data far more efficient, setting the stage for smoother operations, as explored in the next section.
Simplifying Benchmarking Processes
CoreCast takes the complexity out of benchmarking by seamlessly integrating with property management systems to automatically pull utility data. This eliminates the need for manual data entry, which is often a time-consuming part of the process. Many utilities now provide aggregated whole-building data that can be sent directly to benchmarking accounts, and CoreCast supports these automated data transfers through its third-party integrations [12].
The platform also uses a standardized approach for underwriting, ensuring consistent evaluations across various asset classes and risk profiles. Whether you're managing multifamily, office, retail, or industrial properties, CoreCast applies universal metrics like Energy Use Intensity (EUI). This consistency makes it easier to compare buildings regardless of type or location, allowing you to focus on actionable insights instead of reconciling inconsistent data formats.
Making Smarter Investments with CoreCast
CoreCast's stakeholder center automates the creation of branded reports on energy performance and opportunities for improvement. Instead of spending time manually compiling quarterly updates, the platform generates these reports using the most current data. This feature is especially helpful when showcasing progress toward energy efficiency goals or justifying capital investments in upgrades.
The platform also tracks energy improvement projects from initial assessment to verification, ensuring that the returns on your investments are measurable and sustained. Research shows that buildings that regularly benchmark their energy use reduce consumption by an average of 2.4% annually [2]. CoreCast helps you verify these savings and prevents "snapback", where energy use increases again after initial reductions, ensuring that your efficiency efforts yield long-term benefits.
Measuring Long-Term Portfolio Performance Improvements
Tracking Progress Over Time
Benchmarking isn’t just a one-time task - it’s a continuous process that uncovers gradual energy efficiency improvements. A study spanning three years and 35,000 buildings highlights this, showing that consistent benchmarking leads to steady efficiency gains [13][2].
To stay on track, set a fixed annual baseline for each property. This helps you spot performance drifts and identify operational issues early on [8]. Using weather-normalized metrics ensures that the changes you see are based on true efficiency improvements, not just seasonal weather variations [8].
Quantifying Financial and Environmental Impact
Once you’ve tracked your progress, the next step is understanding its impact. The 1–100 ENERGY STAR score offers a quick way to see how a building stacks up against similar properties nationwide. A score of 75 or higher signals a top-performing property [1][8]. Pair this with Energy Use Intensity (EUI) and annual energy costs to calculate savings per square foot across your portfolio.
But it’s not just about dollars saved. Monitoring greenhouse gas emissions and carbon footprints adds a layer of environmental accountability. Portfolio Manager provides over 100 metrics, covering energy, water, waste, and emissions [1]. These metrics are invaluable for ESG reporting and tracking progress toward sustainability goals.
By quantifying both financial and environmental outcomes, you create a clear picture of your portfolio’s performance.
Building a Data-Driven Strategy for the Future
"What gets measured gets managed." - ENERGY STAR [3]
The insights gained from benchmarking and impact tracking pave the way for a smarter, data-driven strategy. Start by identifying your top-performing buildings and collaborating with their teams to replicate energy-saving practices across less efficient properties [3]. Focus your investments on buildings with the lowest ENERGY STAR scores, as they often offer the most room for improvement and the best return on investment [8].
Set clear performance targets, like achieving a specific ENERGY STAR score or improving efficiency by a set percentage compared to your baseline year [8]. Monthly data updates allow you to catch performance issues early, ensuring consistent energy savings over time [8]. This approach shifts benchmarking from being a simple compliance task to a strategic tool that delivers ongoing financial and environmental rewards.
Conclusion
Portfolio-wide energy benchmarking offers clear benefits when it comes to cutting costs, improving operations, and achieving sustainability goals. Consistent benchmarking leads to reduced operating expenses and increased property values. By pinpointing underperforming assets and applying lessons from high-performing properties, you can create a portfolio that operates more efficiently and costs less to manage. It provides the data needed to prioritize investments, avoid backsliding on efficiency gains, and make informed maintenance decisions based on real performance metrics rather than assumptions. With its growing adoption in commercial real estate, benchmarking has evolved from a helpful option to a critical practice for staying competitive.
Beyond financial and operational gains, benchmarking strengthens your position on regulatory and sustainability fronts. Tracking energy, water, waste, and carbon emissions in one centralized system simplifies the process of meeting sustainability targets and complying with regulations - especially as over 50 jurisdictions now require annual energy reporting [9].
CoreCast makes this process seamless by combining portfolio analysis, performance monitoring, and real estate investment reporting into a single platform. With CoreCast, you don’t just benchmark - you take action. The platform transforms raw data into real-time insights that inform portfolio-wide decisions. Its integration with property management systems and advanced analytics ensures efficient benchmarking without adding extra workload. This streamlined approach guarantees that every decision is backed by accurate, centralized data.
"What gets measured gets managed." - ENERGY STAR [3]
Start with a baseline, track progress consistently, and let the data guide your strategy. Portfolio-wide benchmarking turns compliance into a powerful tool for driving financial success and sustainable outcomes year after year.
FAQs
How do I start portfolio-wide energy benchmarking?
To start benchmarking energy use across your portfolio, a dependable tool like ENERGY STAR Portfolio Manager is a great choice. Begin by setting up an account, then add your properties along with their energy and water consumption data. Group your properties to simplify analysis and make comparisons. Use the platform to measure energy performance against national medians or similar facilities, pinpoint areas that need improvement, and monitor progress over time with its reporting features. For detailed setup instructions, check out the official guides provided by ENERGY STAR.
Which metric matters most: EUI or the ENERGY STAR score?
The value of EUI (Energy Use Intensity) versus the ENERGY STAR score really depends on what you're trying to achieve with your benchmarking.
- EUI breaks down a building's energy use into a simple metric: how much energy is consumed per square foot each year. It’s great for getting a clear picture of total energy consumption.
- The ENERGY STAR score, on the other hand, rates energy efficiency on a scale of 1–100. It goes beyond just raw numbers by comparing your building’s performance to similar ones, taking into account factors like building type and operations.
In short, use EUI when you're focused on analyzing absolute energy usage. Reach for the ENERGY STAR score when you want to see how your building stacks up against others in the same industry. Each has its place, depending on your goals.
How often should I update benchmarking data to avoid “snapback”?
To avoid the risk of "snapback", make it a habit to update your benchmarking data at least once a year. Keeping this data current can lead to an average energy reduction of 2.4% annually, as regular benchmarking encourages more efficient energy management practices.