
Best Practices for Real-Time Data in Real Estate Reports

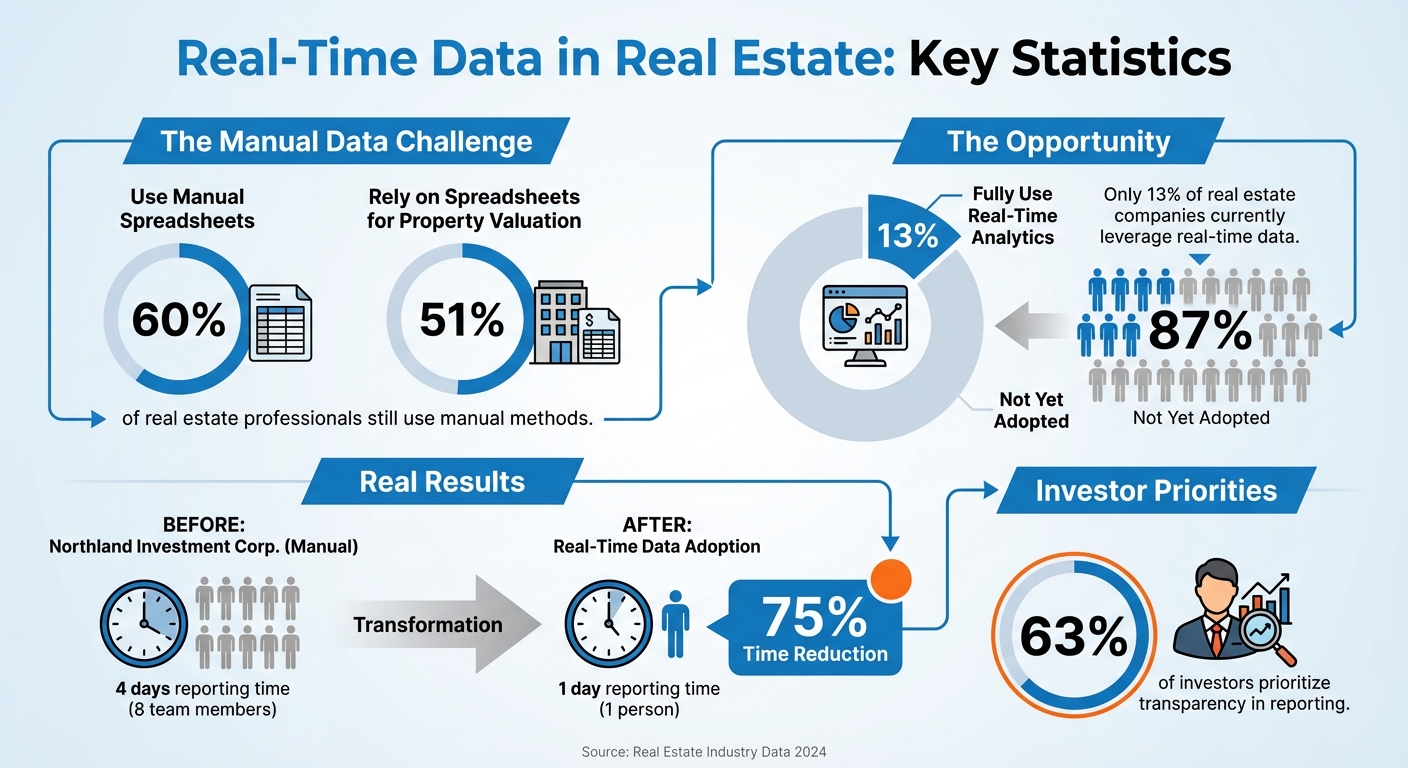
Real estate professionals face a big challenge: outdated, static data in reports. 60% still use manual spreadsheets, and 51% rely on them for property valuation, leading to delays and missed opportunities. The solution? Real-time data.
With real-time systems, you can:
- Spot risks like tenant exposure or lease expirations instantly.
- Avoid fragmented data by creating a single, unified source of truth.
- Automate updates, saving time and reducing errors.
Currently, only 13% of real estate companies fully use real-time analytics, but implementing tools like APIs, dashboards, and automated validation can transform your workflows. Companies like Northland Investment Corporation have already cut reporting time from 4 days to 1 day.
This guide outlines how to integrate real-time data step-by-step, from setting up reliable APIs to creating actionable dashboards and ensuring data accuracy. If you're ready to modernize your reporting, keep reading.
Real-Time Data Adoption in Real Estate: Current State and Impact Statistics
How to Use Data to Help Your Customers in Real Estate with Mike Simonsen
Setting Up Data Standards and API Connections
To create a solid technical foundation, it's essential to adopt reliable APIs and widely accepted data formats. Without these elements, inconsistent data can throw your entire system out of sync.
Using Industry Data Standards
Think of data standards as the common language of the real estate world. The RESO Data Dictionary is the primary standard, offering over 1,700 fields and 3,100 lookups to ensure uniformity across MLSs, brokerages, and reporting tools [2]. When everyone sticks to the same field names and definitions, data flows smoothly between platforms, eliminating the need for constant manual adjustments.
"The RESO Data Dictionary is the real estate industry's universal language for data. It allows a wide range of systems to talk to each other in a seamless manner." - RESO Staff [2]
Another critical tool is the RESO Common Format (RCF), a JSON format that aligns perfectly with the Data Dictionary and works independently of specific APIs [3]. This means even platforms not using the Web API can still process and share your data effectively. Before choosing a data provider, confirm they're RESO Certified to ensure they meet industry standards for compatibility and performance [2].
Choosing and Setting Up APIs
The RESO Web API has taken the place of the older RETS (Real Estate Transaction Standard) as the preferred method for transferring real estate data [4]. Built on RESTful architecture and the OData V4 protocol, it uses HTTP-based requests and JSON formatting to deliver data efficiently. One of its standout features is live queries, which are perfect for real-time reporting needs [4].
For secure access, implement OAuth, an open standard that combines authentication and authorization. This allows users to log in and access data services securely and quickly [4]. Managing large datasets? Start with replication to download a full dataset initially, then use incremental updates to keep everything current [4]. Additionally, leverage API metadata to gain a clear understanding of what data is available [4].
Connecting Multiple Data Sources
Real estate reporting relies on a mix of information - from internal systems like CRM and accounting software to external feeds like MLS data and public records. Bringing all these sources together efficiently is key to creating accurate, actionable insights.
Identifying Your Primary Data Sources
Start by defining the specific business outcomes you want to achieve. Without clear goals, you risk creating a "data swamp" filled with unorganized, unusable information. Typically, your data sources will fall into two main categories:
- Internal sources: These include CRM systems, accounting records, debt schedules, and property valuations.
- External sources: Examples include MLS feeds, public records, demographic data, inflation rates, and GIS data.
For external providers, focus on those offering automated, repeatable data feeds. Amy Tippet, Senior Manager at Altus Group, highlights the importance of this:
"Repeatable data is important for forecasting. You need to be able to get data from one source on a regular basis so you don't have to rewrite templates and reports every time" [1].
To ensure accuracy, cross-check critical property details by comparing MLS listings with public records. This step helps catch inconsistencies early, preventing errors from affecting your reports. Once your primary sources are identified and verified, the next step is to integrate these data streams for real-time analysis.
Using Unified Platforms for Real-Time Insights
After pinpointing your data sources, the focus shifts to integration. Unified platforms simplify this process, enabling seamless analysis. Data warehouses are ideal for storing structured, processed information tailored to specific needs like financial reporting. In contrast, data lakes store raw, unprocessed data, offering flexibility for broader analysis. The goal is to ensure data is entered once and shared across all systems, from asset management tools to accounting software [1].
Platforms like CoreCast are designed to unify all these sources, eliminating data silos and automating insights. CoreCast consolidates information, reducing the need for manual data entry and enabling your team to focus on analysis rather than administrative tasks. With real-time integrations, your reports always reflect the most current portfolio data, supporting faster, more informed decision-making. This streamlined approach strengthens the foundation for modern real estate intelligence.
Ensuring Data Quality and Accuracy
Keeping your data accurate after integration is crucial. Even a small error, like a miscalculated vacancy rate or an incorrect rent figure, can ripple through your portfolio analysis and throw off your insights. To prevent this, it's essential to establish strong validation processes that catch errors before they cause problems.
Setting Up Automated Data Validation
Start by defining clear quality metrics such as accuracy, completeness, and timeliness. These benchmarks guide automated tests and help flag potential issues early on [7]. Tools like data profiling can automatically scan datasets for inconsistencies, duplicates, or missing values before they make it into your reporting pipeline [7]. This step ensures that flawed data doesn’t derail your analysis.
For real estate professionals, variance analysis is a game-changer. Instead of manually comparing projected performance to actual results, automated systems can break down discrepancies, pinpointing gaps in performance [8]. This makes it easier to identify the root causes of issues - whether it's unexpected operating expenses or slower-than-anticipated rent growth.
Additionally, machine learning tools can monitor data flows from start to finish. They provide real-time alerts when anomalies arise, ensuring you can address problems as they happen [7].
Meeting Data Compliance Requirements
Once your data quality is in check, maintaining compliance becomes the next priority. Strong governance practices are key to ensuring both reliability and adherence to regulations. This includes setting clear policies for managing data, restricting access to sensitive information, and leveraging cloud platforms with built-in encryption and audit trails [9][11]. These measures help prevent tampering and unauthorized changes.
Such security protocols are especially important for investor reporting and regulatory reviews. When your team trusts that the data is both secure and accurate, they’re more likely to rely on it. And when data is consistently used across your organization, your insights have a greater impact [10].
sbb-itb-99d029f
Building Dashboards and Visualizations
Once you've confirmed your data's quality, the next step is turning it into actionable dashboards. Different stakeholders have unique needs, so tailoring these views is crucial. What an investor finds valuable will differ from what a property manager requires for day-to-day operations.
Creating Dashboards for Different Stakeholders
When designing dashboards, think about how each role interacts with the data. Investors typically look for big-picture insights like portfolio value, Internal Rate of Return (IRR), and equity multiples. Heat maps that visualize risk exposure across properties can also be incredibly useful for them. Property managers, on the other hand, need more operational data, such as occupancy rates, rent collection figures, and maintenance requests. Executives often focus on market trends and geographic overlays to understand how their portfolio performs across different regions.
To make dashboards effective, highlight the most important metrics using a clear visual hierarchy. Start with high-level summaries and include drill-down options for those who need more details. Adding a "last updated" timestamp can also enhance trust by showing that the data is current.
Platforms like CoreCast simplify this process by consolidating all these views into one interface. This allows users to analyze properties on integrated maps, conduct portfolio-wide assessments, and even send customized, branded reports to stakeholders. These tools bridge the gap between raw data and actionable insights, paving the way for automated updates and alerts.
Automating Data Updates and Alerts
Keeping dashboards accurate and up-to-date is critical, and this is where automation comes in. By automating data refresh cycles - using API integrations that update every 5–15 minutes - you can eliminate manual processes. Aim for a system latency of under two seconds to ensure stakeholders always see the latest information without performance issues.
Set up alerts based on specific thresholds. For instance, trigger notifications if vacancy rates exceed 10%, NOI drops by more than 5%, or new comparable sales pop up within a one-mile radius. These alerts can be delivered via email, SMS, or CRM tools, ensuring they reach the right people at the right time.
For example, Northland Investment Corporation reduced investor reporting time from four days (involving eight team members) to just one day with a single person [8].
To avoid overwhelming users, define clear and actionable rules for alerts. This ensures they provide meaningful insights rather than adding to notification fatigue.
Connecting Real-Time Reporting to Existing Systems
Once your dashboards are set up, the next step is connecting them to your existing systems. By integrating tools like your CRM, property management software, and other enterprise platforms, you can funnel real-time data directly into your reporting dashboards.
Integrating with CRM and Property Management Systems
APIs play a key role in enabling seamless, real-time communication between your CRM, property management system, and reporting tools [12]. Instead of just duplicating data, focus on orchestrating workflows. For example, when a deal in your CRM moves to "Closed Won", this update can automatically reflect in your reporting dashboard and property management system. To make this work smoothly, align data fields across systems - for instance, ensure your CRM’s "Customer ID" matches the "Tenant ID" in your property management software to avoid mismatches.
To keep these integrations running smoothly, use prebuilt connectors and implement automated error-handling mechanisms, including retry logic, to minimize disruptions [5].
"APIs are the foundation driving scalability, transparency and competitive differentiation." - Richard Patapoff and Andrew Wang, J.P. Morgan [12]
Platforms like CoreCast simplify this process by offering built-in integration capabilities with property management systems. Acting as a centralized hub, CoreCast supports underwriting, pipeline tracking, portfolio analysis, and stakeholder reporting. This approach eliminates the need to create separate connections for each function, saving time and reducing complexity.
With reliable API connections in place, the next critical step is ensuring that your data remains aligned across systems.
Preventing Data Silos During Integration
Data silos - where critical information gets stuck in isolated systems - can disrupt your ability to see the full picture of your portfolio. The key to avoiding silos isn’t just integration; it’s aligning your data across platforms. Standardizing data labels, such as mapping terms like "Ask Price" and "Offer Price" to a unified "List Price", ensures consistency and reduces confusion [6].
"RCF [RESO Common Format] ensures that data can be easily shared and understood across various platforms, reducing errors, improving efficiency and enabling new products." - Sam DeBord, CEO of RESO [3]
To maintain smooth integrations, monitor API usage and permissions to avoid throttling issues, and use real-time updates for critical workflows. For high-volume data loads, batch processing can be a more efficient option [5]. Modern integration platforms often include AI-driven error-handling capabilities, which resolve most workflow exceptions and minimize downtime.
Finally, it’s important to distinguish between two types of integration: application integration, which handles real-time workflows, and data integration, which consolidates information into a central repository for deeper analysis. By addressing both, you ensure smooth daily operations while also gaining the insights needed for long-term strategic planning [5].
Testing and Monitoring System Performance
Ensuring your system runs smoothly and stays reliable requires thorough testing and constant monitoring. This phase ties everything together, verifying that real-time reporting is functioning properly while maintaining standards for data quality, integration, and visualization.
Creating Testing Procedures
Start by setting clear SLAs (Service Level Agreements) that outline uptime and data quality expectations based on how critical the reports are. For example, dashboards that users rely on for operations might need 99.9% reliability - this translates to just 43 minutes of downtime per month. On the other hand, standard business intelligence reports could work with 99% reliability, allowing about 7.2 hours of downtime monthly [13].
Testing should cover six key dimensions: Accuracy, Completeness, Consistency, Uniqueness, Timeliness, and Validity [13]. For real-time systems, ensure data refreshes every 30 seconds and that critical updates are no older than 90 seconds [14]. Also, fine-tune your change detection logic to trigger updates only when new data is available. This helps prevent unnecessary processing and reduces alert fatigue [15].
"Measuring data product SLAs directly ties to the experience your data consumers have and is therefore a much better metric for the quality of your team's output." - Petr Janda and Mikkel Dengsøe, Authors, SYNQ [13]
A great example comes from Lunar, a Danish fintech company, where their Data Manager, Bjørn, reports on data quality KPIs to top executives quarterly. This governance framework ensures regulatory compliance by demonstrating data controls and traceability [13]. Similarly, at Aiven, Data Engineering Manager Stijn streamlined operations for over 900 data models by organizing them into "data products", simplifying issue tracking without wading through hundreds of dependencies [13].
It's also crucial to perform load and stress tests to see how the system handles heavy usage. For instance, a single report page with two visuals refreshing every five minutes can generate 240 queries per hour if accessed by just 10 users [15].
Once testing confirms the system is ready, monitoring ensures it stays that way.
Monitoring and Improving Performance
Testing is just the beginning - ongoing monitoring is what keeps your system running smoothly. Focus on metrics like throughput, latency, and end-to-end transaction times to catch bottlenecks early [16]. Automated alerts should not only flag issues but also provide context, such as the potential business impact and which components are affected [16].
Instead of monitoring individual tables, track your data transformation jobs to avoid unnecessary alerts [13]. For real-time feeds, aim to keep invalid responses (like protobuf or fetching errors) below 1% to maintain reliability [14]. If you're using multiple feed instances behind a load balancer, sticky sessions can help ensure users get consistent data timestamps, avoiding confusing "time jumps" [14].
"Reliable data isn't just an operational requirement, it's a competitive advantage. By prioritizing trust and quality, your team will be trusted to own new critical processes and move faster." - Petr Janda and Mikkel Dengsøe, Authors, SYNQ [13]
As data volumes increase, regularly evaluate your infrastructure’s capacity. If monitoring shows high query loads, address bottlenecks by adding indexes, creating materialized views, or scaling up resources [15]. Always keep production performance data separate from non-production environments so testing doesn’t interfere with your operational metrics [16].
Conclusion
To make the most of real-time data, it's essential to follow some core practices. Begin by adopting standardized data formats and setting up centralized repositories that act as your single source of truth. This unified system simplifies workflows, ensuring smooth operations and avoiding the data fragmentation that often leads to inefficiencies. Before integrating, audit your data sources for accuracy to avoid creating what’s known as a "data swamp" [1].
The impact of precise data integration is hard to ignore. For example, Northland Investment Corporation transformed its investor reporting process. What once required eight team members and four days now takes just one person a single day, thanks to modern reporting technology. This shift has freed up teams to focus on strategic tasks rather than tedious manual data work [8].
"Technology has played a huge role in shortening the time it takes to both market and sell a property, and that technology has allowed investors to transact across ever-increasing distances."
– Bob White, Founder and President, Real Capital Analytics [8]
Transparency has become a top priority, with 63% of investors highlighting its importance in reporting [8]. Real-time data workflows meet this demand by fostering consistent and balanced communication, addressing both achievements and challenges. To achieve this, connect your systems through APIs, automate validation processes, and keep a close eye on performance metrics to catch potential issues early.
When done right, integration delivers measurable results. Platforms like CoreCast exemplify this by bringing together all these best practices into a single, end-to-end solution. CoreCast handles everything from underwriting assets and tracking pipelines to analyzing portfolios and generating branded reports with real-time data. By consolidating these workflows, it eliminates manual handoffs and data silos, enabling faster and more informed decision-making.
FAQs
How does real-time data enhance property valuation in real estate?
Real-time data brings a new level of precision to property valuation by offering the latest insights into market trends, property characteristics, recent sales, and comparable listings. This timely information helps real estate professionals make assessments that are both accurate and relevant.
Using real-time data means you can adapt to changing market conditions, analyze competitive factors, and fine-tune investment strategies. This ensures valuations stay aligned with current market realities and provide a reliable foundation for decision-making.
What are the advantages of using the RESO Data Dictionary and Common Format in real estate reporting?
The RESO Data Dictionary and Common Format offer a unified approach to organizing and sharing real estate data. By sticking to these standards, you can achieve more precise data exchanges, smoother platform integrations, and uniform reporting.
These standards simplify workflows by minimizing differences in terminology and structure, making data analysis and interpretation faster and more straightforward. They also improve compatibility, enabling real estate professionals to seamlessly collaborate across different systems and tools.
How does automated data validation improve the quality of real estate reports?
Automated data validation plays a key role in improving the quality of real estate reports. It ensures that property details are accurate, consistent, and cross-checked with reliable sources. This approach minimizes errors, saves valuable time, and ensures adherence to industry standards.
By integrating automation into the validation process, real estate professionals can shift their focus to analysis and decision-making, knowing their reports are based on reliable and verified data.