
Carbon Footprint Metrics for CRE Portfolios
Commercial real estate (CRE) portfolios are under increasing pressure to track and reduce carbon emissions. Why? Buildings account for 37% of global energy-related CO2 emissions and consume 34% of the world’s energy. For investors, this isn't just about meeting regulations; it's about managing risk, maintaining trust, and identifying opportunities for efficiency improvements or comparing market performance to optimize asset value.
Here’s the key takeaway: Accurate carbon metrics are essential. They help measure emissions (Scope 1, 2, and 3), set reduction targets, and align with global standards like the GHG Protocol and PCAF. Tracking both operational and embodied emissions is critical, as upfront construction alone can contribute nearly one-third of a building’s lifecycle emissions.
Highlights:
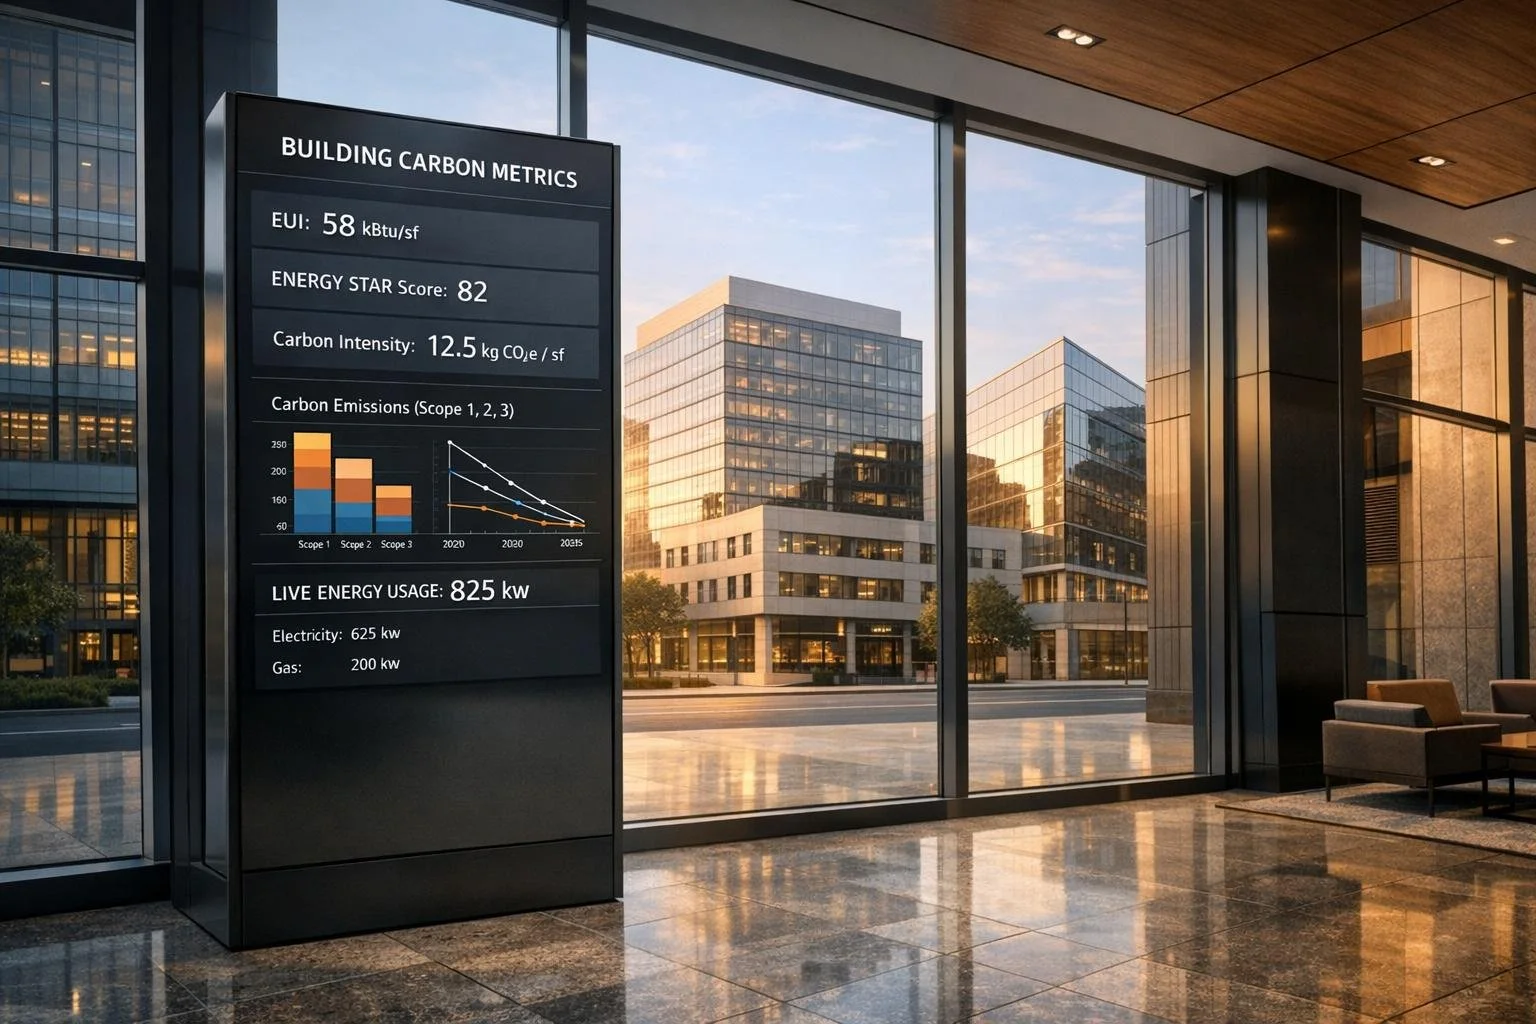
- Key Metrics: Energy Use Intensity (EUI), ENERGY STAR scores, and carbon intensity per square foot.
- Tools: CRREM for stranded asset risk, ENERGY STAR Portfolio Manager for benchmarking, and centralized platforms for real-time emissions data.
- Action Steps: Establish baselines, define boundaries, and use technology to track and report progress effectively.
This approach not only ensures compliance but also reduces costs, improves asset performance, and prepares portfolios for a low-carbon future.
Setting GHG Emissions Baselines
4-Step Process for Establishing GHG Emissions Baselines in Commercial Real Estate
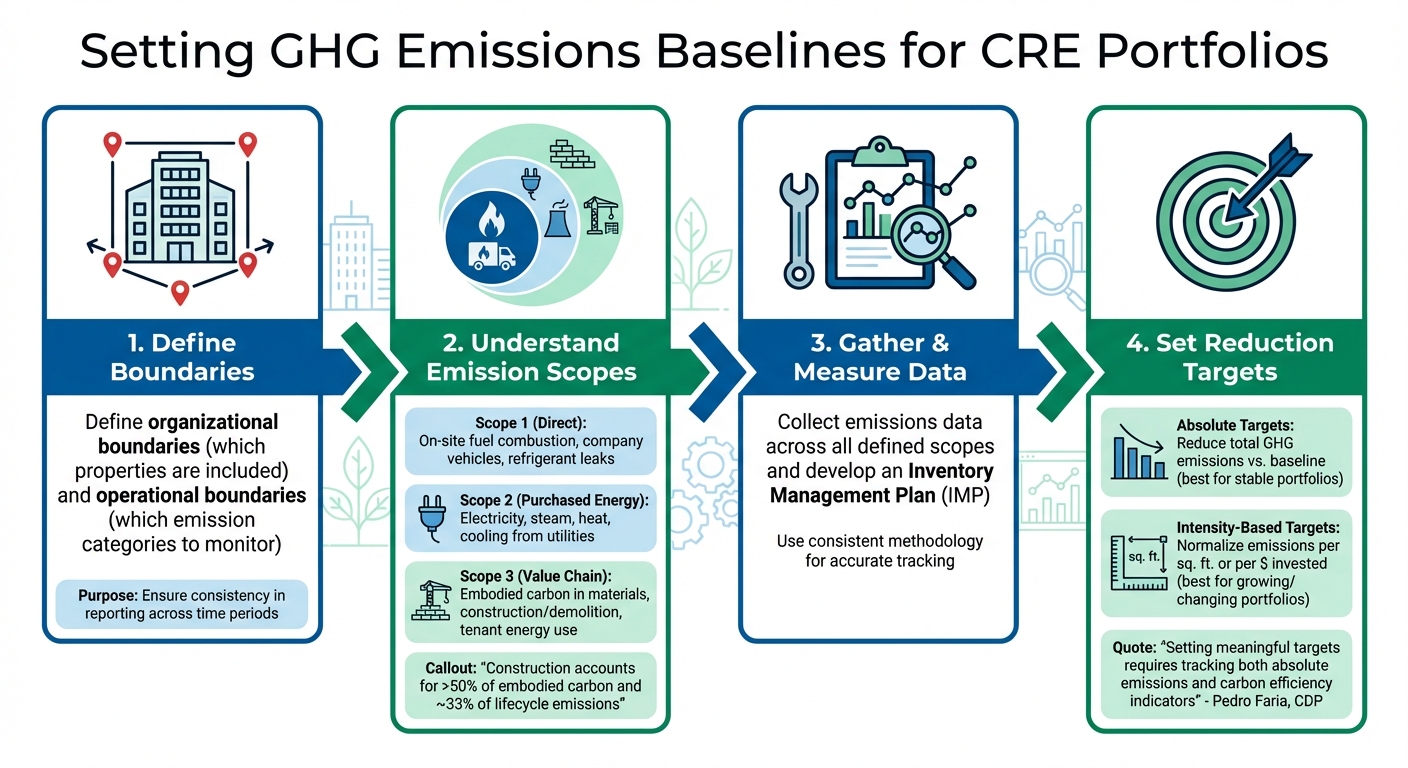
For commercial real estate (CRE) portfolios looking to cut down on their carbon footprint, establishing an accurate baseline is a critical first step to benchmark real estate portfolios effectively. This baseline acts as the foundation for tracking progress over time. To get started, you'll need to: define boundaries, gather and measure emissions data, develop an Inventory Management Plan (IMP), and set clear reduction targets [3].
The first step is deciding your organizational boundaries - which properties are included in your portfolio - and your operational boundaries - which emission categories you'll monitor [3]. These boundaries help ensure consistency in reporting across different time periods.
Understanding Scope 1, 2, and 3 Emissions
The GHG Protocol, a widely recognized global standard, divides emissions into three categories based on their source. Let's break them down:
- Scope 1 emissions are direct emissions from sources you control. These include fuel burned in on-site boilers and furnaces, emissions from company-owned vehicles, and leaks from refrigerants [5].
- Scope 2 emissions stem from purchased energy, like electricity, steam, heat, or cooling used in your buildings [5]. Although these emissions occur at the power plant, they’re included in your inventory because they result from your energy consumption. You can report Scope 2 emissions using either a location-based or market-based approach [4].
- Scope 3 emissions cover all other indirect emissions throughout your value chain. This includes embodied carbon (from producing and transporting construction materials), emissions from third-party construction and demolition, and downstream emissions like tenant-controlled energy use [5]. Since upfront construction accounts for over half of a building's embodied carbon and nearly one-third of its total lifecycle emissions [2], ignoring Scope 3 means missing a major part of your carbon footprint.
Establishing a solid baseline makes it easier to analyze emissions in detail and identify areas for improvement.
Absolute vs. Intensity-Based Targets
Once you've quantified your baseline emissions, the next step is deciding how to measure progress. There are two main approaches: absolute targets and intensity-based targets.
- Absolute targets focus on reducing total greenhouse gas emissions compared to a baseline [4]. These targets are straightforward and clearly show whether overall emissions are increasing or decreasing. They work well for portfolios with a stable number of properties. However, they can be tricky for active portfolios. For example, acquiring new properties might increase total emissions, even if the new buildings are highly efficient. Similarly, selling assets could lower emissions without actually improving efficiency [4]. In such cases, recalculating your baseline year may be necessary to maintain accuracy [4].
- Intensity-based targets offer a different perspective by normalizing emissions against a specific metric, such as metric tons of CO2 equivalent per square foot (MTCO2e/sq. ft.) or per dollar of investment [4]. This approach is particularly helpful for portfolios with fluctuating sizes, allowing for meaningful comparisons of carbon efficiency across diverse assets. It also reduces the need to constantly adjust the baseline year.
"Setting a meaningful emissions reduction target requires taking into account and communicating how these two relevant and largely complementary dimensions of a target will vary in the future: your absolute emissions and some meaningful physical indicator of your carbon efficiency." - Pedro Faria, Technical Director, CDP [4]
sbb-itb-99d029f
Primary Metrics for Carbon Footprint Measurement
Once you've established an emissions baseline, the next step is to monitor key metrics. These metrics help pinpoint inefficiencies, set benchmarks, and guide decisions for better performance. They are essential components of broader strategies to track real estate portfolio performance effectively.
Energy Use Intensity (EUI)
Energy Use Intensity (EUI) is a critical metric for evaluating how efficiently a building uses energy. To calculate it, divide the total energy consumed in one year (measured in kBtu) by the building's total gross floor area. For instance, a 50,000-square-foot office building consuming 5,000,000 kBtu annually would have an EUI of 100 kBtu per square foot [7].
EUI makes it easy to compare buildings of different sizes. A higher EUI often signals wasted energy - and higher operating costs. For more precise comparisons, use source energy, which accounts for energy losses during production and delivery, rather than just site energy (the amount reflected on utility bills) [7].
ENERGY STAR Scores for Building Benchmarking
The ENERGY STAR Portfolio Manager simplifies benchmarking by assigning buildings a score from 1 to 100 based on energy performance. A score of 50 represents the median, while 75 or above places a building in the top 25% of energy-efficient properties nationwide [6][7].
Buildings scoring 75 or higher may qualify for ENERGY STAR certification, which can boost property value and appeal. The Portfolio Manager also calculates emissions for carbon dioxide, methane, and nitrous oxide, considering on-site fuel use and purchased energy like electricity or district heating [1]. Beyond energy performance, the tool tracks over 100 metrics, including costs, emissions, water usage, and waste [6]. However, emissions calculations are separate from the ENERGY STAR score itself.
Carbon Intensity Metrics
While EUI focuses on energy efficiency, carbon intensity metrics zero in on emissions relative to a portfolio's size or financial performance. Examples include metric tons of CO2 equivalent per square foot (MTCO2e/sq. ft.) or emissions per dollar invested [4].
These metrics offer a flexible way to measure carbon efficiency, avoiding penalties for portfolio growth or asset sales. They also enable comparisons across property types. For instance, office buildings often have higher emissions intensity than industrial warehouses [4]. This data helps prioritize which properties need upgrades and highlights where sustainability investments will yield the greatest returns. These metrics also pave the way for more advanced analysis tools discussed in the next section. This includes performing scenario analysis for real estate portfolios to model future carbon risks.
| Metric | Purpose | Unit of Measure |
|---|---|---|
| Energy Use Intensity (EUI) | Evaluates energy efficiency relative to building size | kBtu/sq. ft. |
| ENERGY STAR Score | Benchmarks energy performance against similar buildings | 1–100 scale |
| Carbon Intensity | Assesses emissions relative to size or investment | MTCO2e/sq. ft. or MTCO2e/$ |
Tools for Portfolio Analysis and Risk Assessment
When it comes to managing carbon emissions and mitigating risks, The right tools, such as real-time dashboards, can transform raw data into actionable strategies. These tools help identify which properties are most vulnerable to climate-related risks and pinpoint where investments can deliver the greatest impact.
Carbon Risk Real Estate Monitor (CRREM)
The Carbon Risk Real Estate Monitor (CRREM) is a science-backed tool designed to assess how well properties align with global climate goals. It evaluates a building's current emissions trajectory and compares it to decarbonization pathways that aim to limit global warming to 1.5°C or 2°C. If a building's emissions exceed these pathways, CRREM flags it as a potential stranded asset - a property that could lose value due to stricter climate regulations, higher operating costs, or decreased tenant demand.
CRREM provides property-specific carbon budgets and estimates when a building might surpass acceptable emissions levels. This allows portfolio managers to identify assets that require retrofits or energy upgrades sooner rather than later. By integrating these insights, managers can develop long-term strategies that align with environmental, social, and governance (ESG) goals while safeguarding asset value.
Grid Decarbonization Trends
As the energy sector increasingly transitions to renewable sources, the carbon intensity of electricity is gradually declining. This means that the same level of electricity consumption today could result in fewer emissions in the future as utilities replace coal and natural gas with solar, wind, and other renewable energy sources. However, the speed of this transition varies by region.
Forecasting models that account for grid decarbonization can predict how emissions will change in specific areas over the coming decades. These projections help portfolio managers evaluate whether a property’s emissions will naturally decrease due to cleaner grids or if additional measures - like installing solar panels or electrifying building systems - are necessary to meet carbon reduction goals. Tools like ENERGY STAR Portfolio Manager already incorporate these trends, using emissions factors tailored to specific years (e.g., applying 2015 grid data to 2015 energy consumption) [8].
Factoring grid decarbonization trends into your strategy can guide more precise and effective property upgrades.
Prioritizing Properties for Efficiency Improvements
With finite resources, portfolio managers need a clear system to determine which properties to improve first. A combination of metrics - such as Energy Use Intensity (EUI), ENERGY STAR scores, and CRREM’s stranded asset risk assessment - can create a powerful prioritization framework. Properties with high EUI, ENERGY STAR scores below 50, and significant carbon risks should be top candidates for upgrades [6][7].
Electricity usage patterns also play a critical role. For example, properties in regions with grids heavily dependent on coal or natural gas may see the greatest emissions reductions from energy efficiency upgrades or on-site renewable energy installations. On the other hand, in areas with cleaner grids, electrification strategies - like replacing gas-powered heating systems with electric heat pumps - might provide the most benefits. This layered approach ensures that investments lead to meaningful improvements in both energy efficiency and carbon reduction.
Using Technology for Carbon Footprint Management
Centralized Data and Real-Time Insights
As commercial real estate (CRE) portfolios expand, managing carbon emissions becomes increasingly challenging. Technology platforms simplify this process by automating the collection of data from various sources - on-site fuel consumption, purchased energy, district heating and cooling, and Scope 3 emissions - into a unified system.
With real-time data visibility, portfolio managers can pinpoint emission "hotspots" as they happen and take immediate action. Take, for instance, a digital services company that collaborated with CBRE and Redaptive to upgrade 139,000 lighting fixtures to LEDs across 174 locations spanning five countries. Over a decade, this initiative led to a reduction of 410 million kWh, avoided 290,000 metric tons of CO2 emissions, and saved $55 million in energy costs [9]. This example highlights the transformative potential of advanced tracking systems in monitoring emissions across diverse geographies and property types.
By automating data collection, these platforms eliminate the inaccuracies common in manual spreadsheet tracking. They ensure consistent measurement across property types and normalize data using intensity metrics, such as emissions per square foot. These real-time metrics can then be seamlessly incorporated into broader portfolio analyses.
Portfolio Analysis and Stakeholder Reporting
CoreCast's all-in-one platform aggregates property-level data into comprehensive portfolio insights, enabling managers to evaluate asset performance regardless of location or size. This capability becomes particularly valuable as portfolios grow through acquisitions, ensuring that efficiency gains remain visible.
The platform also simplifies communication with stakeholders. Its stakeholder center and customizable reporting tools make it easy to share sustainability progress with investors, lenders, and regulatory agencies. Automated reports, aligned with global standards like the GHG Protocol, CSRD, and ESRS, streamline compliance with complex regulations, such as New York City's Local Law 97 and Boston's BERDO [9]. Additionally, CoreCast maintains emissions data continuity throughout various deal stages, ensuring accuracy. Its integrated map view further aids managers by offering a visual representation of the competitive landscape and highlighting regional grid decarbonization trends, which can influence property-level emissions forecasts. These features collectively help align portfolio performance with long-term sustainability objectives.
Supporting Sustainability Goals
Technology platforms deliver the reliable, audit-ready data essential for effective decarbonization strategies [9]. With buildings accounting for 37% of global carbon emissions and only 15% of global real estate assets currently aligned with the Paris Agreement's 1.5°C target [9], the need for robust tracking systems is more pressing than ever.
CoreCast equips managers to establish baselines and monitor progress toward both absolute and intensity-based reduction targets. Its analytical tools help determine whether assets are on track to meet long-term climate objectives.
Pedro Faria, Technical Director at CDP, emphasizes the importance of a balanced approach:
"Setting a meaningful emissions reduction target requires taking into account and communicating how these two relevant and largely complementary dimensions of a target will vary in the future: your absolute emissions and some meaningful physical indicator of your carbon efficiency." [4]
Conclusion: Building a Sustainable CRE Portfolio
The commercial real estate (CRE) sector is at a critical juncture. Buildings account for a staggering 37% of global emissions, yet only 15% of assets align with the Paris Agreement's 1.5°C target [9]. This stark contrast highlights the pressing need for accurate carbon metrics and decisive, data-driven actions.
The journey toward sustainability begins with establishing a solid baseline for Scope 1, 2, and 3 emissions, paired with science-based reduction targets. Consistent metrics - like Energy Use Intensity (EUI), carbon intensity per square foot, and avoided emissions from efficiency upgrades - are key to tracking progress. As CBRE aptly puts it, "You can't change what you don't track" [9]. With this foundation, technology can step in to provide actionable insights and accelerate meaningful change.
CoreCast, for example, simplifies the process by centralizing utility data and automating emissions tracking. This real-time visibility empowers portfolio managers to pinpoint high-impact opportunities, make informed retrofit decisions, and allocate capital effectively. Automated, audit-ready reports also streamline communication with investors and regulators, ensuring transparency and accountability.
The financial benefits of sustainability are equally compelling. Energy efficiency projects not only cut costs immediately but also shield assets from regulatory fines and market devaluation. As decarbonization technologies become more affordable, the transition is increasingly practical from both an environmental and economic perspective [9].
Creating a sustainable CRE portfolio is about more than meeting compliance standards or producing ESG reports. It’s a long-term strategy that delivers lower operating costs, attracts tenants, and builds resilience into assets. By leveraging robust data and cutting-edge tools, CRE managers can reduce emissions, control expenses, and protect their portfolios from shifting market and regulatory landscapes. With the industry aiming to decarbonize 37% of global buildings by 2030, this approach ensures both environmental responsibility and enduring value [9].
FAQs
What are Scope 1, 2, and 3 emissions in commercial real estate portfolios, and how are they different?
Scope 1 emissions refer to direct greenhouse gas (GHG) emissions that come from sources owned or controlled by an organization. This includes things like fuel burned on-site or emissions from company-operated vehicles. Scope 2 emissions, on the other hand, are indirect emissions tied to the energy a company purchases, such as electricity, steam, or heating. Scope 3 emissions encompass all other indirect emissions across the value chain. These can include tenant energy consumption, waste management, and activities within the supply chain.
In commercial real estate (CRE) portfolios, Scope 3 emissions typically account for the largest portion of total emissions. This underscores the need for strong collaboration with tenants and partners to effectively reduce the overall environmental footprint.
What are the best ways to track and reduce carbon emissions in commercial real estate portfolios?
To keep carbon emissions in check within commercial real estate (CRE) portfolios, having the right tools is key. These tools should address energy use, waste management, and emissions reporting. One standout option is the ENERGY STAR Portfolio Manager, a widely trusted platform that helps measure and benchmark energy use, water consumption, and greenhouse gas emissions. It’s built to align with established frameworks like the Greenhouse Gas Protocol, ensuring you’re working with dependable data for sustainability initiatives.
For investors, tools like GRESB’s Carbon Footprint Dashboard offer a way to track and report emissions portfolio-wide. Meanwhile, the EPA’s Simplified GHG Management Guide provides practical advice for managing greenhouse gases effectively. Together, these resources can support a well-rounded decarbonization plan, helping you achieve tangible progress in reducing your portfolio’s environmental footprint.
Why is it important to establish a baseline for tracking carbon footprints in real estate?
Establishing a baseline is key to managing carbon footprints in real estate effectively. It serves as a clear starting point to track progress, pinpoint areas that need attention, and set achievable goals for cutting emissions.
A baseline also encourages accountability by allowing consistent monitoring of energy consumption, waste practices, and emissions data. This makes decarbonization efforts measurable and transparent, enabling stakeholders to make informed choices and work toward meeting sustainability goals.