
Debt-to-Equity Ratio Benchmarks for Real Estate

The debt-to-equity (D/E) ratio is a key metric in real estate, showing how much of an investment is funded by debt versus equity. It’s calculated as Debt ÷ Equity and helps assess financial risk, borrowing strategies, and market positioning.
- Higher D/E ratios (above 1.0) indicate more debt than equity, common in sectors like mortgage REITs (average 3.0). This approach can boost growth but increases financial risk.
- Lower D/E ratios (below 1.0) reflect more equity than debt, seen in industrial REITs (0.96) or real estate services (0.81). This reduces risk but may limit returns.
- Balanced ratios vary by sector. For example, office REITs average 1.52, while residential REITs average 1.23.
Your ideal ratio depends on your property type, market conditions, and investment goals. A high ratio may suit growth-focused investors during low-interest periods, while a lower ratio is safer in volatile markets. Regularly compare your D/E ratio to industry benchmarks and adjust based on cash flow, interest rates, and market trends.
Ep. #114 - The Debt-to-Equity (D/E) Ratio
sbb-itb-99d029f
Industry Benchmarks for Debt-to-Equity Ratios
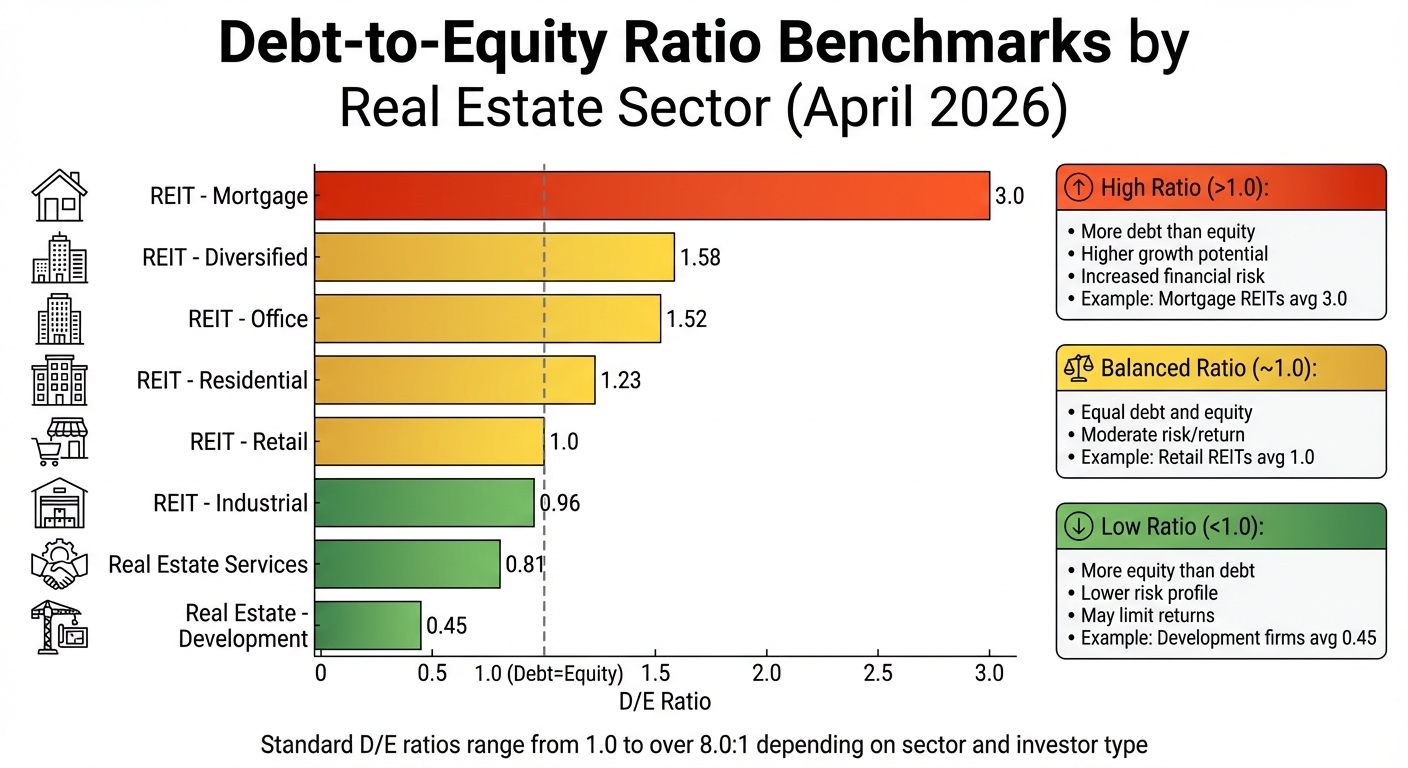
Debt-to-Equity Ratio Benchmarks by Real Estate Sector 2026
Debt-to-equity (D/E) ratios are categorized as conservative, aggressive, or balanced based on industry benchmarks. These benchmarks shift depending on the type of property and the investor group.
Standard Benchmark Ranges
D/E ratios typically range from 1.0 to over 8.0:1 [1]. As of April 2026, various real estate sectors display distinct trends in leverage:
| Real Estate Sub-Sector | Average Debt-to-Equity Ratio |
|---|---|
| REIT - Mortgage | 3.0 |
| REIT - Diversified | 1.58 |
| REIT - Office | 1.52 |
| REIT - Residential | 1.23 |
| REIT - Retail | 1.0 |
| REIT - Industrial | 0.96 |
| Real Estate Services | 0.81 |
| Real Estate - Development | 0.45 |
Mortgage REITs sit at the higher end with an average ratio of 3.0, while development firms maintain the lowest at 0.45 [3]. Office and diversified REITs hover between 1.5 and 1.6, while industrial and retail properties lean toward more conservative levels near 1.0 [3].
"The D/E ratio will differ for every company depending on how they are capitally structured and which type of real estate they invest in." - Investopedia [1]
These benchmarks also shift based on the type of investor.
How Benchmarks Differ by Investor Type
Public REITs often exhibit ratios ranging from 1.0:1 to over 8.0:1. This is largely due to their focus on large-scale property acquisitions and the need to generate dividends for shareholders [1]. Their access to public capital markets and diversified portfolios allows them to manage higher leverage levels effectively.
For instance, Simon Property Group reported $29 billion in liabilities in Q2 2023, while Annaly Capital Management surpassed $77 billion by June 2023 [1]. These figures highlight how institutional investors are comfortable operating with substantial leverage.
On the other hand, private investors and smaller firms generally maintain ratios below 2.0:1. This is due to stricter lending requirements and less diversification. In 2023, the average D/E ratio for U.S. listed real estate companies was 0.94, up from 0.74 in 2022, reflecting how market conditions can influence leverage strategies across the industry [4]. These variations emphasize the importance of tailoring financing approaches to specific investor needs and market dynamics.
How to Interpret Debt-to-Equity Ratios
In the world of real estate, understanding debt-to-equity (D/E) ratios is crucial for making informed financing decisions. This metric reveals how much of a company’s operations are funded by debt compared to equity, offering insight into risk levels and potential returns. Let’s explore what high, low, and balanced D/E ratios can tell you about financial strategy and stability.
What a High Ratio Means
A high D/E ratio suggests that a company is leaning heavily on debt to fuel growth. While this strategy can accelerate portfolio expansion, it also increases the company’s exposure to risk. For real estate businesses, which often require significant capital, this can lead to earnings that fluctuate sharply - especially when interest rates climb.
"A higher D/E ratio indicates a higher default risk for the real estate company." - Investopedia [1]
Lenders typically view high D/E ratios with caution. Companies that exceed industry norms may face challenges securing additional funding, which can limit their ability to seize opportunities during favorable market conditions.
What a Low Ratio Means
A D/E ratio below 1.0 reflects a more conservative approach, relying more on equity than debt. This reduces the risk of default and cushions the company against rising interest rates and hefty debt service costs [1]. However, this strategy may also cap the potential for higher returns that leverage can provide, potentially slowing down portfolio growth.
This approach is often favored by risk-averse investors, particularly in environments where borrowing costs are high.
What Is a Good Ratio for Real Estate?
Striking the right balance between debt and equity is key. There isn’t a universal “perfect” D/E ratio for real estate because the ideal figure depends on factors like property type, market trends, and investment goals. As one expert explains:
"A good ratio is one created by a balanced structure of income, interest, risk, and return." - Investopedia [1]
For instance, during periods of low interest rates, higher leverage might make sense as it can amplify returns. On the flip side, when rates are rising, a more cautious approach may be necessary to manage escalating interest costs. Comparing your D/E ratio to industry peers within the same asset category can also provide valuable perspective, as capital needs differ across property sectors.
The ultimate goal is to ensure that your earnings comfortably cover interest expenses, keeping financial obligations under control while supporting sustainable growth.
When to Adjust Your Debt-to-Equity Ratio
The real estate market is anything but static, and your financing strategy needs to keep up. Adjusting your leverage at the right time can help you optimize returns while steering clear of unnecessary risks. Here’s how to align your leverage strategy with market conditions.
When to Increase Leverage
You might consider increasing leverage when your earnings comfortably outpace interest costs [1]. For growth-driven investors, higher leverage can accelerate portfolio expansion far beyond what equity alone could achieve [5]. This is particularly true for firms with steady, long-term revenue streams - think REITs with long-term leases - since they’re better equipped to handle the added debt burden.
Another advantage? Interest on debt is tax-deductible, which makes borrowing more cost-efficient [5]. Plus, using debt allows you to scale your portfolio without diluting ownership stakes, preserving value for existing shareholders [2]. For instance, as of April 2026, the Mortgage REIT subsector had an average debt-to-equity ratio of 3.0, reflecting the sector’s willingness to embrace aggressive leverage strategies [3]. However, before you increase your leverage, make sure your interest coverage ratio is strong enough to protect your cash flow [1].
When to Decrease Leverage
On the flip side, there are times when reducing leverage is the smarter move. If your borrowing costs start to outweigh your cash generation, it’s a clear sign of positive vs. negative leverage imbalances - a situation that can quickly erode profitability [1]. Rising interest rates or unpredictable revenue streams are also red flags that signal it’s time to deleverage in this capital-heavy industry.
High leverage doesn’t just increase risk; it can also lead to earnings volatility. With higher interest expenses, financial performance can swing dramatically [1]. To gauge whether your leverage is excessive, compare your debt-to-equity ratio to industry benchmarks. Striking the right balance between income, interest costs, and risk is essential to avoiding overextension, especially when market conditions are in flux [1]. Making adjustments in line with these benchmarks can help ensure your portfolio remains on solid ground.
For real estate professionals, tools like CoreCast offer real-time insights and powerful analytics, making it easier to monitor and fine-tune your debt levels as market conditions evolve.
Using Debt-to-Equity Ratios in Investment Decisions
The debt-to-equity (D/E) ratio is a handy metric for assessing deals, securing financing, and keeping portfolios on track.
Comparing Investment Opportunities
When looking at multiple properties or acquisitions, the D/E ratio helps pinpoint which options match your risk tolerance and growth goals. It's important to compare against similar assets in the same sub-sector[1]. For instance, the average D/E ratio for office REITs sits around 1.52 as of April 2026, while residential properties are typically closer to 1.23[3]. Sub-sectors vary quite a bit: mortgage REITs often have a D/E ratio of 3.0, but for retail properties, a ratio above 1.0 might raise eyebrows[3]. Before acquiring new assets, make sure projected earnings comfortably cover financing costs. This kind of analysis often mirrors the criteria lenders use when assessing deals.
Understanding Loan Approval Criteria
Lenders closely examine your D/E ratio to evaluate financial stability. A high ratio can signal trouble meeting interest payments during tough times, increasing the chances of loan rejection[2]. Experts generally recommend keeping your D/E ratio below 5.5 to avoid default risks[6]. However, staying below 2.5 is often considered a safer zone, as it reassures lenders that you're not over-leveraged and can handle fluctuations in occupancy or rental income[2]. In real estate, where capital demands are high, excessive leverage can quickly become a problem if interest rates spike.
Monitoring Portfolio Performance
Maintaining the right D/E ratios is just as important for managing your portfolio as it is for securing loans. As mortgages are paid down, property values change, or new debt is added (like a home equity line), your D/E ratio will shift[6]. Regularly tracking portfolio performance helps identify when leverage becomes risky or when scaling is an option. Tools like CoreCast make this process easier by consolidating portfolio analytics into one platform. With real-time tracking of leverage metrics and property performance comparisons, you gain the insights needed to balance income, interest, risk, and returns - key factors for successful real estate investing.
Key Takeaways
The debt-to-equity (D/E) ratio is a key tool for analyzing financial leverage in real estate investments. It helps investors evaluate risk levels, allocate capital effectively, and make informed investment decisions.
But here's the thing: context matters just as much as the ratio itself. As Investopedia explains:
"The D/E ratio will differ for every company depending on how they are capitally structured and which type of real estate they invest in" [1].
This means you should always compare D/E ratios within the same sub-sector. For instance, a retail REIT should be measured against other retail REITs - not mortgage REITs or office properties. What seems aggressive in one category might be entirely normal in another.
A higher D/E ratio often signals an aggressive growth strategy, which comes with greater risk of default. On the flip side, a lower ratio points to a more conservative, equity-focused approach. While this reduces risk, it might also limit returns. The goal is to strike a balance that fits your portfolio's risk tolerance and growth targets.
D/E ratios are just one piece of the puzzle. Pair them with other real estate metrics - like Net Operating Income (NOI), Cap Rates, and Return on Investment (ROI) - to get a fuller picture of financial health [1]. Regularly reviewing your portfolio, possibly using tools like CoreCast, helps keep your leverage aligned with market trends and supports long-term success in real estate investing.
FAQs
How do I calculate debt-to-equity for a property or portfolio?
To find the debt-to-equity ratio, simply divide the total debt (such as a mortgage balance) by the equity (which is the market value minus the debt).
For instance, if the total debt is $700,000 and the equity is $1,000,000, the calculation would look like this:
Debt-to-Equity Ratio = $700,000 ÷ $1,000,000 = 0.7
This ratio reflects the level of financial leverage. A higher ratio suggests more debt compared to equity, which could point to a greater level of financial risk.
What debt-to-equity ratio do lenders typically prefer in real estate?
Lenders in real estate often favor a debt-to-equity ratio of 1.25 or less. This ratio helps ensure that leverage stays within a manageable range, minimizing the likelihood of default. Keeping the ratio at this level demonstrates financial stability, which plays a key role in obtaining better loan terms.
What other metrics should I review with D/E before investing?
In addition to the debt-to-equity (D/E) ratio, it’s important to evaluate metrics like Net Operating Income (NOI), cap rate, debt service coverage ratio (DSCR), internal rate of return (IRR), and operating expense ratio (OER). Together, these metrics give you a broader understanding of a property's performance, profitability, and potential risks - essential for making smarter investment choices.