
Real-Time Data in Custom Portfolio Reports

Real-time data is changing how real estate professionals manage portfolio reports. Static methods like PDFs and spreadsheets often lag behind market changes, leaving decision-makers with outdated information. Dynamic reporting solves this by using live data feeds to provide up-to-the-moment insights, enabling faster decisions and reducing errors.
Key Highlights:
- Static Reporting Challenges: Outdated data, slow updates, and limited customization hinder decision-making.
- Dynamic Reporting Benefits: Instant updates, real-time dashboards, and tailored views improve accuracy and speed.
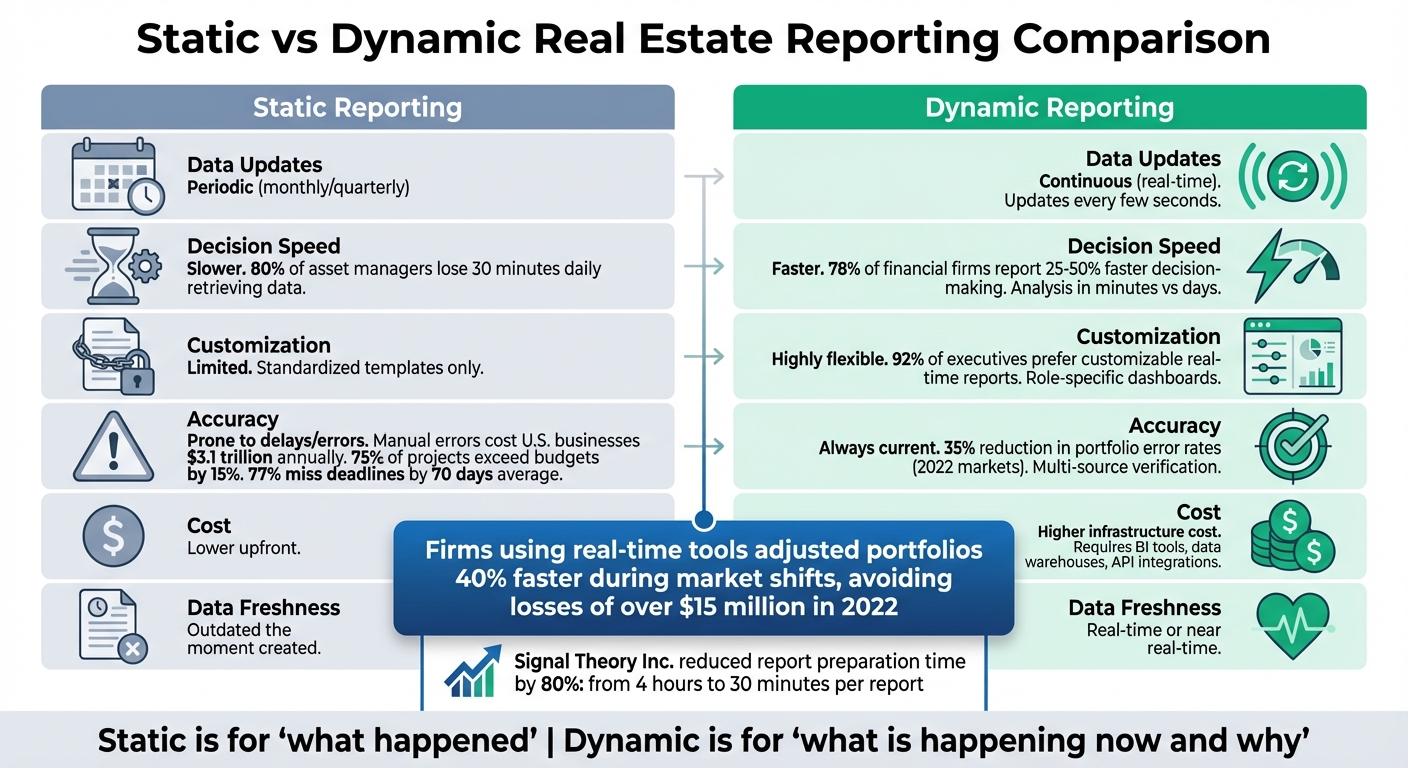
- Real-World Impact: Firms using real-time tools adjusted portfolios 40% faster during market shifts, avoiding losses of over $15 million in 2022.
Quick Comparison:
| Feature | Static Reporting | Dynamic Reporting |
|---|---|---|
| Data Updates | Periodic (monthly/quarterly) | Continuous (real-time) |
| Decision Speed | Slower | Faster |
| Customization | Limited | Highly flexible |
| Accuracy | Prone to delays/errors | Always current |
| Cost | Lower upfront | Higher infrastructure cost |
Platforms like CoreCast streamline real estate management by automating data collection, reducing errors, and providing role-specific dashboards. By replacing static reports, real-time tools empower professionals to make informed decisions based on current market conditions.
Static vs Dynamic Real Estate Reporting: Key Differences and Benefits
1. Static Reporting
static reporting has long been a cornerstone of real estate investment reporting. However, its limitations are becoming increasingly apparent in today’s fast-moving markets. Let’s break down the key challenges associated with this traditional approach.
Data Freshness
Static reports provide a snapshot of data at a specific point in time - essentially, they’re outdated the moment they’re created [4]. This means they only capture historical information, which can be problematic when property values, occupancy rates, or market conditions shift rapidly.
Update Frequency
With updates typically arriving monthly or quarterly, static reporting leaves significant gaps in visibility [4]. The manual data collection involved often delays updates by weeks, creating a time lag between actual events and when they appear in reports [1]. This delay can leave decision-makers relying on stale data, which is far from ideal in competitive markets.
Decision Speed
The manual nature of static reporting slows everything down. Tasks like data consolidation, validation, and versioning eat up valuable time. According to research, 80% of asset managers lose around 30 minutes daily just retrieving investment data [1]. These inefficiencies create bottlenecks that hinder timely decision-making.
"Leadership teams may end up making decisions based on outdated information, potentially missing critical opportunities." - Spencer Vickers, CoreCast Blog [1]
Accuracy in Volatile Markets
Rapid market changes expose another weakness of static reports: they often fail to capture emerging trends. Manual workflows not only slow the process but also introduce human error, which costs U.S. businesses a staggering $3.1 trillion annually. This inefficiency contributes to 75% of projects exceeding budgets by 15% and 77% missing deadlines by an average of 70 days [1].
Customization Flexibility
Static reports typically rely on standardized templates, making it tough to create tailored views for different stakeholders [1][3][4]. This lack of customization can frustrate teams looking for insights specific to their needs, further highlighting the limitations of static reporting.
These challenges set the stage for a shift toward more dynamic, real-time reporting solutions, which will be explored in the next section.
sbb-itb-99d029f
2. Dynamic Reporting with Real-Time Data
Dynamic reporting takes portfolio management to a whole new level by providing immediate, actionable insights. Unlike static reporting, it delivers up-to-the-moment data, transforming how key aspects of portfolio reporting are handled.
Data Freshness
Dynamic reporting integrates live data feeds from sources like MLS platforms, property management systems, and market APIs. Instead of relying on outdated figures, property valuations update in real-time. For example, a property value might shift from $10M to $10.5M immediately after a nearby sale closes on April 11, 2026. This ensures your portfolio reflects the present market environment, not yesterday’s news.
Update Frequency
Real-time systems refresh data every few seconds, eliminating the delays typical of static reports. This enables constant tracking of critical metrics like occupancy rates, rent rolls, and cash flows. According to research, 78% of financial firms leveraging real-time data report 25-50% faster decision-making [2]. Whether it’s a sudden vacancy or a market fluctuation, you’re informed immediately, not weeks later. This instant awareness directly supports quicker decision-making, as discussed below.
Decision Speed
With live dashboards, analysis that used to take days can now be completed in minutes. This allows portfolio managers to respond immediately to changes, like reallocating capital after spotting a 5% drop in occupancy, instead of waiting for the next monthly review.
Accuracy in Volatile Markets
Static reports often lag behind rapidly changing markets, but dynamic systems continuously validate data to maintain accuracy, even during unpredictable times. By using multi-source verification - cross-referencing platforms like Zillow and CoStar - dynamic tools catch discrepancies early. During the volatile 2022 markets, these systems reduced portfolio error rates by 35% compared to static reports [5]. For instance, when interest rates jumped from 4.5% to 5.2% in 2023, real-time systems adjusted cap rates instantly, keeping portfolios aligned with current conditions.
Customization Flexibility
Dynamic platforms offer the ability to customize dashboards on-the-fly, making them far more versatile than static templates. Users can filter by asset type, like multifamily or office properties, or generate stakeholder-specific reports with live IRR calculations based on current NOI. A study revealed that 92% of executives prefer customizable real-time reports for their adaptability in strategic planning [6]. This means investors can view tailored performance summaries while asset managers dive into granular, property-level data - all from the same live data source, updated in real-time.
Pros and Cons
Let’s break this down: static reporting and dynamic reporting each bring their own strengths and challenges to the table. Static reporting offers fixed, unchanging snapshots - perfect for compliance checks, audits, and board meetings. These reports are simple to produce, often relying on basic tools like Excel or PDF generators, which makes them a budget-friendly option, especially for smaller businesses.
Dynamic reporting, on the other hand, focuses on real-time insights, enabling quicker, more tactical decision-making. As Improvado aptly describes it, "Static is for 'what happened,' while dynamic is for 'what is happening now and why'" [7]. This real-time capability is particularly useful in fast-changing markets. However, it comes with a price - maintaining live data streams requires more advanced infrastructure, like business intelligence tools, data warehouses, and integrating third-party tools via APIs.
The choice between these approaches largely hinges on your goals. Static reports are ideal for long-term planning and historical analysis, while dynamic dashboards shine in everyday operations and real-time monitoring. For example, Signal Theory Inc. saw a massive time-saving benefit when they switched to dynamic reporting. Analyst Shayna Tyler shared that this change cut their report preparation time by over 80%, reducing a four-hour process to just about 30 minutes per report [7].
Here’s a quick comparison of the two approaches:
| Aspect | Static Reporting | Dynamic Reporting |
|---|---|---|
| Data Freshness | Point-in-time snapshot | Real-time or near real-time |
| Update Frequency | Manual or periodic | Automatic (continuous refresh) |
| Decision Speed | Supports strategic decisions | Enables immediate tactical decisions |
| Accuracy in Volatile Markets | Can become outdated quickly | Continuously current |
| Report Customization | Rigid; requires full regeneration | Highly customizable with interactive filters |
| Infrastructure Cost | Low initial setup | Higher setup and maintenance costs |
In practice, a hybrid approach often works best. Use static reports for formal presentations and audits, while dynamic dashboards handle real-time tracking and operational needs.
CoreCast: Real-Time Data for Real Estate Portfolio Reports
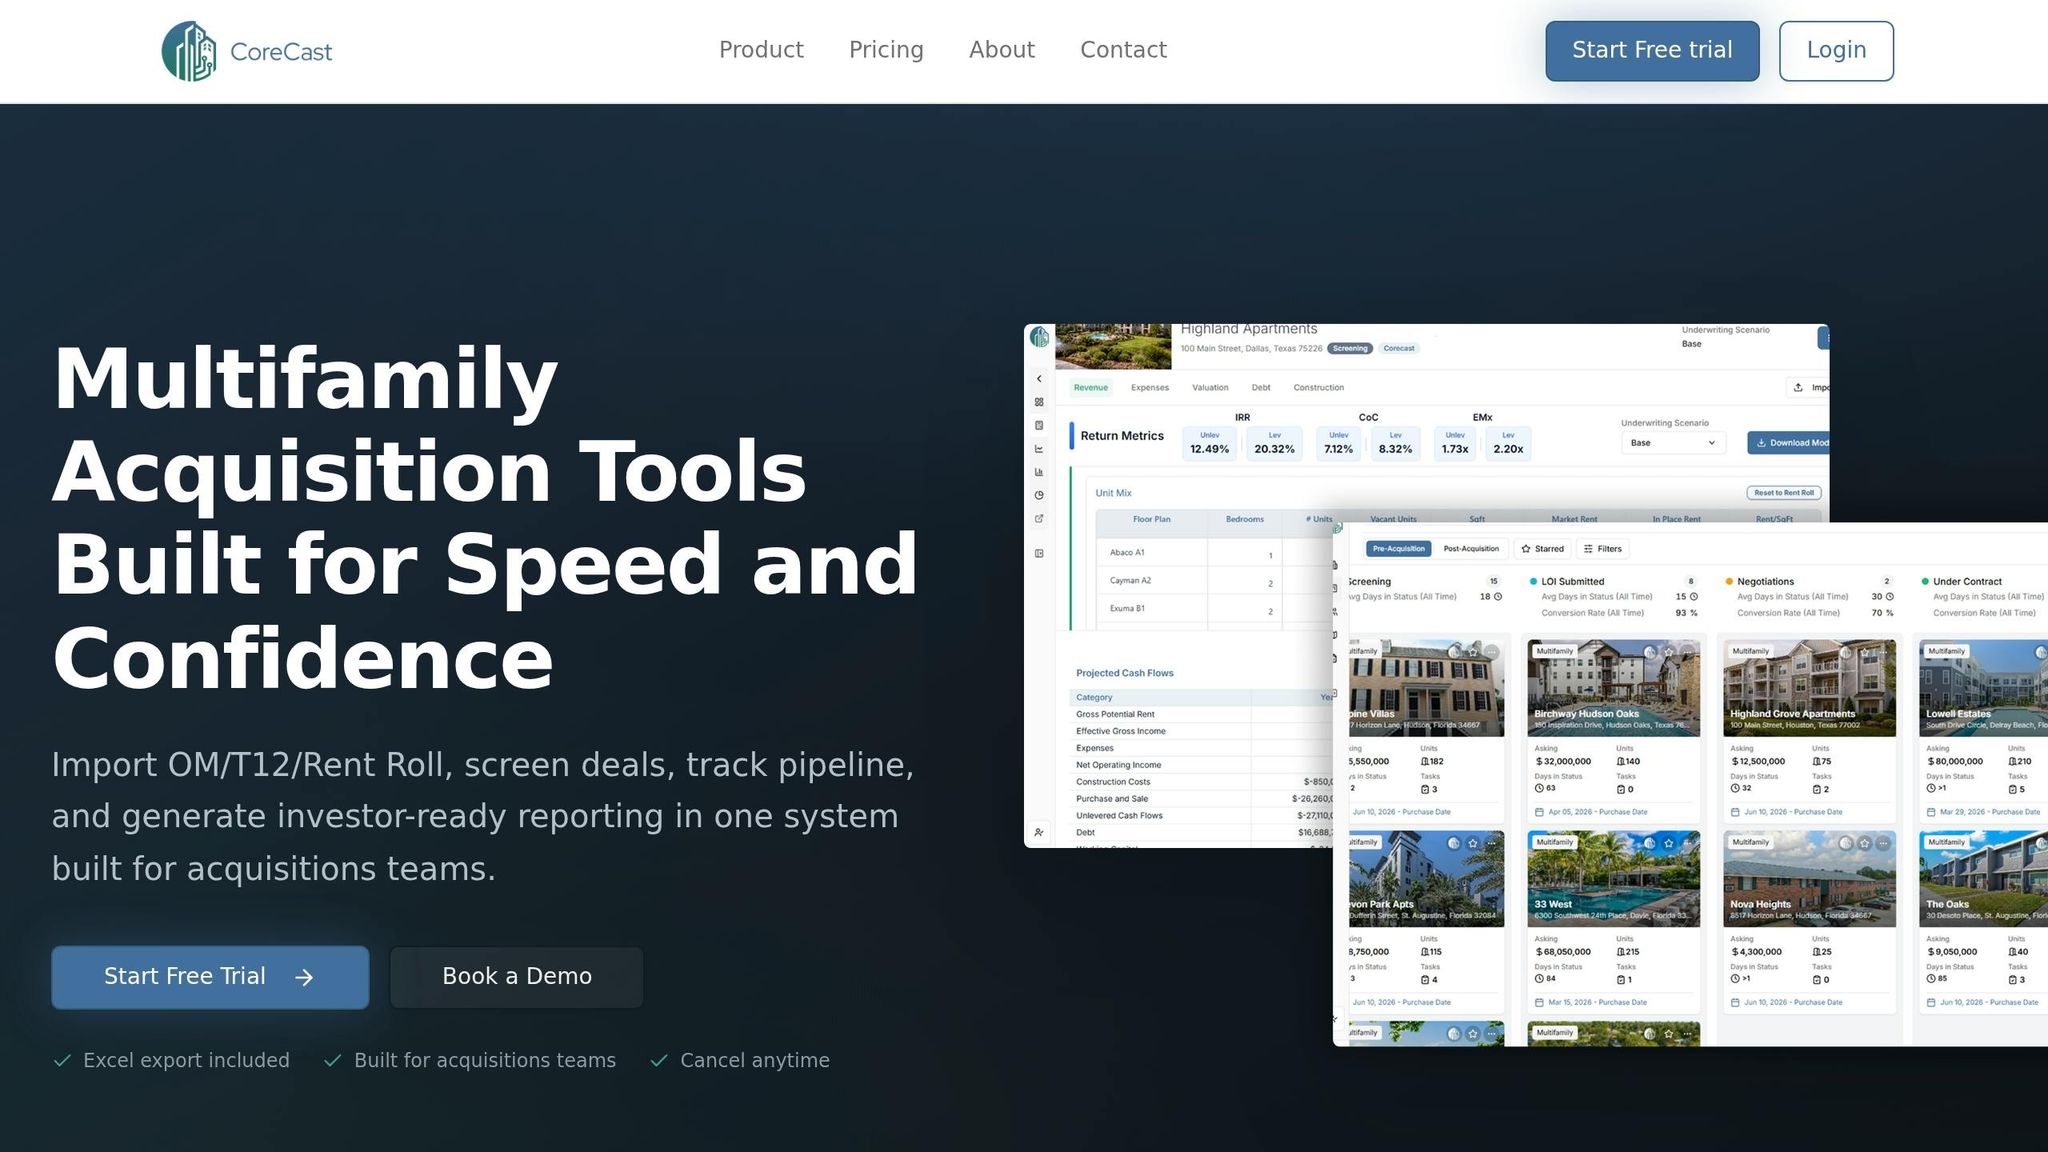
Static reports can become outdated almost as soon as they’re created. CoreCast steps in to solve this problem by providing real-time insights that keep up with the fast-moving real estate market. It builds on the strengths of dynamic reporting, offering a comprehensive, all-in-one solution for real estate intelligence. With CoreCast, tasks like underwriting, pipeline tracking, portfolio analysis, and stakeholder reporting are seamlessly integrated.
The platform is tailored specifically for the real estate ecosystem. By connecting directly to property management systems, accounting software, and market intelligence tools, CoreCast eliminates the need for manual data entry. For instance, when documents like rent rolls or operating statements are uploaded, CoreCast automatically updates financial models and investor dashboards. This not only saves time but also reduces errors and ensures consistency across all reports.
When it comes to portfolio analysis, CoreCast shines by standardizing data from various sources into one reliable system. This "single source of truth" supports valuation models with real-time updates. Live data feeds provide up-to-the-minute information on rent collections, expenses, and loan balances, ensuring that valuation models reflect the actual performance of properties instead of outdated figures.
"CoreCast ensures investors spend more time making decisions and less time formatting spreadsheets" - Spencer Vickers, CoreCast's founder [8]
CoreCast’s stakeholder center takes reporting a step further. It offers customized dashboards for different users: investors receive branded summaries of metrics like IRR and cash-on-cash returns, operators can track essential property performance metrics, and analysts gain access to detailed data with advanced filtering options. And all of this is generated with just one click.
| Feature | Static Reporting | CoreCast Real-Time Reporting |
|---|---|---|
| Data Collection | Manual, periodic, and slow | Automated, continuous, and synchronized |
| Accuracy | Prone to human entry errors | High; includes automated validation |
| Scalability | Difficult; requires more staff | Effortless; handles hundreds of assets |
| Integration | Disconnected tools and workflows | Unified platform with seamless API connections |
| Stakeholder Reporting | Generic templates, manual distribution | Role-specific dashboards with automated scheduling |
Conclusion
Real-time data is transforming how real estate professionals handle portfolio reporting. Moving away from static spreadsheets to interactive dashboards eliminates delays and reduces errors, allowing decisions to be driven by up-to-date performance metrics instead of outdated data. To put it into perspective, manual data entry errors cost U.S. businesses a staggering $3.1 trillion each year, while automating asset management processes can cut asset-related operational costs by up to 30% [1].
The benefits of this shift are undeniable, paving the way for integrated solutions. CoreCast tackles these challenges head-on by centralizing the entire investment lifecycle into a single platform. Whether it’s underwriting or stakeholder reporting, the platform ensures consistent and reliable data at every stage. For professionals juggling multiple assets, consolidating data sources, implementing standardized reporting templates for key metrics like NOI and DSCR, and replacing static PDFs with interactive dashboards saves time while fostering greater transparency with investors and partners.
FAQs
What counts as “real-time” data in portfolio reporting?
"Real-time" data in portfolio reporting means having access to constantly updated metrics. This includes key figures like occupancy rates, rent growth, lease expirations, and market trends. Because the data updates continuously, it offers instant insights, allowing users to make quicker and better-informed decisions.
Which metrics benefit most from real-time dashboards?
Real-time dashboards are game-changers when it comes to tracking metrics like occupancy rates, lease expirations, market trends, ROI, and operational costs. They provide instant insights, allowing for quick analysis and proactive management. This means you can make faster, more informed decisions to keep up with an ever-evolving market.
What does it take to implement real-time reporting in my portfolio?
Implementing real-time reporting means bringing live data sources into a single platform to analyze metrics like occupancy rates or rent growth. By automating data collection, you can minimize errors and make reporting faster. Dashboards are essential - they provide instant access to critical insights at a glance. To keep everything secure, use role-based access controls to manage who can view or edit data. Tools like CoreCast make this process easier by offering an all-in-one solution for streamlined portfolio reporting.