
How to Use Data for Smarter Investment Decisions

Data is transforming real estate investment, helping you move beyond intuition to make informed decisions. With rising interest rates and economic uncertainty, leveraging analytics can uncover trends, predict property values with up to 85% accuracy, and streamline processes that used to take hours. Here's a quick breakdown of how to use data effectively:
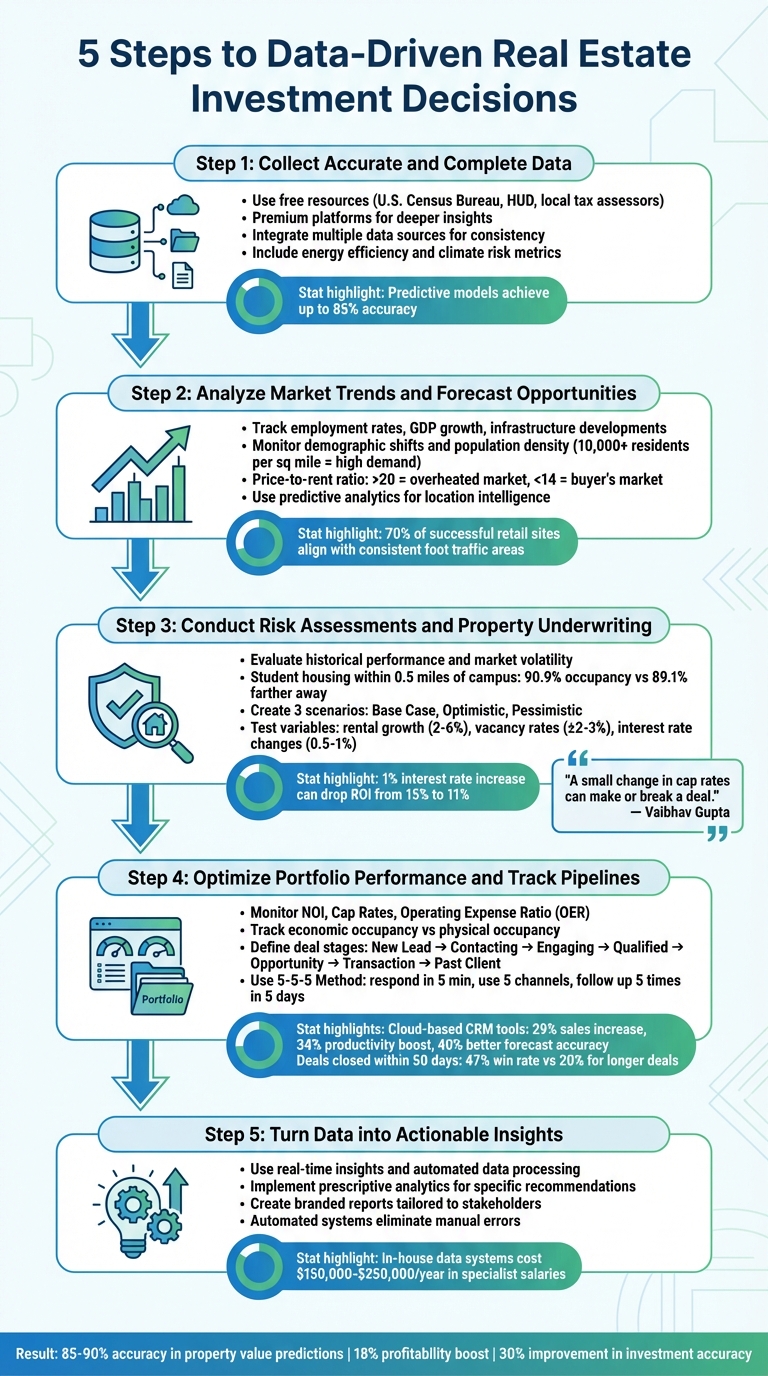
- Start with Accurate Data: Use free resources like the U.S. Census Bureau or premium platforms for deeper insights. Integrate data from multiple sources to ensure consistency.
- Analyze Market Trends: Track macroeconomic indicators like employment rates, infrastructure developments, and demographic shifts. Tools like predictive analytics can identify emerging opportunities.
- Assess Risks: Study historical performance and conduct scenario modeling to prepare for varying market conditions.
- Monitor Portfolio Performance: Use metrics like Net Operating Income (NOI) and Cap Rates to evaluate assets. Automated tools can flag underperforming properties.
- Act on Insights: Automate data processing and use prescriptive analytics to make faster, data-backed decisions.
Platforms like CoreCast simplify the process by combining data collection, analysis, and reporting into one system, saving time and reducing errors. By following a structured, data-driven approach, you can improve investment accuracy and stay ahead in a competitive market.
5-Step Data-Driven Real Estate Investment Framework
Step 1: Collect Accurate and Complete Data
Identify Key Data Sources
Making smart investment choices starts with gathering the right data. Key factors like market trends, forecasting property values, demographic changes, and economic indicators all contribute to a well-rounded investment strategy.
Not all valuable data comes with a price tag. Free resources like the U.S. Census Bureau provide detailed demographic insights, HUD offers affordability statistics, and local tax assessors share property valuation histories. These tools can be incredibly useful [2][6]. For those needing more in-depth analysis, premium services provide expansive datasets, though they can be expensive [2][5]. Many investors also leverage their own deal pipelines, including failed transactions, to build unique benchmarks and datasets [5].
Consider newer data categories as well. Metrics like energy efficiency ratings and climate risk assessments are becoming essential for long-term planning [2]. For commercial properties, real-time foot traffic data can reveal peak visitor times and consumer behavior, offering insights to enhance property management [7].
Ensuring data accuracy across multiple sources requires standardization and integration.
Use Integrated Platforms for Data Collection
Data from different sources often comes in varying formats - like per-square-foot pricing versus total costs - or uses inconsistent classifications for asset types.
Integrated platforms solve these issues by standardizing formats, allowing for accurate comparisons across markets and asset classes [5]. Tools like CoreCast streamline data collection for all major commercial real estate categories, removing the hassle of switching between spreadsheets and disconnected systems. These platforms automate data ingestion, include validation checks, and maintain audit trails, ensuring high-quality inputs. This level of organization can support predictive models with accuracy rates as high as 85% [7].
sbb-itb-99d029f
Step 2: Analyze Market Trends and Forecast Opportunities
Understand Macroeconomic Indicators
After gathering your data, the next step is figuring out how it impacts your investment strategy. Indicators like employment rates and GDP growth often point to strong housing demand and increasing property values. For instance, a growing local job market usually leads to higher occupancy rates and rising rents.
Pay attention to infrastructure developments - they’re often early signals of value shifts. New subway lines, highway expansions, or major transit projects can cause property values to climb, sometimes well before the majority of buyers catch on. Keeping an eye on local development portals and building permits can help you anticipate changes in supply and potential pricing pressures.
Demographic trends are equally important. Population growth, migration patterns, and changes in household structures all shape long-term demand. For example, student housing near universities often achieves occupancy rates above 90% [7]. High-demand areas also tend to have population densities above 10,000 residents per square mile [7].
Another critical metric is the price-to-rent ratio. A ratio of 20 or higher suggests renting is more cost-effective than buying, which could indicate an overheated market. On the flip side, ratios under 14 suggest a strong buyer’s market where owning a home is more affordable than renting.
Use Predictive Analytics for Location Intelligence
Building on these macroeconomic insights, predictive analytics can help you turn historical data into actionable forecasts. By combining macro trends with machine learning, these tools identify up-and-coming markets before they gain mainstream attention. Some models can predict property values and rental yields with up to 85% accuracy [7]. For retail investments, over 70% of successful sites align with areas showing consistent foot traffic [7].
Hyperlocal analysis is now more critical than ever, as neighborhoods often deviate from broader city trends. Even if a city’s market weakens, certain neighborhoods can experience revitalization. Geospatial analytics allow investors to overlay property values with factors like local infrastructure, crime rates, and transit access. Platforms like CoreCast simplify this by displaying properties alongside competitive landscapes on a single map, making acquisition benchmarking more efficient.
Don’t overlook non-traditional data sources for spotting early trends. For example, Google Trends can reveal rising interest in phrases like "homes for sale in [city]" before official sales data catches up. For commercial properties, location analytics that track peak visitation times and shopping behaviors can ensure the right tenant-market fit. Additionally, the rise of remote work has shifted demand from urban centers to suburban markets - a trend you can detect by analyzing job posting data and commuting patterns.
Step 3: Conduct Risk Assessments and Property Underwriting
Evaluate Historical Performance and Market Volatility
After analyzing broader market trends, it's time to dive into the specific risks tied to individual properties. Historical transaction data is a goldmine for spotting pricing trends and understanding market cycles. It can help you avoid overpaying, especially during market peaks, by revealing how properties performed during both economic downturns and periods of rapid growth.
Rental history is another critical piece of the puzzle. By studying occupancy rates, rental yields, and maintenance costs from similar properties, you can set realistic expectations for cash flow stability using a real estate ROI calculator. For instance, student housing located within a half-mile of university campuses typically achieves a 90.9% occupancy rate, compared to 89.1% for properties farther away [7]. Reviewing failed deals in your pipeline can also uncover recurring issues, helping you refine your underwriting process. Beyond individual properties, factors like market volatility, natural disaster risks, and economic stability can be analyzed to produce objective risk scores. This replaces gut-based decisions with data-driven insights, laying the groundwork for thorough scenario modeling.
Test Scenarios for Risk Mitigation
Scenario modeling is an essential step in managing risks effectively. Start by creating three core scenarios: a Base Case (most likely outcome), an Optimistic Case (favorable conditions), and a Pessimistic Case (challenging market) [16,17]. For example, a sensitivity analysis by Coldwell Banker Horizon Realty in March 2025 on a $1,000,000 multifamily property revealed how financing terms can drastically affect ROI. A one-point increase in interest rates - from 5% to 6% - lowered ROI from 15% to 11%, while a one-point decrease raised it to 19% according to our commercial property ROI estimator.
"A small change in cap rates can make or break a deal." - Vaibhav Gupta, Bonfire Capital [9]
To ensure your models are realistic, adjust variables incrementally. For rental growth, test rates between 2% and 6%. Adjust vacancy rates by ±2–3% from your baseline. Simulate exit cap rate changes of 0.25% to 0.5%, and model interest rate hikes in increments of 0.5% to 1%. Your Debt Service Coverage Ratio (DSCR) should remain above 1.25 even in your most challenging scenarios [9].
Using integrated analytics tools can make this process more efficient. Platforms like CoreCast allow you to underwrite various asset classes and risk profiles while comparing multiple scenarios side-by-side. Testing "what-if" scenarios - like the closure of a major local employer or a sudden spike in construction costs - helps you prepare data-driven contingency plans before committing capital [8].
Step 4: Optimize Portfolio Performance and Track Pipelines
Diversify Your Portfolio and Monitor Performance
Once you've underwritten your properties, it's time to manage your portfolio as a cohesive system. Today, the industry leans heavily on data-driven methods to track key metrics across all assets [10]. Metrics like Net Operating Income (NOI), Cap Rates, and the Operating Expense Ratio (OER) should be monitored regularly. This allows you to measure each property's performance against industry standards and your portfolio's overall averages.
A property's economic occupancy is more telling than its physical occupancy. For example, a property might appear healthy with 95% of its units filled, but if tenant delinquencies or rent concessions are high, the actual rent collected could be far less than expected [16]. Modern portfolio analysis platforms can help by identifying discrepancies between your NOI projections and actual results. This makes it easier to spot properties that might need operational tweaks or capital reallocation.
Automated alerts can flag issues before they escalate, while tools like heat maps make it easy to visualize performance variations across your portfolio. If certain regions or property types consistently fall short, data insights can guide your decisions on reallocating resources to better-performing assets. Platforms like CoreCast simplify this process by centralizing portfolio comparisons across asset classes, giving you a unified view and helping you make informed decisions.
Streamlining performance across your portfolio builds a strong foundation for managing your deal pipeline effectively.
Track Pipeline Through Deal Stages
Managing your current assets is only half the battle. Keeping an efficient pipeline for new deals is just as crucial. Real estate professionals using cloud-based CRM tools report impressive gains: a 29% increase in sales, a 34% boost in productivity, and a 40% improvement in forecast accuracy [11]. To stay organized, define clear deal stages such as New Lead, Contacting, Engaging, Qualified, Opportunity, Transaction, and Past Client [11][15]. Transitioning from manual spreadsheets to a cloud-based platform ensures real-time updates and eliminates the data silos that can slow down your decision-making [12][14].
"Getting leads as a source of business is one thing, but how you track and manage those leads is crucial and a major part of being a real estate agent." - Will Featherstone, Founder, Featherstone & Co. [13]
Implement lead scoring to categorize prospects as "Hot", "Warm", or "Cold" based on factors like budget, authority, need, and timing. The speed of closing deals also matters - opportunities closed within 50 days have a 47% win rate, while deals that drag on longer see that rate drop to just 20% [15]. To maximize success, try the 5-5-5 Method for new leads: respond within 5 minutes, reach out using 5 different channels (calls, texts, emails), and follow up 5 times within the first 5 days [11].
Tools like CoreCast's pipeline tracker let you monitor deals through every stage, compare pipeline opportunities to your portfolio's performance metrics, and analyze "dead deals" to spot recurring issues. Regularly cleaning your pipeline - removing inactive opportunities that haven't engaged in months - keeps your forecasts accurate and ensures your team focuses on high-value prospects [15].
Step 5: Turn Data into Actionable Insights
Use Real-Time Insights for Decision-Making
Data only becomes powerful when it drives action. Yet, only a small percentage of businesses currently utilize real-time business intelligence and analytics, leaving a significant gap for those who can act quickly and decisively [1]. This creates a competitive edge for professionals who can process and respond to data efficiently.
Automated data processing has transformed this landscape. Advanced data mining tools can scan thousands of listings in just minutes, identifying properties based on location, type, rent range, and other key criteria [17]. By automating these processes, you can skip the tedious spreadsheet work and focus on identifying high-value opportunities. Predictive models further enhance accuracy [7], giving you confidence in your projections and strengthening your investment strategy.
The rise of prescriptive analytics takes things a step further. These platforms don’t just forecast outcomes - they recommend specific actions. For instance, they can suggest the best renovation budgets, ideal times to list properties, or zip codes with the highest rent growth for two-bedroom units over the past two years [19]. To avoid getting overwhelmed by data, start by framing your goals as clear, specific questions. This approach keeps your analysis sharp and actionable [19].
CoreCast integrates these capabilities seamlessly. It combines deal pipelines, underwriting tools, and real-time market tracking into one system. With features like an integrated map, advanced portfolio growth planning, and access to historical data, you can evaluate properties and market trends without juggling multiple platforms. Standardized data ingestion ensures properties are compared consistently, making it easier to identify patterns and opportunities [5]. Once you’ve extracted insights, the next step is presenting them effectively.
Create Branded Reports for Stakeholders
Turning insights into clear, tailored reports is just as important as gathering the data itself. Whether it’s risk assessments or pipeline updates, effective communication builds trust and confidence among stakeholders. Different audiences care about different metrics. For example:
- Institutional investors focus on IRR, NPV, and cash-on-cash returns.
- Lenders prioritize rent rolls and debt service coverage ratios.
- Private equity firms look for dashboards that highlight value-add strategies and pipeline performance.
- Individual investors often prefer summaries that emphasize cash flow projections and occupancy rates.
Automated reporting systems can streamline this process by eliminating the manual spreadsheet errors and delays that often plague traditional reporting methods [5]. These systems generate consistent, accurate updates, ensuring stakeholders always have reliable information. When tagging property attributes, be specific. For example, instead of using vague terms like "Fair condition", opt for detailed descriptions such as "Overgrown Shrubbery" or "Cracked Sidewalks" [18]. This level of precision helps stakeholders better understand the data.
With CoreCast's stakeholder center, you can create branded, professional-grade reports and send them directly to your audience - all within the same platform you use to manage your pipeline and portfolio. These reports are always based on the latest data, and you can even track how stakeholders interact with them. Building a custom data system in-house often requires hiring specialists skilled in programming languages like Python or R, with salaries ranging from $150,000 to $250,000 per year [1]. Using an all-in-one platform eliminates those costs while delivering high-quality reporting tools.
The Data Driven Investor's Guide to Real Estate Course | Section 1
Conclusion
Making informed real estate investment decisions means transforming raw data into actionable insights. The five steps covered here - gathering reliable data, analyzing market trends, assessing risks, enhancing portfolio performance, and applying insights - offer a structured approach. This framework replaces guesswork with precision, which is especially important in today’s market of tighter margins and rising interest rates, where intuition isn’t enough [20].
Predictive models now estimate property values and rental yields with accuracy rates of 85–90% [7][20], and machine-learning tools can predict apartment rents with over 90% accuracy [20]. For example, in 2023, Metro Realty Group in Dallas adopted real-time data analysis tools, leading to an 18% boost in profitability and a 30% improvement in investment accuracy [3]. As BiggerPockets aptly put it:
"Data alone will never be the answer... But you must have a data set that you trust and believe in order to make high-quality real estate decisions" [4].
CoreCast simplifies this entire process with its all-in-one platform. Instead of managing multiple tools and spreadsheets, users can underwrite assets, monitor deal pipelines, analyze portfolios, and create branded reports - all in one system. With features like integrated mapping, real-time market insights, and automated reporting, CoreCast streamlines operations by combining essential tools into a single, efficient platform. This approach aligns perfectly with the step-by-step strategy outlined above.
FAQs
What data should I trust most for underwriting a deal?
When evaluating a deal, the most dependable data comes from verified, real-time market metrics. Key elements include net operating income, cap rates, occupancy rates, tenant retention, property transaction records, local market trends, economic indicators, and predictive analytics. Together, these data points provide a solid foundation for making well-informed decisions.
How do I spot a “hot” neighborhood before prices jump?
Identifying a "hot" neighborhood involves digging into critical data trends. Look for signs like rising property values, growing rental demand, low vacancy rates, and new infrastructure projects. Tools such as heat maps and platforms that compile transaction histories, demographic shifts, and market trends can provide a clearer picture of areas on the rise.
But don’t stop there - local knowledge is just as important. Keeping an eye on public planning meetings and noticing changes in demographics can reveal neighborhoods with strong growth potential before prices climb. Combining data with on-the-ground insights is the key to spotting the next big opportunity.
What scenarios should I model before making an offer?
Before placing an offer, take time to evaluate key scenarios such as how the property’s value might increase, potential rental income, expected occupancy rates, current market trends, and possible risks. Analyzing these factors can provide a clearer picture and help you make decisions that align with your investment goals.