
How Demographics Shape Multifamily Rent Growth
- Demographic shifts are driving rental demand: Young adults (25-34) living with family (17.6%) and aging baby boomers transitioning to rentals are key factors shaping the market.
- Affordability challenges persist: With starter home payments averaging $3,544 in 2025 (93% higher than rent), more people are staying renters longer.
- Migration trends are evolving: Sun Belt cities are cooling off, while secondary markets like Lakeland, Killeen, and Colorado Springs are gaining traction.
- Rent growth is slowing: National rent growth was just 1.1% in 2025 and is projected to slow further to 0.5% in 2026.
- Income gaps limit rent increases: Stagnant wages and rising housing costs are straining renters, especially in workforce housing.
Bottom Line: Demographic trends - age, income, and migration - are reshaping rental demand and rent growth. Investors should focus on markets with strong demand from younger and older renters, while considering affordability constraints and regional migration patterns.
Key Demographics Shaping Multifamily Rent Growth in 2025-2026
This Is Bad For Multifamily Real Estate
sbb-itb-99d029f
Age and Household Formation Trends
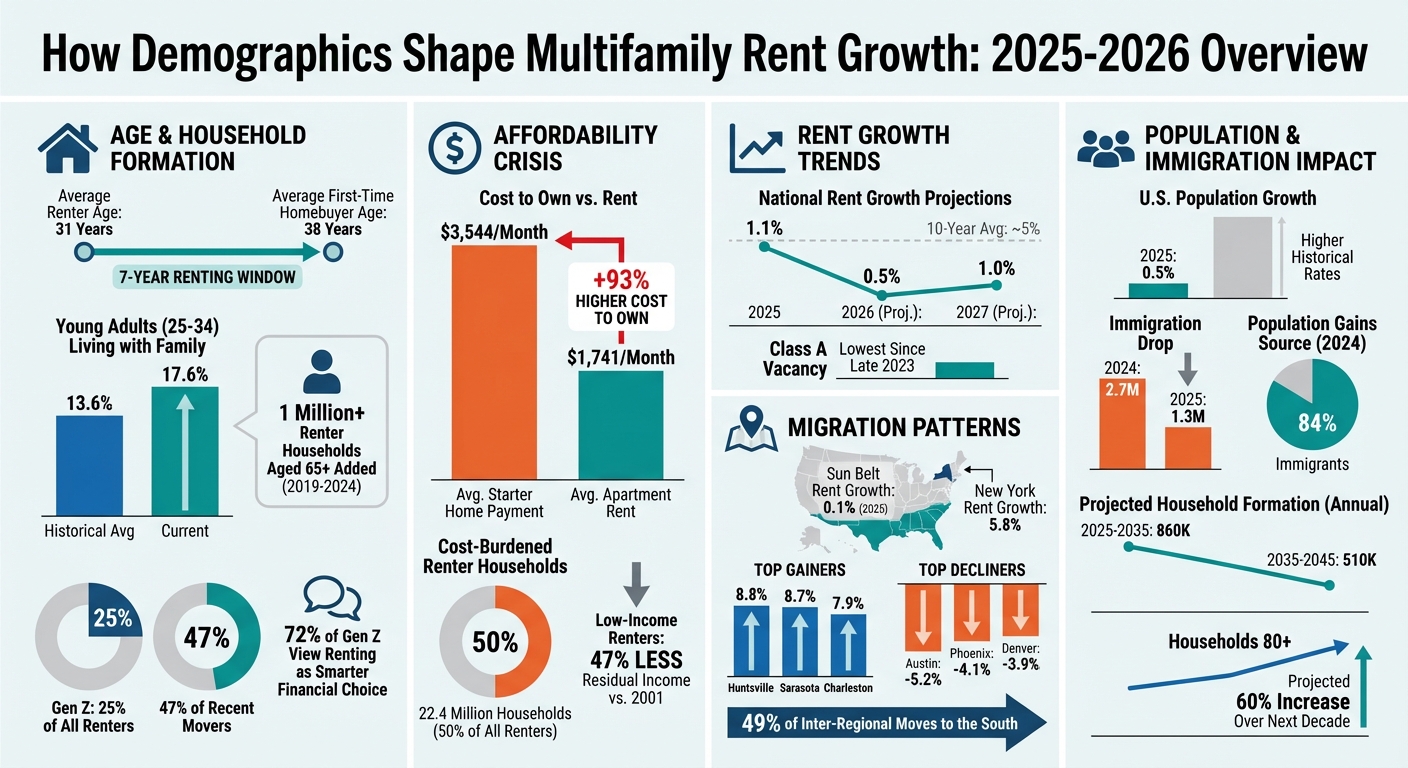
The average age of renters is now 31, compared to 38 for first-time homebuyers, leaving a seven-year window where renting is the norm [8]. This change is tied to shifts in major life milestones like marriage, living independently, and starting families. Since 1990, the average age for marriage has climbed by over four years [9]. These delays aren’t just about lifestyle preferences - they’re also driven by financial hurdles like higher debt, inflation, and rising homeownership costs. As a result, younger adults are staying in rentals longer than in past decades [7].
At the same time, older adults are renting in record numbers. Between 2019 and 2024, the number of renter households led by individuals aged 65 and older grew by over 1 million [9]. This trend is expected to continue as baby boomers age. By 2026, the oldest boomers will reach their 80s, a stage when homeownership rates drop significantly - from 75% at age 75 to just 53% by age 90 [3]. Together, these trends are creating a surge in rental demand from both younger and older generations, shaping new rental patterns for Millennials, Gen Z, and older adults.
Millennials and Gen Z Rental Patterns
While Millennials have been the dominant force in the rental market for years, their influence is waning as many transition to homeownership [6]. Gen Z is stepping in to fill the gap, now making up 25% of all renters and nearly half (47%) of recent movers [7]. With a population of 66.1 million people aged 13 to 27, Gen Z is 2.1 million larger than Millennials were at the same age 15 years ago [6].
Gen Z’s renting habits stand out. A significant 72% of Gen Z adults view renting as a smarter financial choice than owning a home, and 85% are renting [9]. They’re drawn to rentals not just out of necessity but for the flexibility, convenience, and access to walkable neighborhoods with modern amenities. However, affordability is a major obstacle - three in five Gen Z renters are considered rent-burdened, spending over 30% of their income on rent [7]. Despite these challenges, their extended rental periods are fueling strong demand. In 2025, the multifamily sector absorbed roughly 355,000 units - the third-highest annual absorption in 25 years [4].
Developers are responding to this demand with projects tailored to Gen Z preferences. Examples include a $50 million urban infill project in Des Moines and a mixed-use development in Ann Arbor [9]. These complexes often feature sustainable designs, high-speed internet, coworking spaces, and social amenities, reflecting the values and lifestyle priorities of this generation.
Baby Boomers Downsizing to Rentals
As younger generations navigate their rental journeys, baby boomers are increasingly moving away from homeownership. Many are leaving single-family homes for luxury multifamily rentals or build-to-rent communities, drawn to the appeal of a low-maintenance lifestyle. David Hovey, President of Optima, highlighted this trend:
renting has become an increasingly popular option for active seniors who aren't interested in age-restricted housing but seek a maintenance-free lifestyle in an accessible building
[9]. These renters often gravitate toward walkable neighborhoods with easy access to public transportation, services, and social opportunities.
Interestingly, boomers and Gen Z frequently share multifamily spaces due to overlapping lifestyle needs. Mary Cook, President of Mary Cook Associates, noted:
Boomers and Gen Z actually cohabitate pretty well because you don't have the kid factor
[9]. With both groups typically living without young children, developers are designing properties with amenities that appeal to a broad audience - such as fitness centers, social lounges, and pet-friendly areas. This intergenerational demand has contributed to strong occupancy rates in Class A properties, where vacancy rates hit their lowest levels since late 2023. Many affluent renters, including downsizing boomers, are opting for high-quality, modern units [4].
However, meeting future demand remains a challenge. The senior housing market faces a significant shortfall, with an estimated 560,000 new units needed by 2030 but only about 191,000 projected to be delivered. This leaves a gap of 369,000 units [11]. As the oldest boomers reach 80 in 2026 - a time when rental transitions often accelerate - demand for luxury multifamily and age-in-place housing is expected to rise sharply. Investors who can provide accessible, low-maintenance housing options stand to benefit from this growing demographic trend. These shifting age dynamics are shaping rental market demand and influencing rent growth in multifamily housing.
Income Levels and Affordability Constraints
Income levels are a major factor in how much rent growth a market can handle. By January 2026, national advertised rents averaged $1,741, but the year-over-year growth had slowed to just 1.1% - one of the weakest rates since the pandemic [4][5]. This slowdown highlights a long-standing issue: for over 20 years, rents have grown faster than incomes. As a result, low-income renters now have 47% less residual income compared to 2001 [12]. These widening gaps between income and rent point to deeper affordability issues across the country.
The affordability crisis has reached alarming levels. In 2022, there were 22.4 million cost-burdened renter households - those spending more than 30% of their income on rent. That’s about half of all U.S. renters [12]. For households earning under $30,000 annually, the financial strain is even more severe, leaving just $310 per month after rent and utilities [12]. This tight financial margin limits how much landlords can increase rents, especially in workforce housing, where tenants have little flexibility to absorb higher costs. Investors can use a real estate deal analysis tool to model these constraints and ensure long-term profitability.
Geographic income differences further complicate the picture, making it essential to compare commercial real estate markets to understand localized performance. High-cost coastal areas like Manhattan face intense affordability pressures despite limited new housing supply. Meanwhile, more affordable Midwest cities like Kansas City and Chicago have shown moderate rent growth, ranging from 2.6% to 3.6%, thanks to their lower costs and restricted new construction [13].
Luxury vs. Affordable Rental Markets
Manhattan’s luxury rental market is booming. The median rent for the top 10% of units reached $11,500, with a 17.9% annual increase, while the overall median climbed to a record $4,750 [14]. Housing analyst Jonathan Miller noted:
rental prices have been outpacing inflation for the past decade, placing relentless economic pressure on consumers
[14].
This luxury surge contrasts sharply with the affordable housing market, which is shrinking rapidly. Since 2012, the U.S. has lost 2.1 million units renting for less than $600 and 4 million units priced between $600 and $999. At the same time, it has gained 8.4 million units renting for $1,400 or more [12]. Adding to the challenge, around 900,000 income-restricted apartments are set to lose their affordability protections by 2033 [15].
A surprising shift occurred in late 2025: renters began moving from Class B and C properties to Class A luxury units. New high-end apartment developments offered aggressive concessions to fill vacancies, leading to a drop in Class A vacancy rates to their lowest since late 2023. Meanwhile, occupancy rates softened in Class B and C properties as renters took advantage of smaller price differences between the classes [4].
How Income Gaps Affect Rent Pricing
Income disparities play a direct role in shaping rent pricing strategies. As Yardi Matrix explained:
It may be difficult to achieve gains in overall advertised rents if the people renting workforce apartments don't have steadily increasing incomes
[5]. Stagnant wages mean landlords catering to necessity-based renters face greater economic challenges [5].
Regional income gaps also create uneven rent performance across the country. In December 2025, New York led with 5.8% annual rent growth, while Sun Belt markets like Austin and Phoenix saw declines of 5.2% and 4.1%, respectively [13]. These drops reflect not just oversupply but also the limits of stagnant incomes in supporting higher rents. As a result, more renters are leaving expensive cities for secondary markets where their money stretches further [10][13]. This affordability-driven migration is reshaping tenant demographics and reinforcing rent growth trends.
The gap between renting and owning further underscores how income levels influence the rental market. Average mortgage payments have more than doubled since early 2020, while rents have risen by about 22% [15]. This widening gap keeps higher-income households in rentals longer, increasing competition with lower-income renters. Meanwhile, the median age for first-time homebuyers hit a record 38 years old in 2024, with first-time buyers making up just 24% of transactions - the lowest share since 1981 [15]. With homeownership becoming less attainable, income levels remain a key factor in determining which rental markets can grow and which will stagnate.
Migration Patterns and Regional Rent Differences
Where people choose to live plays a big role in shaping the rental market. In 2023, the South emerged as the top destination for inter-regional relocations, accounting for 49% of all moves - up from 45% in 2021. On the flip side, the Midwest sent out the most residents, making up 35% of these outflows [2]. However, the impact of these moves isn’t just about where people are going; local housing supply also plays a key part in determining how rents shift, often requiring predictive analytics for multifamily properties to forecast these changes.
Take the Sun Belt, for example. While it continues to attract new residents, rent growth in the region was almost flat at just 0.1% in 2025. This slowdown can be traced back to an influx of new apartment constructions that flooded the market [4]. Joseph Lee, Chief Data Scientist at Forty5Park, explained it this way:
As pandemic-driven relocation cools, the Sunbelt can no longer coast on cheap rents alone, and markets that fail to build enduring value will be left behind [2].
Population Shifts to Sun Belt and Secondary Markets
The rise of remote work is reshaping where Americans are choosing to settle. Workers in industries like tech, finance, and information are spending an average of 1.9 to 2.2 days per week working remotely [1]. This flexibility has led to a surge in migration to more affordable areas. In fact, projections suggest that 82% of U.S. population growth over the next three decades will happen in the South and West [11]. Smaller, secondary markets are also gaining traction. For instance, people are moving from Austin to nearby cities like San Antonio and Killeen, or from Denver to Greeley and Colorado Springs. In California, the Bay Area is losing residents to places like Sacramento and Stockton [1].
In 2025, cities such as Huntsville, Sarasota, and Charleston saw the highest demand increases, with growth rates of 8.8%, 8.7%, and 7.9%, respectively [4]. However, not all areas in the South fared well. Tampa, for example, experienced a population dip in mid-2025 due to concerns over flooding and hurricanes [1]. Meanwhile, cities like Boise and Charleston benefited from a slowdown in construction, which helped balance supply and demand. Boise, in particular, saw a significant drop in vacancy rates - down 350 basis points in 2025 [4]. While many regions are thriving due to incoming populations, high-cost cities are dealing with a different set of challenges.
Outmigration from High-Cost Cities
Coastal cities with high living costs have been losing residents in large numbers. Between April 2020 and July 2024, New York saw the biggest population decline in the country, losing 336,524 residents (1.7%) due to outmigration [18]. The financial strain is clear: in 2025, the average monthly payment for a starter home soared to $3,544 - 93% higher than the average apartment rent [1].
Despite these losses, some coastal markets have shown surprising resilience. San Francisco, for instance, saw asking rents rise by 7.5% year-over-year in 2025, driven by investments in AI-related industries [4]. Similarly, New York experienced a 5.8% annual rent growth by December 2025 [13]. In contrast, oversupplied markets in the Sun Belt faced rent declines, with Austin, Phoenix, and Denver seeing drops of 5.2%, 4.1%, and 3.9%, respectively [13].
Meanwhile, cities in the Midwest, such as Minneapolis, Milwaukee, and Kansas City, maintained steady rent growth ranging from 1.4% to 2.0% in 2025. These markets benefited from their affordability and limited new housing supply [17].
Population Growth, Immigration, and Future Demand
By 2025, U.S. population growth had slowed significantly, dropping to 0.5%. The number of new residents decreased from 3.2 million in 2024 to just 1.8 million in 2025 [16][20]. This decline stems from historically low birth rates and a sharp reduction in international migration, which fell from 2.7 million in 2024 to 1.3 million in 2025 [16]. These changes have created a "growth gap", reducing the formation of new rental households.
The effects on the multifamily housing market are already apparent. National rent growth in 2025 slowed to just 1.1% year-over-year, a stark contrast to the 10-year average of around 5% [4]. Projections for the next few years suggest more of the same: asking rents are expected to grow by only 0.5% in 2026 and 1% in 2027 [5]. Over the long term, household formation is anticipated to decline further - from 860,000 annually between 2025 and 2035 to just 510,000 annually between 2035 and 2045 [19]. This shrinking pool of potential renters is reinforcing the sluggish rent increases seen in the market. Ken Johnson, a Housing Economist at the University of Mississippi, highlighted the potential consequences:
"If we get in this pattern for two or three years, you're going to see pretty significant downward pressure on home prices and rents." [16]
These demographic shifts, particularly in immigration and birth rates, are expected to continue shaping the future of rental demand.
Lower Immigration and Rental Demand
Immigration has long been a cornerstone of U.S. population growth and, by extension, rental demand. In 2024, immigrants accounted for 84% of the country’s total population gains [21]. Certain states - Florida, California, Texas, New York, and New Jersey - absorbed half of all net immigration between 2021 and 2024, putting immediate pressure on rental markets in these areas [3].
Tracy Hadden Loh, a Fellow at the Brookings Institution, emphasized the stabilizing role of immigrants in housing markets:
"Many of the areas that have historically lost population or are not growing actually have housing surpluses, and immigrants have been a key force in stabilizing those housing markets." [16]
However, mass deportations in 2025, which removed over 500,000 individuals, have disrupted this dynamic. Markets with large immigrant populations have had to adjust their demand projections using the best real estate analytics tools [16]. The issue isn’t just about tenants - construction labor shortages are also a growing concern, as 30% of the national construction workforce is foreign-born [21]. This dual challenge is squeezing rental demand while also limiting the labor needed to build new housing units.
Birth Rates and Household Formation Outlook
Falling birth rates are another factor reshaping the rental market’s future. Between 2025 and 2035, the number of households is expected to grow by 8.6 million - down from the 10.1 million increase seen during the 2010s. Under a low-immigration scenario, this figure could plummet further, with household growth potentially dropping to just 320,000 per year between 2035 and 2045 [19].
Delayed household formation among young adults offers a possible buffer. Currently, 17.6% of young adults aged 25 to 34 live with parents or grandparents, compared to a historical average of 13.6% [1]. This trend suggests a "reserve" of future renters who could eventually transition to independent living. Eric Finnigan, Vice President of Demographics Research at John Burns Research and Consulting, explained:
"Young adults are more likely to be living with their parents than renting an apartment than in the past... we're also seeing a growing reserve of future renters waiting to move out." [1]
At the same time, the aging population is becoming a significant driver of rental demand. Over the next decade, the number of households headed by individuals aged 80 or older is projected to rise by nearly 60%, adding around 6 million households [19]. As homeownership rates decline from 75% at age 75 to just 53% by age 90 [3], more older adults are expected to transition from owning homes to renting, further influencing the rental market.
Using CoreCast for Demographic Analysis

Understanding how demographic changes affect multifamily rent growth takes more than just skimming through reports - it requires tools that can track and predict shifts in real time. As demographic trends continue to reshape rental markets, platforms like CoreCast are becoming essential for investors. CoreCast offers a comprehensive real estate intelligence platform designed to analyze demographic trends and predict their impact on rental markets. It provides tools that help interpret migration patterns and forecast rent growth, giving professionals the insights they need to make informed decisions.
Real-Time Data and Mapping Tools
CoreCast includes advanced mapping tools that allow users to monitor demographic changes and market conditions in multiple areas simultaneously. For example, the platform highlights "negative migration swings" in previously popular markets like Tampa and Fort Worth while identifying "positive swings" in more affordable regions such as Riverside-San Bernardino [1]. This real-time tracking is invaluable for understanding how outmigration from expensive metros leads to "spillover" growth in nearby, more affordable areas. Examples include movements from Austin to San Antonio or Denver to Colorado Springs, trends that align with previously observed regional shifts.
The platform also visualizes changes in stabilized vacancy rates, helping investors spot emerging opportunities. For instance, markets like Boise, Charleston, and Spokane saw significant declines in stabilized vacancy rates - ranging from 220 to 350 basis points in 2025 [4]. This kind of data provides early indicators of where demand is heating up, helping investors stay ahead of the curve.
Forecasting Demographic Impact on Rent Growth
CoreCast goes beyond tracking current trends; it also offers forecasting tools that predict how demographic shifts will influence rent growth across various markets and property types. One key metric the platform uses is the "reserve of future renters." For example, 17.6% of young adults aged 25 to 34 are currently living with parents or grandparents, compared to a historical average of 13.6% [1]. This suggests a potential surge in demand as economic conditions improve and household formation increases.
The platform also differentiates between "lifestyle" renters and "renters-by-necessity" in regions like the Midwest and Sun Belt [13]. Additionally, it highlights investment opportunities in family-friendly units, particularly three-bedroom apartments, which are in high demand but make up only 5% of recent construction [9]. By combining migration data, income trends, and supply pipeline information, CoreCast enables professionals to predict which markets will face rent pressure and which are poised for steady growth through 2026 and beyond.
Conclusion
Demographics play a central role in driving multifamily rent trends. Factors like age, income levels, and migration patterns reveal where demand is growing, what renters can afford, and which markets are poised to excel. Right now, a noticeable gap exists between the number of young adults living with their parents and historical norms, signaling a potential wave of future renters[1]. At the same time, as the oldest baby boomers turn 80 in 2026, the transition from homeownership to renting is gaining momentum, increasing the need for senior-friendly rental options[1][3].
Income limitations are reshaping the rental market. With the average monthly payment for a starter home hitting $3,544 - an astonishing 93% more than the average apartment rent of $1,741 - many renters are staying put longer[1][5]. This affordability gap is fueling demand across various property types. Additionally, migration trends are shifting. While the Sun Belt was a hot spot during the pandemic, renters are now looking for value in smaller secondary and tertiary markets where rent increases are more manageable. These evolving patterns highlight the critical need for timely market insights.
Experts emphasize the long-term value of understanding these demographic shifts:
"Understanding demographic trends provides a sustainable competitive advantage because these shifts develop over years or decades, not months." - REEP Equity[22]
Real estate professionals who can analyze and anticipate these trends gain a clear advantage. Tools like CoreCast offer real-time insights into migration, market shifts, and forecasting, helping investors identify opportunities before markets become saturated. By blending demographic data with supply trends and regional developments, investors can align their strategies with where demand is headed, rather than where it has been.
As we approach 2026 and beyond, staying ahead of demographic changes and leveraging integrated real estate platforms like CoreCast will be essential for targeting the right markets, properties, and tenant profiles to maximize returns.
FAQs
Which U.S. markets are best positioned for rent growth through 2026?
U.S. markets projected to experience the highest rent growth through 2026 are Miami (3.8%), Seattle (3.7%), Fort Lauderdale (3.5%), and Los Angeles (3.2%). This growth is largely fueled by strong demand and shifting migration trends.
How should investors adjust strategy as Gen Z and baby boomers drive demand?
Investors need to tailor their strategies to align with the preferences of both Gen Z and baby boomers, as these groups have distinct priorities when it comes to housing.
Gen Z tends to prioritize flexibility, modern amenities, and digital connectivity. Properties that feature high-speed internet, shared workspaces, and social spaces are especially appealing to this tech-savvy generation.
On the other hand, baby boomers often look for age-friendly communities that emphasize accessible design, low-maintenance living, and proximity to healthcare facilities.
By addressing these specific needs in their portfolios, investors can position themselves for steady rental growth over the long term.
What metrics signal rent growth limits in workforce housing?
Metrics pointing to limits on rent growth in workforce housing include rising vacancy rates, such as the projected 6.1% in 2024 - the highest seen since 2011. Other key factors are an increased supply of housing surpassing demand and a slower pace of household formation, which is expected to grow by approximately 860,000 new households per year through 2035. These patterns suggest potential mismatches in the multifamily housing market.