
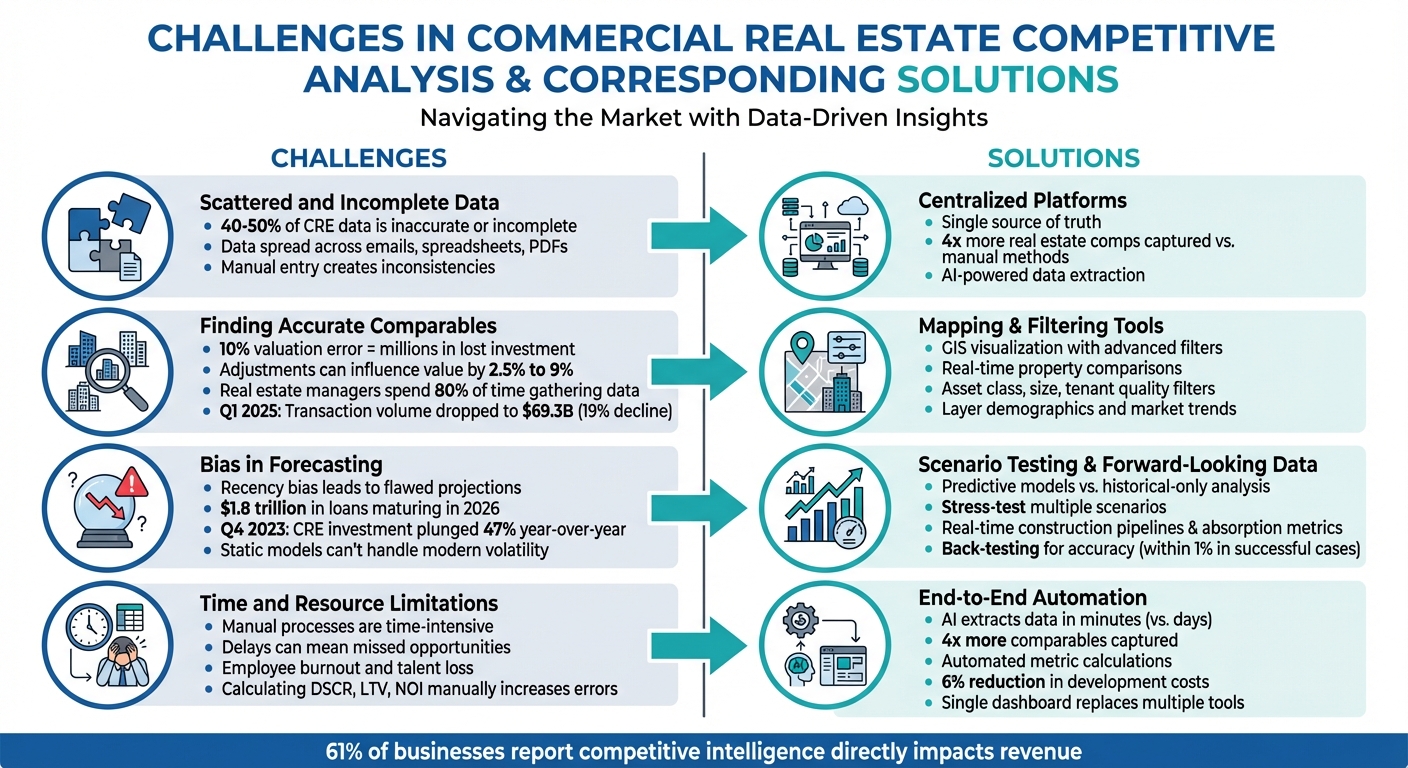
Key Challenges in Competitive Analysis for CRE

Competitive analysis in commercial real estate (CRE) is essential for making informed decisions, but it comes with significant challenges. Here's a quick breakdown of the main hurdles and solutions:
- Scattered and Incomplete Data: CRE data is often fragmented across multiple sources, leading to inaccuracies and inefficiencies.
Solution: Centralized platforms like CoreCast consolidate data, providing a single, reliable source. - Finding Accurate Comparables: Matching properties requires detailed filtering by location, asset class, and market trends.
Solution: Mapping tools with advanced filters simplify comparisons, ensuring precise valuations. - Bias in Forecasting: Over-reliance on historical trends can lead to flawed projections, especially in changing markets.
Solution: Use predictive models and real-time data to test scenarios and refine forecasts. - Manual Processes: Time-intensive tasks like data entry and report generation slow decision-making.
Solution: Automate workflows with AI-powered platforms to save time and reduce errors.
Integrated platforms like CoreCast address these challenges by automating tasks, improving data accuracy, and providing real-time insights. This approach helps CRE professionals make faster, more confident decisions in a competitive market.
4 Key Challenges in CRE Competitive Analysis and Their Solutions
Challenge 1: Incomplete and Scattered Data
When data is incomplete and spread across multiple sources, competitive analysis becomes a major headache. Important details about transactions, market trends, and competitor properties often get buried in email threads, spreadsheets, PDFs, or even physical documents like offering memorandums. Teams are left bouncing between internal records and third-party databases, struggling to piece together a clear market picture [5].
This fragmented approach leads to big issues. Studies show that up to 40–50% of commercial real estate data is either inaccurate or incomplete [4]. Manual data entry and outdated tools only make things worse, creating inconsistencies [5][6]. A deal that seems promising in one dataset might fall apart when conflicting information pops up elsewhere. Plus, many datasets lack the local insights or geographic coverage needed to fully benchmark competitor properties [4].
The result? Decision-making slows to a crawl. Teams risk mispricing assets or falling into "analysis paralysis" as they try to validate assumptions across multiple systems [1][5]. Without a reliable way to compare proprietary deal assumptions with actual market activity, defending investment strategies becomes a real challenge [5][6].
Solution: Use Integrated Data Platforms
Centralizing scattered data is essential for better competitive analysis. Integrated platforms provide a single source of truth by consolidating internal deal data and third-party comparables into one easy-to-use interface. This eliminates the constant back-and-forth between tools [5][6]. In fact, institutional investment teams using centralized systems have captured four times more real estate comps than those relying on manual methods [6].
Platforms like CoreCast take this a step further by combining real-time data across asset classes, giving teams a comprehensive view of the market and historical trends. Instead of manually sorting through spreadsheets, AI-powered tools extract key details from offering memorandums and broker listings, converting static documents into structured, searchable data [5][6]. These tools also standardize data formats and definitions, ensuring consistent comparisons across properties.
To fill in the gaps, these platforms include geographic insights, demographic data, and verified transaction records - providing a level of detail that manual methods simply can't match. This streamlined approach not only saves time but also ensures more accurate and confident decision-making.
sbb-itb-99d029f
Challenge 2: Finding Accurate Comparable Properties
Even experienced analysts struggle to match comparable properties effectively, especially when factoring in location, size, asset class, and submarket characteristics. For instance, comparing a Class A office in a downtown area to a Class B property in the suburbs doesn't work because the asset classes and submarket dynamics are fundamentally different. Even within the same city, office property valuations can vary significantly due to differences in tenant profiles and submarket conditions [10].
This challenge isn't just theoretical - it has real financial consequences. A mere 10% error in commercial property valuation could mean millions of dollars in lost investment value [7]. Yet, appraisers often miss critical adjustments for factors like time, location, or physical characteristics, which can influence property values by anywhere from 2.5% to 9% [7]. Adding to the complexity, U.S. commercial real estate transaction volume dropped to $69.3 billion in Q1 2025, a 19% decline from the previous year, making fresh, accurate comparables even harder to find [9].
When comparables are inaccurate, it disrupts key metrics like cap rates and price-per-square-foot benchmarks, which are essential for property valuation. These metrics are crucial for lenders, who use them to calculate Loan-to-Value (LTV) ratios and Debt Service Coverage Ratios (DSCR). If the data is flawed, financing deals may fall through or be poorly structured, raising the risk of defaults. Beyond financing, operational projections also suffer. For example, using lease comparables without accounting for tenant quality or lease structures - such as Triple Net versus Gross leases - can lead to incorrect Net Operating Income (NOI) estimates and unrealistic cash flow assumptions [7] [9].
Outdated data further complicates these efforts. In stable markets, comparables should ideally come from the past 6–12 months, but in fast-changing markets, only data from the last 3–6 months is reliable [7] [9]. Yet, real estate managers often spend up to 80% of their time gathering and organizing data instead of analyzing it [7] [9]. This leaves little time for the nuanced filtering required to match details like building age, construction quality, tenant credit ratings, or specialized features like ceiling height for industrial properties or parking ratios for retail spaces [3] [8].
To solve these issues, professionals need tools that combine precise geographic visualization with advanced filtering capabilities.
Solution: Use Mapping and Filtering Tools
Geospatial analysis has revolutionized the process, replacing cumbersome spreadsheets with real-time property visualization. These tools allow professionals to compare properties side-by-side while applying specific filters, such as asset class, size (within a 25% variance), year built, and tenant quality [3] [7].
Platforms like CoreCast take these capabilities a step further. By layering property data with demographics, market trends, and competitive insights, CoreCast enables users to make more precise comparisons. You can filter for specialized criteria - like clear height and loading dock ratios for industrial properties or foot traffic and sales per square foot for retail spaces. This granular approach ensures you're comparing properties on a like-for-like basis, avoiding mismatches that could skew valuations. The platform also helps track emerging neighborhoods and monitor competitor activity, delivering a comprehensive submarket view without requiring multiple tools. This seamless integration complements the broader real estate intelligence strategies discussed earlier.
By visualizing key location-based factors - like proximity to amenities or infrastructure quality - you can identify the most accurate comparables quickly and support your valuation assumptions with confidence. As Ben Witten aptly points out:
Real estate is inherently a location-based business...it is critical to dissect the principal components of value and make relevant, scaled adjustments as each component has a different impact on value [9].
Challenge 3: Avoiding Bias in Forecasting
Historical data is the bedrock of Commercial Real Estate (CRE) analysis, but leaning on it too heavily can lead to blind spots. A common pitfall is recency bias - where investors place too much emphasis on recent market trends. For example, projecting past rent growth into the future without accounting for factors like rising oversupply or waning tenant demand can lead to costly forecasting errors, sometimes in the millions [11].
This issue goes beyond simple over-optimism. For years, cap rate compression often masked poor management decisions and flawed assumptions. But in today’s high-interest-rate environment, those safety nets are gone. As Jim Costello, Chief Economist at MSCI Real Assets, puts it:
Cap rate compression is no longer going to cover real estate 'mistakes' [12].
The stakes are especially high with $1.8 trillion in commercial loans set to mature in 2026. Many current forecasting models, built around the low-interest-rate climate of 2010–2021, are ill-equipped to handle today’s market realities [10].
Static risk models - once the industry standard - are struggling to keep pace with modern challenges like climate change, shifting regulations, and geopolitical uncertainty. Historical data doesn’t account for these factors, and the lag in publicly available data often means decisions are based on outdated information [11]. For instance, in Q4 2023, CRE investment plunged 47% year-over-year, showing just how quickly market conditions can deviate from historical norms [10].
The numbers tell a sobering story. In 2024, $600 billion in CRE loans matured in the U.S., with another $500 billion following in 2025 [16]. Yet, despite these pressures, 88% of global CRE respondents anticipate revenue growth by 2025 [16]. This disconnect highlights the need for stress-tested forecasts rather than overly rosy projections.
Solution: Test Scenarios and Use Forward-Looking Data
To overcome these challenges, adopting a forward-looking approach is crucial. The industry is shifting from backward-looking analysis to predictive models that focus on what’s ahead. Bill Maher, Director of Strategy & Research at RCLCO Fund Advisors, cautions:
If you don't look forward, you're flying blind [14].
This shift involves integrating real-time data like construction pipelines, absorption metrics, and risk monitoring into forecasting models.
The process follows a logical sequence: begin with supply data (such as construction pipelines and permits), evaluate demand (absorption rates), and then project rent growth [15]. A practical example comes from American Realty Advisors, which, in June 2025, back-tested their 2020 forecasts against 2024 data. Their industrial market projections were impressively accurate, landing within 1% of actual rent growth [15].
Platforms like CoreCast make this level of precision achievable. Their underwriting tools let users stress-test assumptions across multiple scenarios, modeling optimistic and pessimistic outcomes for factors like occupancy, rent growth, and exit cap rates. Adjustments to capital costs or development schedules are instantly reflected in metrics for real estate cost analysis like Loan-to-Value (LTV), Debt Service Coverage Ratios (DSCR), and Net Operating Income (NOI) [13]. By consolidating data on pipelines, portfolios, and competitors into one platform, CoreCast moves beyond fragmented spreadsheets to deliver probability-driven valuations that account for market uncertainty.
The key takeaway? Use historical data as a guide, not a rule. Anchor your forecasts in historical trends, but adapt them to reflect short-term signals and structural changes [15]. For example, monitor permitting activity in real time and assign probabilities to project completions based on local development timelines, rather than assuming every planned project will be finished. Regularly back-testing prior forecasts can also reveal patterns and help refine your methods over time [15]. This approach ensures your forecasts stay grounded in reality while remaining flexible enough to adapt to changing conditions.
Challenge 4: Time and Resource Limitations in Manual Analysis
Manual competitive analysis in commercial real estate is a time sink. Professionals often find themselves juggling tasks like reformatting rent rolls, extracting financial metrics, and cross-checking market data from various sources. These processes require a lot of effort and attention to detail, making them both tedious and prone to errors [17]. For example, underwriters spend countless hours calculating metrics like DSCR, LTV, and NOI on spreadsheets - a method that’s not only labor-intensive but also increases the likelihood of mistakes [17][10].
In fast-paced markets, delays of even a single day can lead to missed opportunities [17]. Manually generating and distributing reports slows everything down, which is especially risky with $1.8 trillion in commercial loans maturing in 2026. This sheer volume could overwhelm firms still relying on outdated, manual processes [10]. Beyond slowing deal timelines, these inefficiencies contribute to employee burnout and even talent loss [10]. Clearly, automation is needed to streamline workflows, save time, and improve accuracy.
Solution: Automate Processes with End-to-End Platforms
The answer lies in automation. End-to-end platforms are transforming the industry by breaking down data silos and offering full visibility across workflows [10]. AI-powered tools can now extract data from unstructured documents in minutes, eliminating days of manual work [17]. Companies using automated platforms have reported capturing up to four times more real estate comparables in their databases compared to those using manual methods [6].
CoreCast steps in to address these challenges head-on. Its AI-driven tools automate the entire workflow, pulling data directly from unstructured documents and eliminating the need for manual entry. Instead of managing multiple spreadsheets, users get a centralized, real-time dashboard. CoreCast instantly calculates critical metrics like occupancy rates or exit cap rates vs. growth rates and keeps them updated. Plus, it integrates seamlessly with third-party tools like Buildium, QuickBooks, and RealPage, creating a single source of truth. This unified system allows users to underwrite assets, monitor pipelines, map properties and competitors, and generate branded reports for stakeholders - all without switching platforms.
This streamlined approach not only saves time but also improves decision-making. By optimizing timelines, CoreCast has helped development teams cut overall development costs by as much as 6% [18]. The result? Faster workflows, fewer errors, and a competitive edge in a rapidly evolving market.
How Integrated Platforms Solve Competitive Analysis Problems
End-to-end real estate intelligence platforms are transforming how competitive analysis is conducted. By consolidating scattered workflows into a single system, these platforms eliminate the need for manual processes, cutting down on errors and saving time. With AI-driven automation, unstructured data is standardized and ready for analysis, creating a seamless foundation for location-based insights.
Tools like Integrated Geographic Information Systems (GIS) take this a step further, combining property data with local factors such as demographics, foot traffic, and mobility trends. Some platforms even merge multiple datasets to provide real-time, location-specific insights [1]. For example, in early 2026, a property trust used real-time foot traffic data to spot an undervalued asset, make a bold bid, and secure a risk-adjusted return (RAR) exceeding 20% [19]. This level of real-time intelligence is challenging to achieve with older, more traditional methods.
CoreCast exemplifies how these tools are evolving. Beyond automating data entry, CoreCast integrates mapping and demographic insights to streamline competitive analysis. It combines these features into a single, end-to-end platform where users can underwrite various asset classes, manage their pipeline through different deal stages, and view properties alongside market data on an interactive map. CoreCast also supports benchmarking real estate portfolios, stakeholder communication, and branded reporting - all within one system. By addressing data fragmentation and automating repetitive tasks, CoreCast allows professionals to focus on strategic decision-making and building relationships [10][21].
The industry is rapidly moving away from fragmented tools in favor of unified platforms [20]. Many firms are now creating proprietary data clouds by capturing underwriting details from every deal, building unique competitive datasets over time [20]. With $1.8 trillion in commercial real estate loans set to mature in 2026 [10], the efficiency and insights provided by integrated platforms are no longer just a convenience - they're critical for staying ahead in a competitive market.
Conclusion
Competitive analysis in commercial real estate (CRE) has grown far too intricate for manual methods or scattered spreadsheets. Issues like incomplete data, inaccurate comparisons, forecasting bias, and time limitations directly affect revenue and risk management. In fact, 61% of businesses report that competitive intelligence has a direct impact on their revenue [2].
Integrated platforms are changing the game by centralizing data, automating tedious tasks, and delivering real-time insights. As Bill Maher, Director of Strategy & Research at RCLCO Fund Advisors, puts it:
If you don't look forward, you're flying blind. [14]
These modern tools enable data-driven underwriting, ensuring that every pricing assumption is backed by verifiable data and a confidence score [2]. By filling data gaps, they empower precise and informed decision-making.
CoreCast is a prime example of this shift, bringing together underwriting, pipeline tracking, competitive mapping, portfolio analysis, and stakeholder reporting into a single platform. By consolidating these functions, CoreCast turns fragmented data and manual processes into actionable, evidence-based strategies. The result? Faster pricing decisions, stronger justifications, and earlier detection of market trends [6].
Firms that adopt systematic competitive intelligence gain a clear advantage, moving away from guesswork. Using end-to-end platforms, CRE professionals can identify opportunities, validate assumptions, and act decisively in a fast-paced market. In today’s landscape, this approach isn’t just helpful - it’s essential for staying ahead.
FAQs
What data should I centralize first for CRE competitive analysis?
To kick things off, focus on gathering and organizing essential data points like rental income, occupancy rates, operating expenses, and tenant retention metrics. These figures serve as the backbone for analyzing how your property stacks up against competitors in the commercial real estate market.
How recent should my comps be in a fast-changing market?
In a market that evolves quickly, comparable data (or "comps") should typically be no more than 3 to 6 months old. This ensures they represent current market trends and conditions. Relying on fresh data not only improves accuracy but also leads to more informed and effective decision-making.
How can I stress-test rent, occupancy, and cap-rate assumptions?
To evaluate how fluctuations in rent, occupancy, and cap rates impact returns, leverage scenario and sensitivity analysis tools. These tools allow you to adjust critical inputs, such as rental income or cap rates, to test outcomes under best-case, worst-case, and base-case scenarios. By regularly updating these assumptions and running "what-if" scenarios, you can keep your financial models adaptable to market changes and operational risks. This approach helps you navigate uncertainties with greater confidence.