
Retail Real Estate Trends 2025
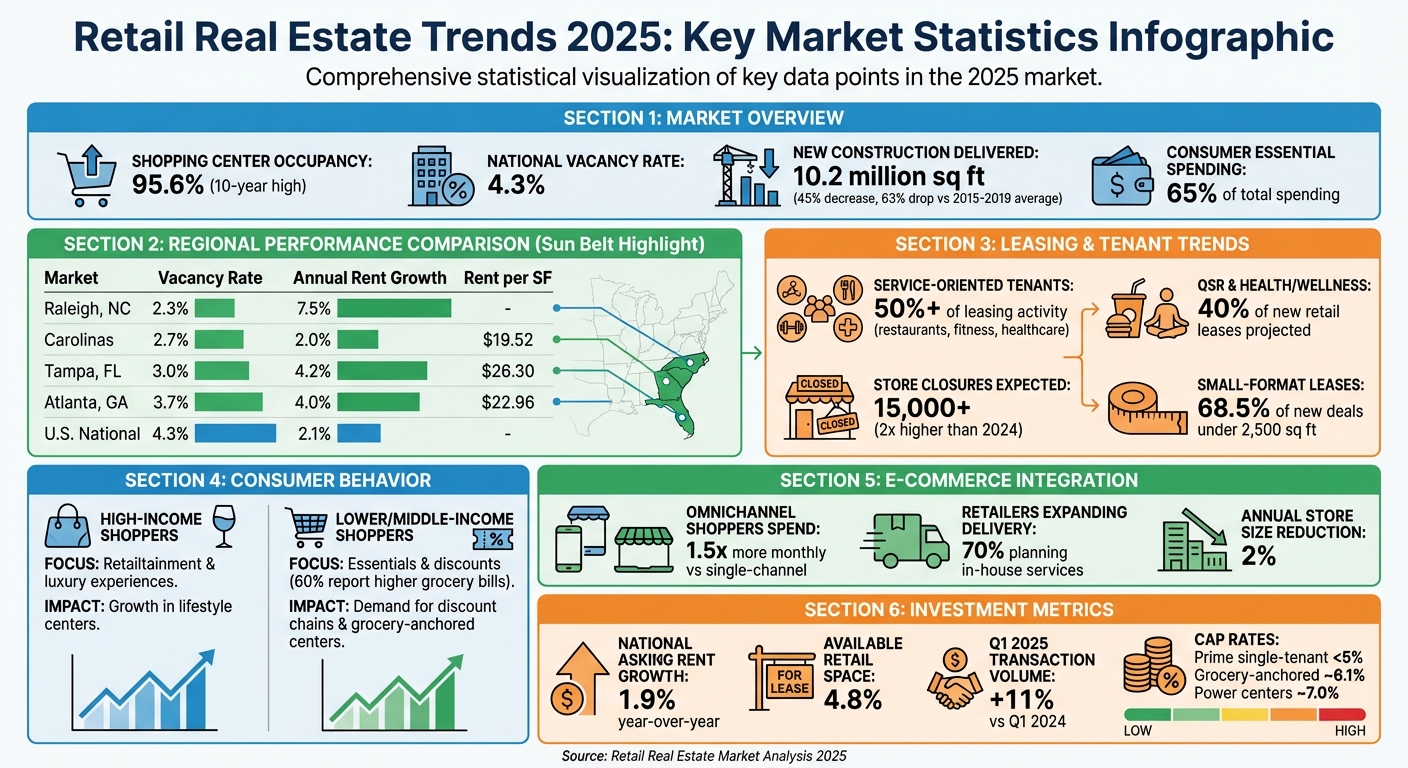
Retail real estate in 2025 faced tight supply, shifting consumer behaviors, and rising costs. Shopping center occupancy hit 95.6%, while new construction dropped by 45%, leaving just 10.2 million square feet delivered. Consumers focused on essentials (65% of spending), driving growth in grocery-anchored centers and discount retailers. Meanwhile, "retailtainment" and experiential formats gained traction in high-income areas.
Key highlights:
- Vacancy rates: National average at 4.3%, but Sun Belt cities like Tampa saw record lows (3.0%).
- Construction: High costs led to a 63% drop in new retail space compared to pre-pandemic levels.
- Leasing trends: Service-oriented tenants (restaurants, fitness, healthcare) dominated, accounting for over 50% of activity.
- E-commerce integration: Physical stores evolved as omnichannel hubs for pickups and returns.
- Regional growth: Sun Belt markets like Raleigh and Dallas saw strong rent growth (7.5% and 4.4%, respectively).
The market's focus shifted to optimizing existing spaces, with grocery-anchored centers and open-air formats standing out as top performers. Investors prioritized high-demand locations, leveraging data tools for smarter decisions.
Retail Real Estate Market Statistics 2025: Key Trends and Regional Performance
Supply, Demand, and Leasing Activity
Vacancy Rates and Net Absorption
The retail market in 2025 went through a period of adjustment. By the end of the year, vacancy rates had climbed to 5.7%, a rise of 40 basis points from 5.3% at the close of 2024. Despite this increase, the numbers were still well below the pre-pandemic average of approximately 7% [4].
Net absorption told a mixed story. The first three quarters of the year saw consecutive periods of negative absorption - a trend not observed since 2020, when bankruptcies and closures of underperforming stores were prevalent [3]. However, the fourth quarter brought a strong turnaround, with 3.4 million square feet absorbed. This marked the best quarterly performance since late 2023 [4]. The rebound was fueled by reduced tariff pressures and a slight easing of consumer spending uncertainty, which encouraged backfilling of vacant spaces.
Regional performance revealed uneven recovery patterns. Vacancy rates dropped in 20 of the 81 markets tracked, with the South and West regions leading the way - 16 of the 20 improving markets were located here [4]. For instance, Montgomery, Alabama saw a 170-basis point decline, and Northwest Arkansas recorded a 140-basis point drop. On the flip side, vacancy rates in New Orleans and Buffalo, New York, each increased by 240 basis points [4]. These regional differences highlight how recovery dynamics varied across the country, reflecting localized impacts of broader market trends.
These absorption patterns set the stage for a closer look at the slowdown in new construction and its influence on leasing activity.
New Construction and Leasing Volume
With occupancy pressures mounting, developers pulled back on new projects, leading to historically low retail space deliveries. High construction costs played a significant role, with only 10.2 million square feet of new retail space delivered in 2025. This figure represents a 63% drop compared to the 2015–2019 average and a sharp 66% decline from the 30 million square feet delivered in 2024. However, there were signs of cautious optimism, as the under-construction pipeline reached 12.7 million square feet, the highest level in five years [4][1].
"Limited new supply will play a critical role in maintaining stable vacancy rates."
– Nicole Larson, National Research Manager for Retail Services, Colliers [1]
The combination of high construction costs and limited new development heightened competition for existing, well-positioned spaces. Neighborhood centers emerged as the focus of construction activity, accounting for 67% (8.5 million square feet) of new projects. This trend reflects the growing appeal of convenience-oriented retail formats [4]. With supply tight, retailers were pushed to compete fiercely for prime locations, often agreeing to longer lease terms to secure these coveted spaces [2].
New Tenant Categories and Retail Formats
Non-Traditional Retail Tenants
By 2025, service-oriented and experiential businesses had taken center stage in retail leasing. These tenants - spanning food services, healthcare, education, fitness, and personal services - accounted for over half of retail leasing activity, a noticeable jump from their 46% average share between 2011 and 2019 [7]. Quick-service restaurants, fitness centers, MediSpas, pet services, cannabis dispensaries, and even car washes played key roles in this surge [6]. Healthcare and wellness providers were especially active, transforming former drugstores and bank branches into urgent care facilities and specialty clinics.
"Some of our legacy merchants are struggling in certain categories, but we see brisk leasing from restaurants, service-oriented concepts, experiential, and even some categories that weren't major players in retail just a few years ago."
– Institutional Landlord [6]
Retailtainment - a hybrid of dining, entertainment, and augmented reality - emerged as a major trend, creating destinations that encouraged consumers to linger. Shopping centers also began adding features like pickleball courts, fitness studios, and even luxury apartments to keep visitors engaged [8]. Quick-service restaurants and health and wellness retailers were projected to account for 40% of new retail leases in 2025 [9].
These shifts represented a stark contrast to the approaches of traditional value retailers, who adapted to meet the demands of inflation-conscious shoppers.
Value Retailers and Discount Chains
The rapid growth of discount retailers, off-price chains, and small-format grocery stores reflected the priorities of budget-conscious consumers in 2025. With inflation driving 60% of shoppers to spend more on groceries [1] and essential goods making up roughly 65% of overall consumer spending [2], value-focused retail thrived.
"Whenever inflation is elevated, the winners have been value-oriented retail."
– Institutional Landlord [6]
Dollar stores and discount chains expanded aggressively, though the sector faced hurdles. According to Coresight Research, store closures in 2025 were expected to surpass 15,000 - twice the number recorded in 2024 [6]. While some value retailers grew rapidly, others closed underperforming locations due to market saturation. The drugstore sector also saw major consolidation, with large chains shuttering thousands of locations, creating opportunities for discount retailers to repurpose these spaces [6]. Meanwhile, small-format and ethnic grocery stores gained traction, meeting consumer demand for frequent, local, and budget-friendly food shopping experiences.
Regional Markets and Property Type Performance
Regional Market Analysis
In 2025, the Sun Belt and Southeast regions led the way in retail market performance, leaving older Northeast and Midwest markets trailing behind. From 2014 to 2023, population growth in the Sun Belt surged at over 3.5 times the national average [13]. This explosive growth created a surge in demand for retail spaces in these booming areas, with local rental and vacancy metrics reflecting these demographic shifts.
The Southeast saw vacancy rates plummet to record lows. Tampa's vacancy rate hit 3.0%, while the Carolinas maintained an even tighter 2.7% [10]. Atlanta followed closely with a retail vacancy rate of 3.7%, which was 90 basis points below the national average of 4.3% [10][12]. Within Tampa, specific submarkets like Westshore and East Tampa recorded astonishingly low vacancy rates of 1.1% and 1.0%, respectively [10].
Rental growth in these regions told a similar success story. Raleigh led the nation with an impressive 7.5% year-over-year rent growth, while Tampa and Dallas–Fort Worth posted strong gains of 4.2% and 4.4%, respectively. These numbers far exceeded the national average of 2.1% [11][12]. Meanwhile, older markets like Cleveland and Chicago experienced little to no rent growth. The scarcity of available retail space in the Southeast pushed rental prices to new heights, with Miami/Fort Lauderdale reaching $43.01 per square foot, Nashville at $28.23, and Tampa at $26.30 [10].
| Market | Vacancy Rate | Annual Rent Growth | Rent per SF |
|---|---|---|---|
| Raleigh, NC | 2.3% | 7.5% | |
| Carolinas | 2.7% | 2.0% | $19.52 |
| Tampa, FL | 3.0% | 4.2% | $26.30 |
| Atlanta, GA | 3.7% | 4.0% | $22.96 |
| U.S. National | 4.3% | 2.1% |
The Southeast and Southwest also led the nation in filling large-format vacancies left by bankrupt retailers like Bed Bath & Beyond and Toys R Us [9]. Cities such as Austin, Dallas, and Charlotte benefited from the growth of the tech and finance sectors, which attracted high-income professionals. Meanwhile, strong tourism and healthcare industries in cities like Nashville and Miami supported the success of high-end retail formats [2]. Together, these demographic and economic factors fueled intense competition and robust rental growth.
Retail Property Type Performance
Retail property types reflected changing consumer habits and tenant profiles in 2025. Grocery-anchored centers stood out as top performers, benefiting from steady foot traffic as shoppers prioritized essential goods. These centers remained a consistent draw for frequent visits.
General retail reported the lowest vacancy rate across all retail segments at just 2.6% [14]. Neighborhood centers led the way in rent growth, posting a 2.7% increase [14], while power centers also showed resilience with a 2.6% annual rent growth [14]. Many landlords successfully filled vacancies left by bankruptcies, bringing in junior box tenants to revitalize these spaces.
Suburban retail outshined its urban counterparts, driven by the rise of hybrid work and a growing focus on local living. Tenant demand in suburban areas surged by 50% [9]. Open-air neighborhood and strip centers gained traction as retailers used these locations to support omnichannel strategies, including online order pickups and returns [2].
New retail construction saw a steep decline in 2025, with deliveries falling below 20 million square feet - a dramatic 45% drop from previous years [1]. As a result, 95% of available retail space was located in existing properties [12]. This limited supply created fierce competition for quality retail spaces, particularly in the high-demand Sun Belt markets where retailers scrambled to secure prime locations for expansion.
Consumer Spending and E-Commerce Impact
Consumer Spending by Income Level
In 2025, economic uncertainty left nearly half (47%) of consumers feeling uneasy about their financial situation, with 60% reporting higher grocery bills. This shift put pressure on household budgets, pushing shoppers across all income levels to prioritize savings. Many turned to discount retailers and private-label brands to make their money go further [1].
Essential goods now account for 65% of consumer spending, creating what some are calling a retail "loyalty crisis." More than half (56%) of retail executives anticipate that shoppers will prioritize low prices over brand loyalty, and 80% expect price wars to intensify [2][15]. Grocery-anchored shopping centers and discount chains have proven resilient in this environment, benefiting from consistent foot traffic as consumers focus on necessities.
However, high-income shoppers in cities like Austin, Nashville, and Charlotte are bucking this trend. These consumers continue to seek out "retailtainment" - a mix of shopping, dining, and entertainment. As a result, lifestyle centers and luxury mixed-use developments are thriving in these markets, creating pockets of strong performance [2]. This divergence in spending habits has pushed landlords to adjust their tenant offerings, catering to both budget-conscious shoppers and those looking for premium experiences. These changes have also accelerated retailers' efforts to embrace digital transformation.
E-Commerce and Physical Store Integration
As consumer habits evolved, retailers stepped up their efforts to merge e-commerce with physical stores. In 2025, this integration became a key driver of omnichannel growth, reflected in leasing trends and tenant innovations. Omnichannel shoppers, who seamlessly switch between online and in-store experiences, spent 1.5 times more each month than those who stuck to a single channel, making this strategy a top priority for retailers [18].
Direct-to-consumer (DTC) brands also leaned into physical retail to cut customer acquisition costs. For example, beauty brand Glossier hit $100 million in annual sales in 2024 after partnering with Sephora, expanding beyond its DTC-only roots [17]. Similarly, health-tech company Oura teamed up with retailers like Best Buy and Target in 2023, allowing customers to experience in-store product demonstrations and fittings [17]. These moves highlight a broader trend: nearly half (46%) of retail executives are focusing on improving omnichannel experiences to drive growth [16].
Physical stores are also evolving into fulfillment hubs. By 2025, 70% of retailers planned to expand in-house delivery services, redesigning store layouts to accommodate BOPIS (buy online, pick up in-store) and easier returns [18]. Retailers are also trimming store sizes, reducing footprints by 2% annually to optimize space [2]. In early 2024, over 68.5% of new leasing deals were for spaces of 2,500 square feet or less, reflecting the shift toward smaller, more efficient formats [8]. Open-air neighborhood and strip centers have gained popularity as retailers use these locations to support their omnichannel logistics.
| Consumer Segment | Spending Behavior in 2025 | Impact on Retail Real Estate |
|---|---|---|
| High-Income | Focused on "retailtainment" and high-end shopping [2] | Growth in lifestyle centers and luxury mixed-use developments [2] |
| Lower/Middle-Income | Budget-focused; prioritizing essentials and discounts [2][15] | Increased demand for discount chains and grocery-anchored centers [2] |
To navigate these shifts, real estate professionals can leverage platforms like CoreCast, which provide actionable insights to guide smarter leasing and investment decisions.
sbb-itb-99d029f
Retail REITs Outperform? Q3 2025 Earnings Reveal Surprising US Market Trends
Rent Growth, Valuations, and Investment Activity
A limited supply and intense competition have reshaped leasing activity, driving notable rent increases and influencing property valuations in meaningful ways.
Rent Growth Across Property Types
By mid-2025, national asking rents rose by 1.9% year-over-year, with vacancy rates sitting at 4.3% and just 4.8% of retail space available by the end of Q1 [12]. The scarcity of space, coupled with high financing costs, has slowed new development. Retail completions are now just a fraction - roughly one-quarter - of what they were in the early 2000s. Meanwhile, outdated properties continue to be demolished, further tightening the market. Despite these challenges, retailers have been squeezing more revenue out of their existing spaces, with nominal core retail sales jumping over 30% since 2019, even as occupied retail space grew by less than 2% during the same period [12].
Regional rent growth painted a mixed picture. The Sunbelt and Mountain West regions, bolstered by strong population growth, led the charge. Raleigh, North Carolina, posted an impressive 7.5% year-over-year rent growth alongside a low 2.3% vacancy rate. Tampa followed at 4.7%, Dallas-Fort Worth at 4.4%, and Atlanta at 4.2%. On the other hand, markets in the Northeast and Midwest, like the East Bay area near Oakland, saw rents drop by 2.6% [5][12].
"The rent gap between prime and non-prime locations is widening, underscoring the importance of quality and walkability in rent performance." - CBRE Retail Rent Dynamics Report
Vacancy rates also varied by property type. General retail single-tenant properties had the lowest vacancy rate at 2.7%, while power centers were at 4.7%, and malls experienced the highest vacancy at 8.9%. In Los Angeles, high-street retail rents were more than three times higher than rents in suburban areas. Interestingly, suburban retail hubs in cities like Denver and Chicago showed accelerating rent growth, highlighting the evolving dynamics of retail space demand [5][12].
Property Valuations and Transaction Volume
Property valuations remained stable throughout 2025, supported by limited availability and a constrained development pipeline. After a period of rapid expansion in 2022-2023, cap rates leveled off by mid-2024. Prime single-tenant retail properties - especially those deemed essential - continued to attract investors, with cap rates dipping below 5%. Grocery-anchored neighborhood centers saw cap rates around 6.1%, while power centers hovered near 7.0%. Dollar stores and pharmacies typically commanded cap rates of 7% or more [12].
Retail investment activity showed promising signs of recovery. In Q1 2025, transaction volume rose by 11% compared to Q1 2024. Grocery-anchored centers and open-air strip malls stood out as investor favorites, thanks to their alignment with essential consumer spending and e-commerce fulfillment needs.
Location and quality became even more critical to investors. Live-Work-Play (LWP) districts - areas that combine residential, office, and entertainment spaces - gained popularity. New York led the pack with the highest average LWP rent at $91.40 per square foot, followed by Boston at $47.33 and Washington, D.C., at $46.21 [5]. Urban hotspots like Los Angeles and Miami outperformed, while office-adjacent areas in Chicago and San Francisco experienced more subdued growth [5].
"Despite lower interest rates, the high cost of capital will make it challenging to finance new projects and expansions." - CBRE Market Outlook 2025
Construction costs have remained stubbornly high, still 30% to 40% above pre-pandemic levels. However, shopping center occupancy reached a decade-high of 95.6%, showcasing the sector's resilience [1].
For real estate professionals navigating these trends, platforms like CoreCast provide valuable tools for underwriting, pipeline tracking, and portfolio analysis. By leveraging such integrated intelligence, investors can pinpoint high-growth opportunities and make well-informed decisions in a market characterized by scarcity and selectivity. These shifts highlight the growing importance of data-driven strategies in today’s real estate landscape.
Conclusion
The retail real estate market in 2025 is all about limited supply, careful choices, and strategic adjustments. With new construction expected to dip below 20 million square feet - a sharp 45% decrease compared to previous years - investors, developers, and operators are being pushed to rethink their strategies to stay competitive [1]. Shopping center occupancy has hit a 10-year high of 95.6%, showcasing the sector's resilience despite facing numerous challenges [1].
The key to success lies in focusing on existing assets rather than new developments. Renovating current properties often delivers stronger returns compared to the high costs of new construction. Grocery-anchored centers and open-air formats are leading the way, buoyed by consumer preferences that now direct about 65% of spending toward essential goods [2]. These properties are also evolving into critical hubs for omnichannel retail, streamlining online order pickups and returns. This trend highlights how leasing and tenant behaviors have shifted to align with modern consumer needs.
Location plays a crucial role too. Sun Belt cities like Austin, Dallas, Phoenix, and Nashville are thriving, benefiting from population growth and expanding job markets. At the same time, "retailtainment" is redefining traditional shopping by transforming spaces into engaging, experience-driven destinations. Major brands are stepping up with innovative approaches to meet these shifting dynamics.
For industry professionals, data-driven insights have become non-negotiable. Given the ongoing supply constraints and changing tenant demands, integrated tools are now essential. Platforms like CoreCast allow users to analyze assets, monitor deal pipelines, and conduct in-depth portfolio reviews - all in one place. By combining real-time market trends with property-specific data, these tools help identify high-potential opportunities in a competitive landscape. In a market where quality locations and strategic foresight set the leaders apart, leveraging such technology is more critical than ever.
FAQs
What is driving the growth of grocery-anchored retail centers in 2025?
Grocery-anchored retail centers are thriving in 2025, driven by a limited supply of new developments. This scarcity has sparked intense competition among tenants, pushing rents higher as businesses vie for these coveted spaces. Investors are also drawn to these properties, appreciating their consistent performance and resilience, even in the face of broader market challenges.
The demand for groceries remains strong, thanks to their essential nature, the growing popularity of on-demand delivery services, and initiatives like SNAP that make fresh food more accessible. Adding to this momentum, value-oriented and specialty grocers are rapidly expanding, outpacing traditional retailers in opening new locations. Their innovative approaches, such as private-label product lines and retail media networks, further enhance the appeal of grocery-anchored centers. As a result, these properties enjoy low vacancy rates and steady rent growth, making them a standout in the retail sector.
How are retailers responding to the growing demand for 'retailtainment' in affluent areas?
Retailtainment is changing the way brands connect with affluent shoppers, blending shopping with entertainment to create memorable experiences. In wealthier areas, stores are evolving into destinations, offering more than just products. Think interactive installations, live performances, and Instagram-worthy setups that make a trip to the store an event in itself.
To keep up, many retailers are shifting toward smaller, adaptable spaces perfect for pop-ups, product demonstrations, and cutting-edge tech like AR mirrors or contactless kiosks. They’re also hosting exclusive gatherings featuring local talent - whether it’s artists, chefs, or performers - to draw in crowds and create buzz. These in-person experiences are often paired with seamless omnichannel services, like buy-online-pick-up-in-store, ensuring a smooth connection between digital and physical shopping.
Tools like CoreCast are playing a key role in this shift. By offering insights into foot traffic, prime locations, and leasing strategies, these real estate intelligence platforms help brands make smarter decisions. With data-driven approaches, retailers can pinpoint the best spots for their experiential spaces and maximize the impact of their efforts.
Why is retail rent growth in the Sun Belt region outpacing other areas?
Retail rents in the Sun Belt are climbing at a faster pace compared to other regions in the U.S., thanks to a mix of rapid population growth and increasing job opportunities. These factors are boosting consumer demand, while the limited development of new retail spaces has left high-quality locations scarce. The result? Tenants are competing fiercely for available spaces, driving rents higher.
This surge highlights the region's attractiveness for both businesses and residents, with its thriving economy and migration trends continuing to spark interest in retail properties.