
5 Steps to Calculate NOI for Commercial Properties

Net Operating Income (NOI) is a critical metric for evaluating commercial real estate. It measures a property's profitability by subtracting operating expenses from effective gross income, excluding financing and tax costs. Here's a quick breakdown of the 5 steps to calculate NOI:
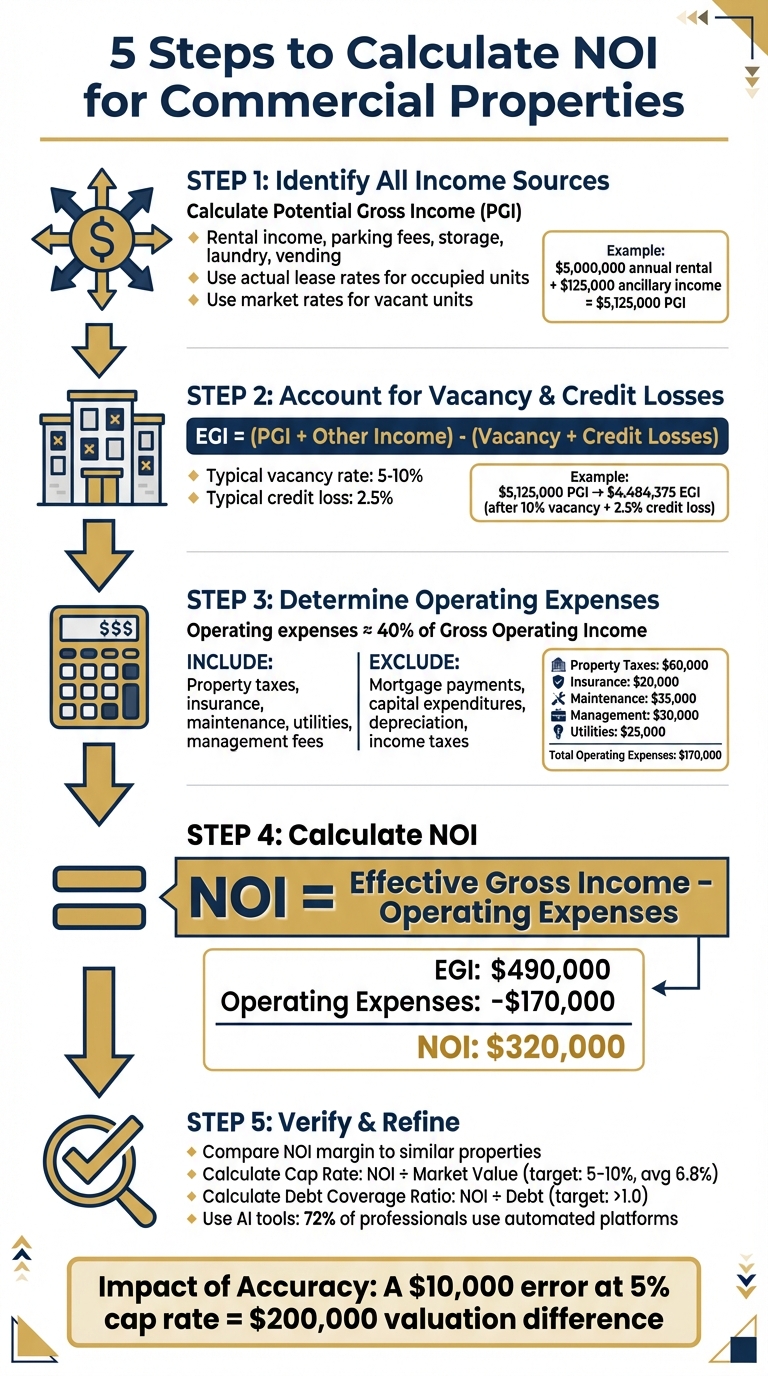
- Identify All Income Sources: Include rental income and additional revenue from services like parking or laundry.
- Account for Vacancy and Credit Losses: Adjust potential income for empty units and unpaid rent.
- Determine Operating Expenses: Include costs like property taxes, insurance, utilities, and maintenance. Exclude non-operating costs like mortgage payments or capital expenditures.
- Apply the NOI Formula: Subtract operating expenses from effective gross income.
- Verify and Refine Calculations: Cross-check your results with market benchmarks and use tools for accuracy.
Accurate NOI calculations help investors assess property performance, determine value, and make informed decisions.
5-Step Process to Calculate Net Operating Income (NOI) for Commercial Real Estate
How to Calculate Net Operating Income (NOI) for Commercial Real Estate
Step 1: Identify All Income Sources
Start by calculating the Potential Gross Income (PGI) - this represents the total revenue a property could generate from all income streams, including rent and additional fees. As Rory Arnold from Rocket Mortgage explains:
"Potential rental income is how much you'd make if the property were 100% leased 100% of the time" [4].
PGI assumes full occupancy and incorporates revenue from extras like parking fees, storage units, laundry facilities, vending machines, and service charges. To refine your PGI, separate income from occupied units and potential income from vacant ones.
Factor in Market and Lease Rates
For a clear picture of potential income, use actual lease rates for occupied units and market rates for vacant ones [3]. This also helps identify "Loss to Lease", which is the difference between market rates and the lower rates you might still be collecting from older leases [3].
Include Non-Rental Revenue Streams
Beyond rent, consider other revenue sources. Review financial records from the past 2–3 years to pinpoint consistent ancillary income [4][8]. A physical property audit can help identify amenities like fitness centers or pet-friendly areas that bring in additional fees. Also, review lease agreements to account for tenant reimbursements, such as utility payments or charges for maintaining common areas [3].
For example, in May 2024, Caliber highlighted a university-adjacent apartment complex that generated $5,000,000 in annual rental revenue. After factoring in vacancy, the property added $125,000 from ancillary services like parking and storage fees, significantly boosting its Gross Operating Income [6].
Identifying all income sources accurately is the first step toward calculating a reliable Net Operating Income (NOI), a key metric for assessing property performance.
Step 2: Account for Vacancy and Credit Losses
Once you've calculated the Potential Gross Income (PGI), it's time to adjust for real-world factors to determine the Effective Gross Income (EGI). This step involves subtracting vacancy and credit losses from your PGI.
"Low vacancy rates are considered positive because it generally means people want to live in a particular area or building, while higher rates mean the opposite" [9].
The formula is simple: EGI = (PGI + Other Income) - (Vacancy Losses + Credit Losses) [7][11]. While PGI assumes full occupancy and perfect rent collection, EGI reflects the reality of empty units and late or missed rent payments.
Estimate Vacancy Rates
Start by analyzing the property's historical data to uncover vacancy trends over the past 2–3 years [4]. If historical data isn’t available, use market benchmarks. Resources like the U.S. Census Bureau and reports from firms such as Jones Lang LaSalle (JLL) provide regional and property-specific vacancy rates [9].
To calculate the vacancy rate, multiply the number of vacant units by 100, then divide by the total number of units [9]. When historical data is limited, a 5% combined vacancy and credit loss factor is often used as a rule of thumb [10].
Don’t forget to include units that are undergoing repairs or renovations, as these are temporarily unrentable [9]. If your property's vacancy rate is much higher than the market average, it may indicate that your rental rates are too high compared to nearby competitors [9].
Once you've estimated the vacancy rate, the next step is to address losses from tenant non-payment.
Compute Credit Losses
Credit losses represent the income lost when tenants fail to pay rent [3]. These losses need to be calculated separately to avoid inflating your property's profitability [4][7].
To determine credit loss rates, review tenant payment histories. For example, in a 100-unit residential property, analysts applied a 10% vacancy rate and a 2.5% credit loss, reducing a $4.8 million PGI to a $4.2 million EGI [11]. If historical payment data is unavailable, use credit loss rates from similar properties in your market as a benchmark [4][7].
You can also evaluate upcoming lease expirations and assess tenant creditworthiness to forecast potential future losses [3]. By accurately accounting for both vacancy and credit losses, you'll be set to calculate Net Operating Income (NOI) in the next step.
Step 3: Determine Operating Expenses
Once you've accounted for vacancy and credit losses, the next step is to focus on identifying and categorizing the expenses required to keep the property running smoothly. Operating expenses are the regular costs associated with managing and maintaining a property.
"The net operating income is often referred to as 'the line' because operating expenses are calculated 'above the line' while capital expenditures and leasing costs are 'below the line' items." - Robert Schmidt, CCIM [3]
For large apartment buildings, operating expenses typically hover around 40% of the Gross Operating Income [6]. To get a clear picture, review two to three years of historical accounting records. This helps you separate consistent, recurring costs from one-off expenses. It's also a good idea to compare your per-unit operating expenses to similar properties in your area. This benchmarking can reveal any outliers or irregularities.
Identify Allowable Expenses
Allowable operating expenses cover a wide range of items, including property taxes, insurance premiums, maintenance and repairs, property management fees, utilities (like water, electricity, and gas), janitorial services, landscaping, snow removal, marketing, and professional fees such as legal or accounting services.
Routine maintenance tasks, like replacing lightbulbs or fixing leaks, also fall under operating expenses since they are part of the property's day-to-day upkeep. It's essential to check your lease agreements too. In "Absolute Net Leases", tenants handle all operating expenses, while in "Gross Leases", the owner is responsible for covering these costs.
By identifying these allowable expenses, you can separate them from costs that don't directly reflect the property's operational performance.
Exclude Non-Operating Costs
Non-operating costs are excluded because they don't represent the property's operational efficiency. These expenses often depend on the individual investor's financing or tax strategies. For example, mortgage payments (both principal and interest), capital expenditures (like replacing a roof or upgrading an HVAC system), depreciation, income taxes, amortization, tenant improvements, leasing commissions, and personal expenses aren't included in the Net Operating Income (NOI) calculation.
It's especially important to distinguish between repairs and improvements. Repairs are regular, smaller fixes that maintain the property, whereas improvements are larger, irregular projects that extend the property's lifespan - like structural renovations or installing a new roof. These improvements are classified as capital expenditures and fall "below the line."
| Allowable Operating Expenses (Include) | Non-Operating Costs (Exclude) |
|---|---|
| Property taxes, insurance | Mortgage payments (debt service) |
| Maintenance and repairs | Income taxes |
| Property management fees | Depreciation and amortization |
| Utilities (water, electricity, gas) | Capital expenditures (major upgrades) |
| Janitorial and cleaning services | Tenant improvements (TI) |
| Landscaping and snow removal | Leasing commissions |
| Marketing and advertising | Personal expenses (owner's travel/phone) |
| Legal and professional fees |
sbb-itb-99d029f
Step 4: Calculate Net Operating Income
To calculate Net Operating Income (NOI), use this straightforward formula: NOI = Effective Gross Income - Operating Expenses [6].
Start by pulling together the income and expense details you’ve already gathered in Steps 1–3. Effective Gross Income (EGI) is the total of all rental income and additional revenues (like parking, laundry, or vending machines) after deducting vacancy and credit losses. From this EGI, subtract all operating expenses identified earlier, such as property taxes, insurance, utilities, maintenance, and management fees. The result is your NOI.
"Net operating income reveals the profit potential of an investment property." - Janet Berry-Johnson, Writer, LendingTree [7]
This formula is a key step in determining the financial health of an investment property.
Breaking Down the NOI Formula
Here’s an example to put the formula into action:
- Gross Potential Income: $500,000
- Vacancy Loss (5%): $25,000
- Additional Income: $15,000
After accounting for these, the Effective Gross Income (EGI) is $490,000. Now, let’s factor in operating expenses:
- Property Taxes: $60,000
- Insurance: $20,000
- Maintenance: $35,000
- Management Fees: $30,000
- Utilities: $25,000
These total $170,000. Subtracting this from the EGI gives an NOI of $320,000.
This figure is essential for determining property value, calculating capitalization rates, and evaluating financial performance. Lenders often rely on NOI to assess a property's loan eligibility. Be cautious - overestimating your NOI can lead to borrowing more than you should, while underestimating it might result in loan rejection. To stay accurate, revisit your NOI calculations annually to account for changes like seasonal utility costs or updated property taxes [5]. A precise NOI is the foundation for making sound investment decisions.
Step 5: Verify and Refine Calculations
Once you've calculated the Net Operating Income (NOI) using the earlier steps, it's time to double-check your numbers. Accurate NOI calculations are critical since lenders, investors, and appraisers rely on them. Mistakes here can lead to loan rejections [1], overpaying for a property [8], or even operational headaches [7].
Cross-Check Against Market Standards
Start by comparing your NOI with industry benchmarks. Look at your property's per-unit NOI and NOI margin to identify any red flags, such as unusually high expenses or overstated income [8]. To gauge efficiency, calculate the NOI margin by dividing NOI by Gross Operating Income, then compare it to similar properties.
Next, evaluate your Capitalization Rate (Cap Rate) by dividing NOI by the property's market value. For investment properties, analysts generally suggest Cap Rates between 5% and 10%, with commercial office buildings averaging around 6.8% [7][2]. You should also calculate the Debt Coverage Ratio (DCR) by dividing NOI by debt obligations. A DCR above 1.0 indicates that the property generates enough income to cover its debt [5].
If your figures are out of sync with market data, take the time to revisit your inputs and assumptions. This step ensures that your NOI is both accurate and aligned with industry expectations.
Use Tools for Better Accuracy
To refine your calculations further, consider leveraging advanced tools. Around 72% of real estate professionals use AI-powered platforms for reporting and analysis [12]. These tools can streamline the verification process and ensure consistency with your manual calculations.
For instance, CoreCast is a platform designed to automate income tracking, forecast expenses, and provide real-time NOI insights. It integrates with property management systems, allowing users to monitor key metrics like occupancy rates and rent per square foot through interactive dashboards. CoreCast also generates professional-grade investor reports, making it easier to communicate performance metrics.
One of CoreCast's standout features is its ability to conduct variance analysis, comparing projected NOI with actual results. It highlights discrepancies, such as unexpected maintenance costs or higher-than-anticipated tenant turnover. As Daniel Roccanti explains:
"Investors seek clarity on both the figures and the factors influencing them. They want assurance that their investments are performing well compared to market benchmarks and that you're actively managing risks" [12].
Currently in beta, CoreCast is available at $50 per user per month, with full deployment pricing set at $105 per user per month [12].
Common Pitfalls in NOI Calculation
Errors to Avoid
Even seasoned investors can slip up when calculating Net Operating Income (NOI), and these missteps can significantly impact property valuation. One common mistake is including items like mortgage payments, income taxes, or personal expenses in the calculation. These costs relate to the investor, not the property itself, and should always be excluded.
Another frequent error involves misclassifying capital expenditures as operating expenses. Capital expenditures and non-cash accounting entries - like depreciation and amortization - must be categorized separately. Misclassification can throw off your valuation in a big way. For instance, a $10,000 misstep at a 5% cap rate could result in a $200,000 difference in property valuation [6].
Schmidt describes this separation as "the line" concept: operating expenses belong "above the line" in your NOI calculation, while capital expenditures and financing costs stay firmly "below the line" [3]. Keeping these categories clear ensures your NOI reflects the property’s true performance, as outlined in earlier steps.
Expense Classification Table
Here’s a handy table to help you quickly determine how to categorize expenses correctly:
| Expense Category | Examples | Inclusion Status | Why? |
|---|---|---|---|
| Allowable (Operating) | Property taxes, insurance, utilities, janitorial, landscaping, routine repairs, management fees | Included | Essential for maintaining day-to-day property operations [5] [7] |
| Non-Allowable (Financing) | Mortgage principal and interest | Excluded | Tied to the owner’s financing structure, not property operations [3] |
| Non-Allowable (Capital) | Roof replacement, HVAC overhaul, major renovations | Excluded | Irregular investments meant to extend the property’s lifespan [5] [8] |
| Non-Allowable (Accounting) | Depreciation, amortization | Excluded | Non-cash items that don’t affect actual cash flow [3] [1] |
| Non-Allowable (Tax/Personal) | Income taxes, owner’s travel, personal cell phone | Excluded | Costs specific to the owner, unrelated to property operations [7] [8] |
| Non-Allowable (Leasing) | Tenant improvements, leasing commissions | Excluded | Expenses tied to acquiring tenants, not running the property [3] |
When categorizing expenses, a simple rule of thumb applies: Is this expense necessary for the property’s day-to-day operations? If the answer is no, it doesn’t belong in your NOI calculation.
Conclusion
To ensure a reliable Net Operating Income (NOI) calculation, stick to a clear process: identify all income sources, account for vacancy and credit losses, determine operating expenses, apply the NOI formula, and cross-check your results with market benchmarks.
Precision matters. Misclassifying just $10,000 at a 5% cap rate could alter a property’s valuation by $200,000 [6]. It can also influence lender decisions, particularly through metrics like the Debt Coverage Ratio [5]. As Janet Berry-Johnson from LendingTree aptly describes:
"NOI is like a crystal ball that shows the true profit potential of an investment property" [7].
Modern tools, such as CoreCast, bring efficiency to the process. These platforms integrate underwriting, portfolio analysis, and financial modeling, allowing you to track income, categorize expenses accurately, and compare your NOI against similar properties - all with real-time precision. This ensures every component of your NOI is correctly represented.
Accurate NOI calculations are the backbone of informed investment decisions. By following this structured approach and leveraging the right tools, you can confidently navigate the complexities of real estate finance.
FAQs
How do vacancy and credit losses affect Effective Gross Income (EGI)?
Vacancy and credit losses directly impact the Effective Gross Income (EGI) by accounting for income lost from unoccupied units or tenants who fail to pay rent. To determine EGI, you subtract these losses from the property’s Gross Potential Income (GPI) - the maximum income the property could generate if it were fully rented with all tenants paying on time.
This adjustment provides a clearer picture of the property’s actual income, which plays a key role in financial modeling and calculating the Net Operating Income (NOI).
Why aren’t mortgage payments and capital expenditures included in NOI calculations?
Net Operating Income (NOI) focuses on the core profitability of a property by excluding certain costs. Mortgage payments, classified as financing costs, and capital expenditures, which are irregular and non-operating expenses, are not included in the calculation.
This approach keeps the focus on income and operating expenses, offering a straightforward view of the property’s operational performance without the influence of financing or occasional capital costs.
What are the best tools to ensure accurate NOI calculations for commercial properties?
Accurate NOI (Net Operating Income) calculations are essential for sound financial analysis, and having the right tools can make all the difference. Many professionals rely on spreadsheet templates that connect key data points like rent rolls, expense line items, and vacancy allowances. These templates not only simplify the auditing process but also allow you to run "what-if" scenarios effortlessly, without the hassle of re-entering data.
For those seeking a more advanced option, platforms like CoreCast provide a comprehensive solution. They bring together lease data, expense reports, and market benchmarks into a single, easy-to-navigate dashboard. This integration ensures real-time accuracy, automates calculations, and flags discrepancies early, so you can address potential issues before finalizing your financial model.
By combining structured spreadsheet templates with real-time tools like CoreCast, you can streamline your NOI calculations while maintaining a high level of precision in your financial evaluations.