
Ultimate Guide to Data Center REIT Metrics
When evaluating data center REITs, understanding the right metrics is key. Unlike other REIT types, data centers focus on power, efficiency, and uptime rather than square footage. This guide breaks down the most important metrics - both operational and financial - that drive performance and investment decisions.
Key Takeaways:
- Energy Efficiency Matters: Metrics like Power Usage Effectiveness (PUE) and Data Center Infrastructure Efficiency (DCiE) directly impact costs and profitability.
- Reliability is Critical: Uptime and Tier Classifications (I-IV) influence tenant retention and pricing.
- Financial Metrics Like FFO and AFFO: These are better indicators of cash flow and dividend sustainability than traditional net income.
- AI Workloads Are Changing the Game: Higher rack densities (30–50 kW per rack) demand advanced cooling and power systems.
- Future Challenges: By 2030, data centers may consume 9% of U.S. electricity, doubling current levels.
For REIT managers and investors, tracking these metrics ensures facilities remain efficient, reliable, and profitable in a rapidly evolving market.
Data Center REIT Key Metrics Comparison: Operational vs Financial Performance Indicators
REIT Valuation: Crash Course
Key Operational Performance Metrics
When it comes to data center REITs, performance is all about reliability and energy efficiency. Unlike traditional real estate, where square footage determines value, data centers are judged on their ability to keep systems running (uptime) and manage energy use. These factors directly affect tenant satisfaction, operating costs, and overall profitability. Let’s break down the key metrics that shape operational performance.
Uptime and Tier Classifications
The Uptime Institute's Tier Classification system (ranging from Tier I to Tier IV) is the gold standard for measuring data center reliability. Each tier reflects a facility's redundancy and fault tolerance, with higher tiers offering greater reliability. For example, Tier I provides basic capacity with minimal backup (99.671% uptime), while Tier IV facilities are fully redundant, delivering 99.995% uptime.
Achieving higher tier classifications requires significant investment in backup generators, uninterruptible power supplies (UPS), and advanced cooling systems. In return, these facilities can charge higher rental rates, as tenants who rely on uninterrupted operations are willing to pay a premium. The Uptime Institute highlights this ongoing focus on reliability:
"The frequency and severity of data center outages remain mostly unchanged from 2023 or show small improvements. Operators are countering increases in complexity, density and extreme weather with investment and good management" [3].
For REITs, tier classification isn’t just a technical label - it’s a competitive edge that directly impacts tenant retention and pricing.
Power Usage Effectiveness (PUE) and Data Center Infrastructure Efficiency (DCiE)
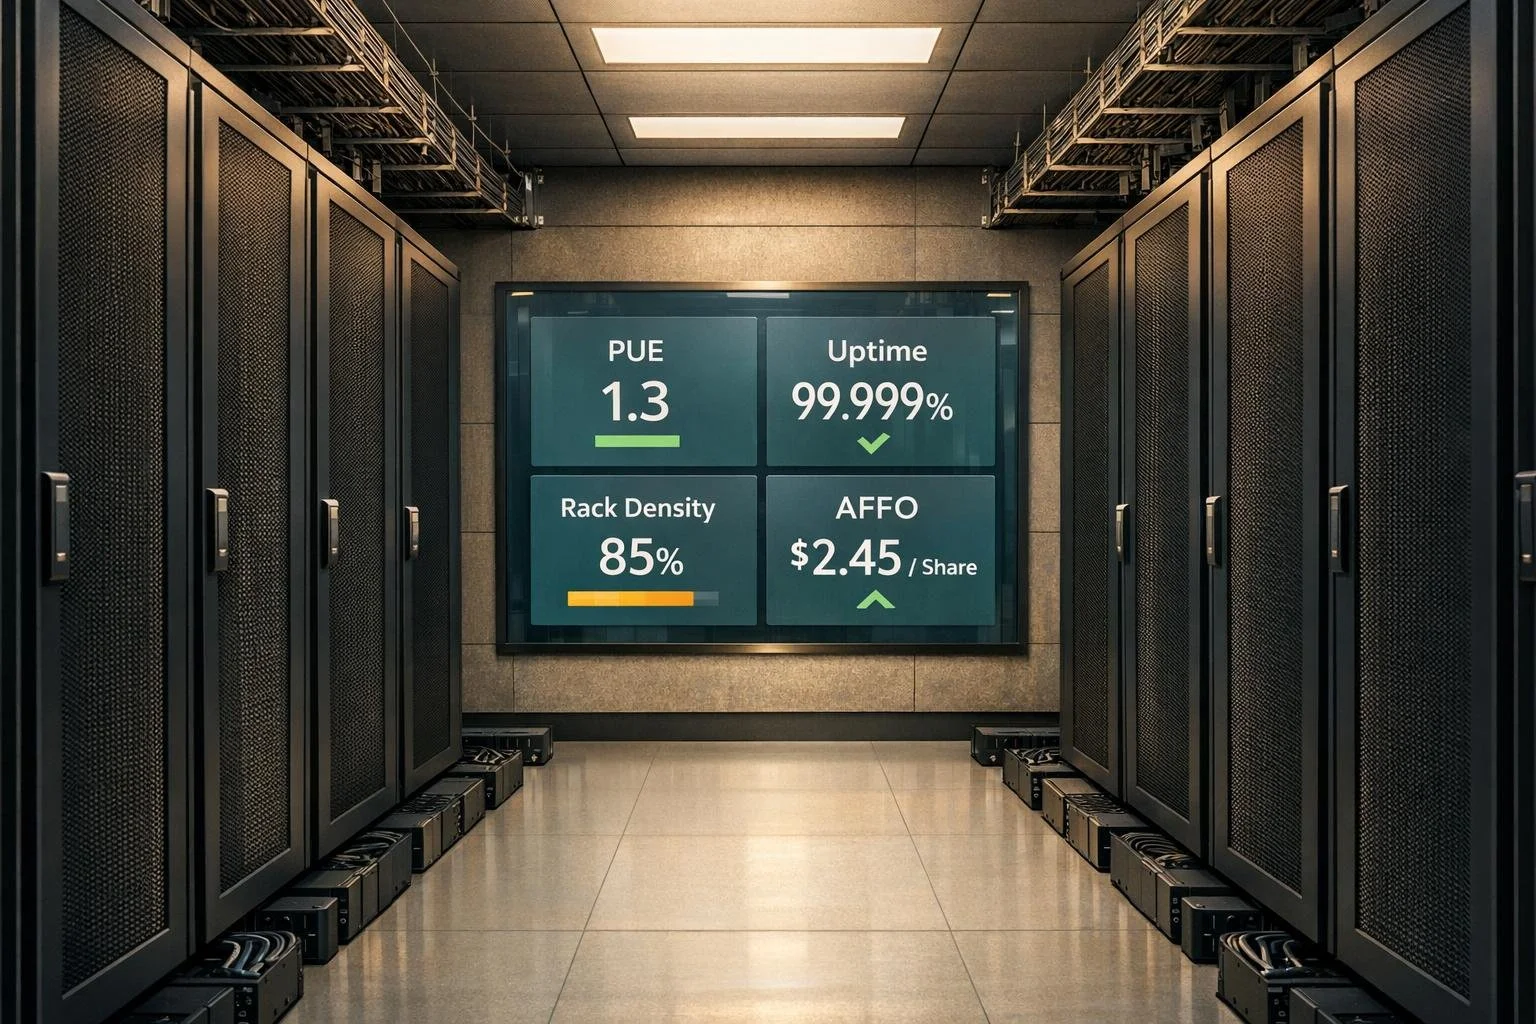
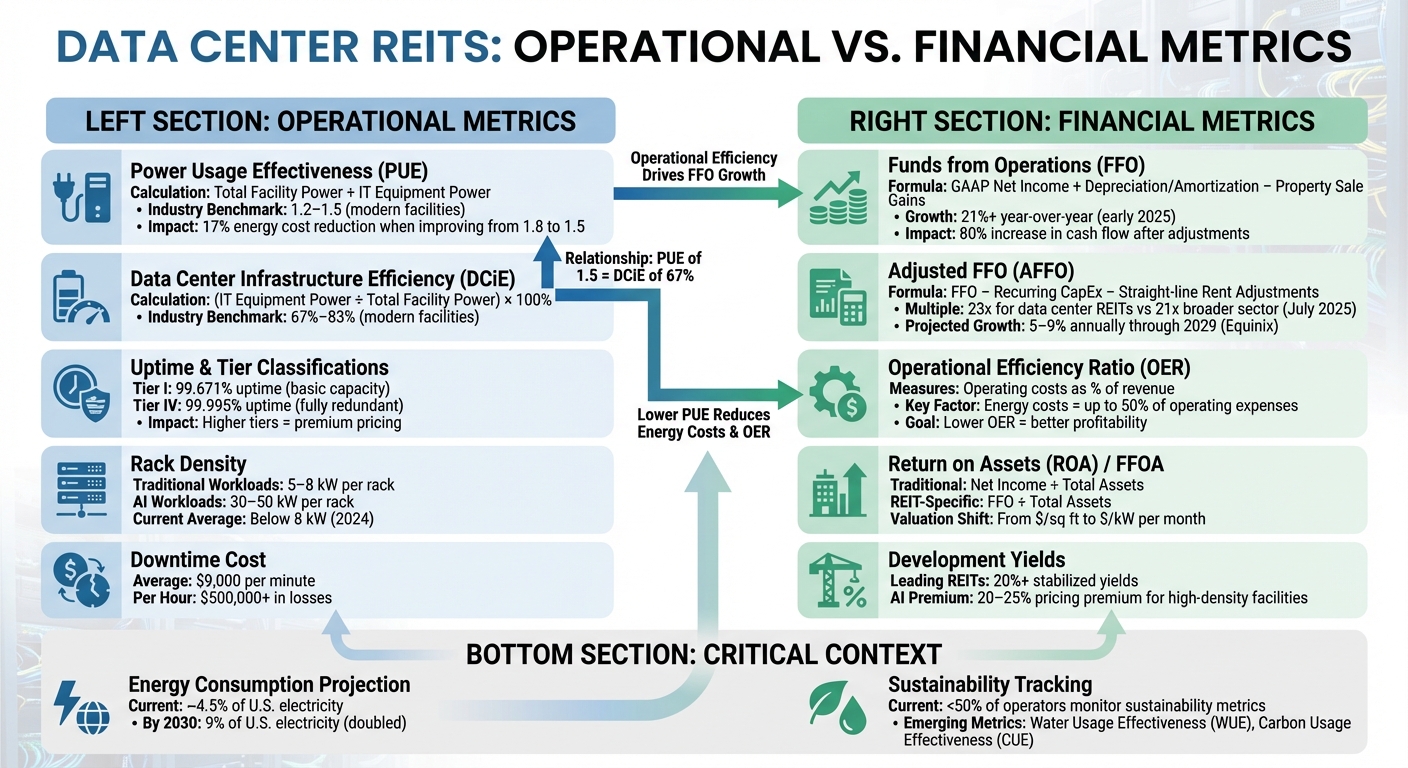
Power Usage Effectiveness (PUE) is the go-to metric for assessing energy efficiency in data centers. It’s calculated by dividing total facility power usage by the power consumed specifically by IT equipment. A perfect PUE of 1.0 is unattainable, but modern facilities often achieve PUE levels between 1.2 and 1.5. This means some energy is used for cooling, lighting, and other infrastructure.
Data Center Infrastructure Efficiency (DCiE) is the flip side of PUE, expressed as a percentage. For example, a PUE of 1.5 translates to a DCiE of around 67%, meaning two-thirds of the power supports IT equipment.
| Metric | Calculation | What It Measures | Industry Benchmark |
|---|---|---|---|
| PUE | Total Facility Power ÷ IT Equipment Power | Energy overhead ratio | 1.2–1.5 (modern facilities) |
| DCiE | (IT Equipment Power ÷ Total Facility Power) × 100% | Percentage of power reaching IT | 67%–83% (modern facilities) |
Even small improvements in PUE can lead to notable energy savings and increase net operating income (NOI).
Cooling and Rack Density Metrics
Energy efficiency isn’t the only priority - cooling performance and rack density are also critical for smooth operations. Rack density, measured in kilowatts per rack, shows how much computing power a facility can handle within its available space. While traditional workloads typically require 5–8 kW per rack, AI and other intensive applications are pushing this to 30–50 kW per rack. Despite this trend, most facilities in 2024 operate with densities below 8 kW [3].
Higher rack densities come with challenges, particularly in cooling. Advanced cooling methods like hot/cold aisle containment, precision cooling, or even liquid cooling are becoming essential. Water Usage Effectiveness (WUE), which tracks gallons of water used per kilowatt-hour of IT energy, is gaining attention as a complementary metric to PUE. This is especially important for facilities in water-scarce areas and for meeting environmental, social, and governance (ESG) goals.
However, fewer than 50% of data center operators currently monitor the specific metrics needed to assess sustainability or comply with upcoming regulations [3]. As computing demands grow - requiring more power per calculation - REITs face pressure to upgrade both their monitoring systems and physical infrastructure to stay ahead.
These metrics don’t just guide operational decisions - they directly influence financial performance, tenant satisfaction, and long-term competitiveness.
Financial Performance Metrics for Data Center REITs
Operational metrics like uptime and energy efficiency are vital for data center REITs, but the real test lies in financial performance. These metrics reveal whether a REIT can consistently pay dividends and grow shareholder value. Since standard net income doesn’t accurately reflect cash flows in this industry, specialized metrics are used to highlight its unique financial dynamics.
Funds from Operations (FFO) and Adjusted FFO (AFFO)
Funds from Operations (FFO) is the go-to metric for evaluating how well a REIT is performing. It adjusts GAAP net income by adding back depreciation and amortization and excluding one-time gains or losses from property sales [7][9]. This adjustment is crucial because depreciation, while treated as an expense in accounting, often doesn’t reflect the reality of appreciating property values. FFO, therefore, provides a clearer picture of the cash generated from operations.
For instance, one REIT reported an 80% increase in cash flow after making these adjustments, demonstrating how FFO better showcases operational performance.
Adjusted Funds from Operations (AFFO) takes FFO a step further. It accounts for recurring capital expenses - like replacing cooling systems or upgrading power infrastructure - and adjusts for straight-line rent, which smooths out lease payments over time rather than reflecting actual cash received [8][10]. As Investopedia puts it:
"AFFO is considered to be a more accurate measure of residual cash flow for shareholders than simple FFO... it provides for a more accurate base number when estimating present values and a better predictor of the REIT's future ability to pay dividends" [8].
Data center infrastructure, such as cooling and power systems, often requires replacement every 8–15 years - much sooner than the lifespan of other property types. In early 2025, data center REITs saw FFO growth of over 21% year-over-year [6]. By July 31, 2025, these REITs traded at a weighted average AFFO multiple of 23x, compared to 21x for the broader REIT sector [12]. Equinix, for example, projected annual AFFO per share growth of 5–9% through 2029, supported by an increase in annual capital expenditures to $4–5 billion, up from $3 billion, as announced at its June 2025 Analyst Day [12]. Meanwhile, Digital Realty Trust reported record bookings in Q3 2024, with over $500 million in revenue - half of it driven by AI-related demand [12].
By using FFO and AFFO, investors gain a clearer understanding of cash flow. To dive deeper into financial performance, the Operational Efficiency Ratio offers insight into cost control.
Operational Efficiency Ratio (OER)
The Operational Efficiency Ratio (OER) measures operating costs as a percentage of revenue, helping investors compare cost efficiency across REITs. This metric is particularly revealing for data centers, where energy costs dominate expenses. A lower OER indicates better cost management and higher profitability. However, comparing OERs requires careful consideration, as differences in how expenses are classified or how facilities are designed (e.g., redundant systems) can influence the ratio.
Return on Assets (ROA) and Funds from Operations per Asset (FFOA)
To assess asset performance, traditional metrics need a fresh perspective. Return on Assets (ROA) measures how effectively a REIT turns its asset base into income by dividing net income by total assets. But for REITs, standard ROA can be misleading due to the impact of depreciation. Funds from Operations per Asset (FFOA) addresses this by using FFO instead of net income, offering a clearer view of how much cash flow each dollar of assets generates.
In the data center world, valuation has shifted from traditional metrics like rent per square foot to power-based metrics - specifically dollars per kilowatt (kW) per month [6]. As SitusAMC explains:
"The center of gravity in valuation of data centers has moved from tenant diversification to power assurance" [6].
This shift means investors now focus on megawatts (MWs) rather than physical square footage. Facilities with secured power capacity through Power Purchase Agreements command premium valuations. Leading REITs report stabilized development yields exceeding 20% [12]. Additionally, the market is splitting between commodity facilities and specialized infrastructure for high-density AI workloads (30–50 kW per rack). The latter can charge pricing premiums of 20–25% [11]. This power-focused strategy is reshaping how portfolios are managed, moving away from square footage analysis to capacity-driven metrics that directly influence tenant satisfaction and long-term returns.
These financial metrics, combined with operational insights, are key to evaluating whether a data center REIT can stay competitive while delivering steady returns to its shareholders.
sbb-itb-99d029f
Tools for Tracking and Analyzing Metrics
Keeping tabs on operational and financial metrics across a data center REIT portfolio requires tools that transform raw data into actionable insights. The right systems can take information - like cabinet temperatures or power consumption - and convert it into metrics that improve operational efficiency and boost shareholder returns. These metrics also serve as the foundation for systems like DCIM, which provide real-time operational insights.
Data Center Infrastructure Management (DCIM) Systems
DCIM systems are at the heart of real-time operational monitoring. These platforms connect directly with data center equipment - such as cooling systems and power distribution units - to track energy usage, inventory, and capacity across IT and infrastructure systems [13]. With energy costs making up a large portion of overall expenses [11][2], detailed monitoring becomes essential for controlling costs.
Consider this: enterprise downtime costs companies an average of $9,000 per minute [11][2]. A single hour of downtime? That’s over $500,000 in losses. DCIM tools help prevent such scenarios by enabling capacity planning and identifying potential constraints before they become major issues [11].
How CoreCast Supports Portfolio Insights and Real-Time Metrics
While DCIM systems focus on facility-level operations, portfolio management platforms like CoreCast take a broader approach. They centralize both operational KPIs and financial data across multiple assets. By 2024, four of the five largest infrastructure investors globally are using similar platforms to manage granular data center KPIs and automate reporting workflows [2].
CoreCast provides an all-in-one solution for REIT managers, offering integrated maps to view properties and competitive landscapes, tools for portfolio analysis, and the ability to track key metrics like PUE, uptime, FFO, and AFFO - all in one place. For example, linking operational data (like cabinet temperatures) with financial systems can highlight when equipment is starting to degrade [2]. This helps CFOs strategically plan for costly upgrades before they become urgent.
Automated reporting is another game-changer. Instead of manually compiling data, CoreCast delivers real-time dashboards that make it easy to share insights with investment teams and limited partners. This feature is especially useful for portfolios that include a mix of brownfield and greenfield developments or span regions with varying power grid reliability. By consolidating all performance metrics into a single view, CoreCast simplifies decision-making.
Integrating Property Management Systems
Bringing together DCIM, portfolio, and property management systems requires collaboration across multiple teams [13]. The objective? Go beyond high-level metrics to achieve system-level monitoring with the precision needed to fine-tune equipment and optimize settings [13]. Integrated systems don’t just provide real-time dashboards - they extend these insights into property management operations.
Integration also needs to address the growing importance of sustainability. Metrics like Carbon Usage Effectiveness (CUE) and Water Usage Effectiveness (WUE) have shifted from being optional to becoming key factors in asset valuation [11]. Adopting industry-standard frameworks, such as ISO/IEC 30134 for carbon and energy tracking, ensures that metrics are comparable across peers [14].
To get started, conducting an energy audit is essential to establish a baseline for performance [13]. Additionally, training staff ensures they can effectively use these new metrics to identify opportunities for improving energy efficiency [13]. These steps help create a seamless system that aligns operational goals with sustainability and financial performance.
Best Practices for Improving Metrics
When it comes to enhancing performance metrics, focusing on systematic benchmarking and standardization is essential for meaningful progress.
Benchmarking Against Industry Standards
Comparing your data center's performance to industry benchmarks can highlight both strengths and areas for improvement. For example, standardizing Power Usage Effectiveness (PUE) measurements using tools like the EPA's ENERGY STAR Portfolio Manager ensures consistent energy performance evaluations, regardless of facility size or location [15][5].
Interestingly, average PUE levels have stayed flat for five years as of mid-2024 [3]. While newer, larger facilities have made strides in efficiency, older sites are slowing overall progress [3]. To get a clearer picture of sustainability, modern benchmarking should include metrics like the Energy Reuse Factor (ERF), Scope 3 carbon accounting, and water consumption [1]. However, fewer than half of data center operators currently track these broader sustainability metrics [3].
Benchmarking shouldn't stop at the facility level. IT equipment efficiency plays a huge role in overall energy consumption, with savings cascading across the entire infrastructure [4]. Tools like DC Pro, PUE Estimator, and air management assessment tools can help identify energy-saving opportunities in key systems like transformers, UPS units, and cooling systems - all without compromising the thermal environment for IT equipment [4].
By expanding benchmarks to include these areas, data centers can address efficiency challenges more effectively.
Segment-Specific Metrics for Hyperscale, Colocation, and Edge Data Centers
Different types of data centers face unique challenges. Hyperscale facilities, for example, are built for high efficiency and can justify investments in advanced cooling systems or onsite power generation. Colocation providers, on the other hand, must balance efficiency with the flexibility to meet the diverse needs of their tenants. While the industry average for server rack densities remains below 8 kW [3], colocation sites often see greater variability depending on their tenant mix.
Edge data centers, typically smaller and more dispersed, have their own hurdles. Here, uptime is critical and often prioritized over traditional efficiency metrics. The rising demand for compute-intensive tasks, driven in part by AI, is also putting added pressure on existing power and cooling systems [3]. With 55% of workloads now hosted off-premises, the shift toward hybrid architectures is reshaping operational priorities [3].
For REITs managing a portfolio across these segments, it's essential to standardize metrics while acknowledging the unique realities of each type. A Master List of Efficiency Actions can help enforce consistent best practices in areas like cooling and air management [4].
Adapting benchmarks to fit the specific needs of different data center types allows for more accurate operational comparisons.
Standardizing Operational Efficiency Ratios (OER) for Peer Comparison
Standardizing Operational Efficiency Ratios (OER) is critical for fair performance comparisons across REITs. Inconsistent calculation methods currently make such comparisons unreliable. Adopting global protocols for metrics like PUE and leveraging standardized tools like the DOE's Energy Assessment Worksheet can help document metrics and actions consistently across assets [15][4].
It's also important to differentiate between IT efficiency and infrastructure efficiency. Diagnostic tools can help pinpoint whether inefficiencies stem from infrastructure systems or tenant hardware [4]. For instance, if a facility has a high PUE despite optimized cooling, the problem might lie in outdated IT equipment or inefficient utilization practices. Tracking energy and cost savings across the entire power chain - from transformers to UPS systems - provides a more comprehensive view. Strategies like enabling UPS "ecomode" and optimizing load factors can directly enhance efficiency [4].
With data centers projected to consume up to 9% of U.S. electricity by 2030 - more than double current levels - regular energy assessments and robust OER tracking are essential for staying competitive and demonstrating operational excellence to investors [1].
Conclusion and Key Takeaways
Keeping a close eye on operational metrics isn't just a good practice - it’s a necessity. With data centers potentially consuming up to 9% of total U.S. electricity by 2030 - more than double today’s levels - the pressure to improve efficiency is mounting [1]. Considering that energy costs can account for as much as 50% of a data center's operating expenses, even small improvements in Power Usage Effectiveness (PUE) can lead to substantial savings. For instance, refining PUE from 1.8 to 1.5 could result in a 17% reduction in energy costs [11].
This guide connects operational metrics to their financial implications. Metrics like PUE, Funds From Operations (FFO), Adjusted Funds From Operations (AFFO), and Operational Efficiency Ratio (OER) are key to understanding both operational and financial health. FFO and AFFO, in particular, provide a clearer view of sustainable cash flow than traditional net income, which is essential for maintaining dividends and investor trust [11]. Meanwhile, standardizing OER allows for meaningful comparisons across the industry and highlights operational performance in a competitive landscape.
Reliability is another critical factor. The cost of enterprise downtime, averaging nearly $9,000 per minute, underscores the financial risks of outages [2]. Monitoring uptime alongside efficiency metrics ensures that cost savings don’t compromise reliability. This balance is becoming even more vital as AI-driven workloads push rack densities from under 8 kW to as high as 30–50 kW per rack [2][3].
Modern tools are stepping in to support these efforts. Platforms like CoreCast streamline data center operations by centralizing KPIs, automating reports, and uncovering opportunities in real time. By integrating functions like underwriting, pipeline tracking, portfolio analysis, and stakeholder reporting into a single platform, CoreCast eliminates inefficiencies that can slow down decision-making.
The data center industry stands at a pivotal moment. With AI driving up power demands, sustainability metrics becoming mandatory, and regulations tightening, there’s no room for complacency [1]. REITs that prioritize advanced tracking systems and consistent benchmarking will be better positioned to attract top-tier clients, secure advantageous financing, and deliver strong returns in an increasingly challenging market.
FAQs
How do AI workloads affect data center REIT performance metrics?
AI workloads are reshaping the performance metrics of data center REITs, largely because of their hefty power requirements and infrastructure needs. Advanced applications like machine learning and deep learning models depend on high-performance GPUs and specialized hardware, which can use up to ten times more energy than standard servers. This spike in energy consumption directly impacts critical metrics, including power utilization effectiveness (PUE) and overall energy efficiency - two key indicators of operational performance and sustainability.
The growing energy demands tied to AI also drive up operating costs and amplify the importance of sustainability metrics, which are increasingly scrutinized by both investors and regulators. To keep up with AI-driven operations, data centers are upgrading their network infrastructure to meet high-bandwidth and low-latency demands. These upgrades affect metrics related to network performance and resilience. As a result, factors like power capacity, cooling systems, and long-term adaptability are now vital when evaluating data center REITs.
Why are FFO and AFFO used instead of net income to evaluate data center REITs?
When evaluating data center REITs, Funds From Operations (FFO) and Adjusted Funds From Operations (AFFO) are essential tools. Why? Because they offer a clearer and more reliable picture of a REIT's cash flow and overall performance compared to traditional metrics like net income.
Unlike net income, FFO excludes non-cash expenses such as depreciation and amortization, which can skew the financial representation of real estate assets. It also removes gains or losses from property sales, focusing instead on recurring income - giving investors a better understanding of the REIT's ongoing operations.
AFFO takes this analysis even further. It adjusts for maintenance costs and capital expenditures, providing a sharper view of the REIT's sustainable income. This added layer of detail helps investors evaluate how well a REIT can generate consistent cash flow and maintain its ability to pay dividends over the long term.
How do DCIM systems improve the efficiency of data centers?
Data center infrastructure management (DCIM) systems play a crucial role in boosting the efficiency of data centers by providing a comprehensive view of operations, energy consumption, and resource distribution. These systems enable operators to track real-time metrics such as power usage, cooling performance, and the efficiency of IT equipment, making it easier to pinpoint and resolve inefficiencies swiftly.
DCIM tools also monitor critical efficiency metrics like Power Usage Effectiveness (PUE), Cooling Efficiency Ratio (CER), and Energy Reuse Effectiveness (ERE). By analyzing these figures, operators can fine-tune energy consumption, enhance cooling methods, and minimize waste. This not only cuts costs but also aligns with sustainability objectives. Moreover, DCIM systems improve reliability and help ensure compliance with environmental regulations, making them indispensable for today’s data center management.