
Checklist for Correlating Economic Data with CRE Trends

Economic data can help you make smarter decisions in commercial real estate (CRE). By understanding how indicators like GDP, interest rates, inflation, and employment trends impact vacancy rates, rental income, and property values, you can reduce risks and improve timing. Here's a quick breakdown:
- Key Metrics to Watch: GDP growth, 10-Year Treasury Yield, Consumer Price Index (CPI), unemployment rates, and Manufacturing PMI.
- Property-Specific Insights: Industrial properties align with production data, retail depends on consumer spending, multifamily responds to housing starts, and office spaces correlate with employment trends.
- Data Sources: Use tools like FRED, BLS, Census Bureau, and the Atlanta Fed's CREMI for reliable insights.
- Steps to Analyze:
- Identify relevant indicators.
- Organize data by geography and asset type.
- Use models like regression or SARIMAX to find correlations.
- Separate leading indicators (e.g., housing starts) from lagging ones (e.g., inflation).
- Validate and interpret results for actionable strategies.
- Visualization: Simplify findings with clear charts and dashboards tailored to stakeholders.
Use platforms like CoreCast to track and analyze data in real-time, ensuring your strategies stay aligned with market shifts.
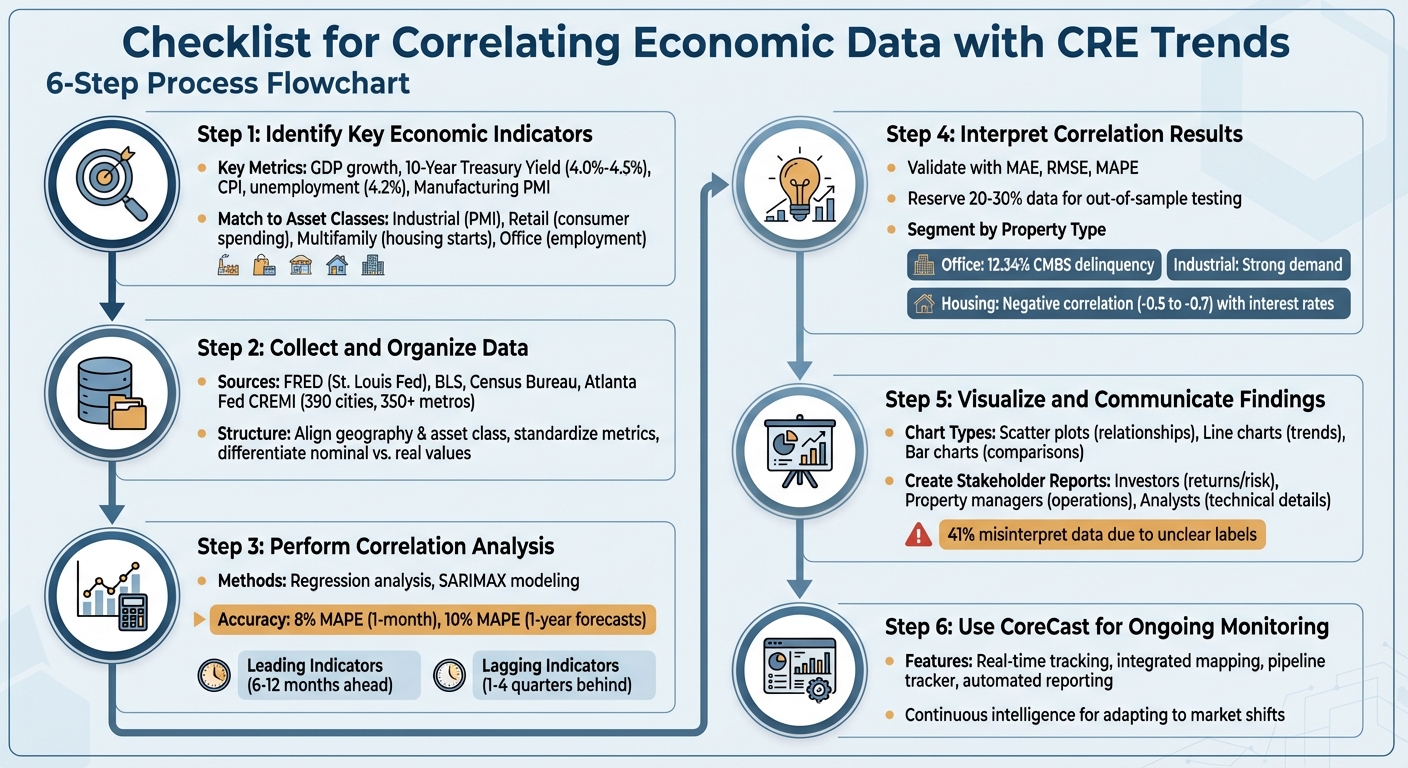
6-Step Process for Correlating Economic Data with Commercial Real Estate Trends
How Will CRE Sectors Perform in 2026, According to CBRE? | Henry Chin & Matthew Kaufman
sbb-itb-99d029f
Step 1: Identify Key Economic Indicators
Start by pinpointing the economic indicators that have the greatest influence. Not all metrics affect the market equally - some directly impact property values, while others lag behind. Your focus should be on the data that genuinely drives changes in your specific market.
Core Economic Metrics to Watch
GDP growth is the broadest indicator of economic health. It plays a significant role in shaping demand and value in commercial real estate (CRE) [1][4].
Interest rates, particularly the 10-Year U.S. Treasury Yield, are critical for commercial mortgage rates and cap rate pricing [5]. As of early 2026, the 10-year Treasury yield is projected to stabilize between 4.0% and 4.5% [5]. Higher rates lead to increased borrowing costs and can push cap rates for core assets into the 6% to 7.5% range [5].
Inflation metrics - such as the Consumer Price Index (CPI), Personal Consumption Expenditures (PCE), and Producer Price Index (PPI) - affect property cash flows by influencing both revenues and expenses [3]. For example, inflation surged to 9.1% in 2022, which contributed to a 30% decline in real estate loan applications due to affordability issues [6]. Additionally, property insurance costs in major markets have climbed 20% to 50% as of early 2026 [5]. This type of "operating inflation" can erode net operating income (NOI), even if headline CPI begins to cool.
Employment trends are another key driver, influencing demand across multiple asset types. Job growth boosts office and multifamily demand, while rising unemployment often signals defaults and reduced consumer spending [3][4][6]. For instance, the U.S. unemployment rate stood at 4.2% in May 2025 [2]. Meanwhile, Manufacturing PMI serves as a leading indicator for industrial real estate - higher levels suggest increased production and greater warehousing needs [3].
By understanding these metrics, you can align them with specific property types to sharpen your market analysis with real-time analytics.
Matching Metrics to Asset Classes
To gain deeper insights, tailor your chosen indicators to the unique characteristics of each asset class. Each property type responds to different economic drivers.
- Industrial properties: These are closely tied to Manufacturing PMI, e-commerce sales, and freight indices like the Cass Freight Index, which reflect production levels and demand for warehouse space [3].
- Retail assets: Keep an eye on the Advance Monthly Retail Trade Survey (MARTS) and consumer spending habits, which gauge demand for goods and services [3]. The Consumer Confidence Index (CCI) is also important, as higher optimism often translates to stronger retail sales [6].
- Multifamily investments: Metrics like housing starts, apartment vacancy rates, and median home prices offer insights into the supply pipeline and the balance between rental demand and homeownership [3].
- Office properties: These rely heavily on employment trends within specific industries, jobless claims, and the Small Business Optimism Index, which reflect business growth and office space utilization [3].
Understanding these asset-specific relationships ensures you avoid the pitfall of applying broad metrics to property types that require more focused analysis.
Step 2: Collect and Organize Data
After pinpointing the right indicators, the next move is gathering reliable data and organizing it systematically. Without dependable data or consistent formatting, your analysis can quickly fall apart.
Where to Find Reliable Data
Start with Federal Reserve Economic Data (FRED), provided by the St. Louis Fed. FRED consolidates data from multiple sources - like the Consumer Price Index, GDP, unemployment rates, and interest rates - into a single, user-friendly database [7][14]. This simplifies time-series comparisons and saves you from hopping between numerous websites.
For labor market data, head to the U.S. Bureau of Labor Statistics (BLS). As of February 2026, the BLS reported a U.S. unemployment rate of 4.4%, alongside a monthly payroll employment drop of 92,000 [9][11][12]. The BLS also provides metrics like average hourly earnings and the Producer Price Index (PPI) [9][12].
If you're looking at housing and construction trends, the U.S. Census Bureau is your go-to. Their "Economic Briefing Room" offers high-frequency data like housing starts, building permits, retail sales, and business formations [10]. They also produce the Index of Economic Activity (IDEA), which combines 15 key economic data series into a single time series, making it easier to spot overarching trends [10].
For commercial real estate (CRE) insights, check out the Federal Reserve Bank of Atlanta's Commercial Real Estate Market Index (CREMI). This index links local economic data - such as unemployment and sector-specific employment - with CRE metrics like occupancy, cap rates, and absorption for nearly 390 U.S. cities [13]. Covering 350+ metro areas and five major property types (hospitality, industrial, multifamily, office, and retail), CREMI is a valuable tool [13]. Additionally, the Federal Reserve Board provides the Senior Loan Officer Opinion Survey, a key indicator of CRE investment trends [8].
| Source | Key Data Series Relevant to CRE | Frequency |
|---|---|---|
| BLS | Payroll Employment (by sector), Unemployment, CPI, PPI | Monthly [12] |
| Census Bureau | Housing Starts, Building Permits, Retail Sales, Construction Spending | Monthly [10] |
| Federal Reserve | Interest Rates (H.15), Bank Lending Surveys, Consumer Credit | Varies [8] |
| Atlanta Fed | CREMI (Occupancy, Cap Rates, NOI Index, Absorption) | Quarterly [13] |
| St. Louis Fed | FRED (Aggregated GDP, Bond Yields, SOFR) | Daily/Monthly [7] |
Once you've gathered data from these trusted sources, the next step is to organize it for analysis.
Structuring Data for Analysis
Proper organization is key to making your data work for you. Start by aligning geography and asset class. For instance, if you're analyzing office properties in Austin, Texas, ensure that both "Office Employment" and "Office Occupancy" data pertain to the same metro area [13].
Standardizing metrics is another critical step. Indices like CREMI and IDEA use a zero baseline, which represents the long-term average. This makes it easy to see whether a market is performing above or below its historical norm [10][13]. In such indices, roughly 68% of values typically fall within one standard deviation (+1 to -1) of the average [13].
Make sure to differentiate between nominal and real values. Real (inflation-adjusted) figures provide a clearer picture of economic growth, while nominal values can sometimes mislead [15]. Also, check if the data is seasonally adjusted to account for predictable fluctuations [10][15]. Tools like the FRED Excel add-in can automate updates and reduce errors from manual data entry [15].
Lastly, cross-validate your sources to ensure accuracy. Review the methodology behind each dataset to understand how the information was collected and calculated [1]. Double-check official definitions, as government terminology may not always align with industry standards [15].
Step 3: Perform Correlation Analysis
Now that your data is clean and well-organized, it's time to examine how economic indicators interact with commercial real estate (CRE) performance. This step helps uncover which metrics align closely and which ones might signal future changes.
Tools and Methods for Calculating Correlations
A great starting point for this analysis is regression analysis. For instance, you can use a simple equation like:
CRE Value = β₀ + β₁ × GDP Growth + ε [1].
This formula demonstrates how property values could shift with changes in GDP growth.
For a deeper dive, SARIMAX modeling offers a more advanced approach. This method builds on ARIMA by incorporating external economic factors, such as employment rates or interest rates [16]. Between 2003 and 2015, analysts used the Prophet forecasting model on NYC Department of Finance property sales data, achieving impressive accuracy - 8% Mean Absolute Percentage Error (MAPE) for one-month predictions and 10% for one-year forecasts [16].
Before running any correlations, it’s crucial to test for stationarity. This ensures your data maintains consistent statistical properties over time. If stationarity issues arise, techniques like differencing or detrending can help [16].
As data scientist Indraneel Dutta Baruah emphasizes:
How well we clean and understand the data has a tremendous impact on the quality of the results [16].
It’s worth noting that poor data quality contributes to about 62% of forecasting errors in real estate. However, companies that prioritize data quality can reduce these errors by 37% [16]. To ensure accuracy, validate your models using metrics like MAE (Mean Absolute Error), RMSE (Root Mean Square Error), and MAPE [16]. Also, select models that suit your data: ARIMA works for simple trends, SARIMA is better for seasonal patterns, and SARIMAX excels when external economic indicators are involved [16].
Once you’ve established your models, the next challenge is identifying which indicators signal upcoming changes and which confirm past trends.
Finding Leading and Lagging Indicators
Leading indicators often shift 6–12 months before broader market changes [17]. Examples include housing starts, auto sales, stock prices, and the yield curve. These metrics are closely watched to predict future demand and price movements [17]. On the other hand, lagging indicators like GDP growth and inflation reflect trends that have already occurred, typically shifting 1–4 quarters after the market moves [17].
To differentiate between these types, compare the timing of their movements. A strong leading indicator will consistently peak or dip months ahead of CRE metrics [17], while lagging indicators align more with past economic activity [17]. For example, the yield curve and money supply are often used to predict turning points in the U.S. economy [17]. Using cross-validation techniques like rolling windows or walk-forward validation can further enhance the reliability of your forecasts [16].
Here’s a quick summary of the timing and application of different indicators:
| Indicator Type | Examples | Typical Timing |
|---|---|---|
| Leading | Housing starts, auto sales, stock prices, yield curve | 6–12 months before market shift |
| Coincident | Industrial production, personal income, employment rates | Moves with the economy |
| Lagging | Unemployment rate, CPI (inflation), interest rates | 1–4 quarters after market shift |
Step 4: Interpret Correlation Results
Once you’ve completed your correlation analysis, the next step is to transform those numbers into actionable investment strategies. This is where you move beyond simply crunching data and start uncovering insights that can drive real market decisions.
Reading Trends and Spotting Outliers
First, determine whether your correlations are statistically significant. Metrics like Mean Absolute Error (MAE), Root Mean Squared Error (RMSE), and Mean Absolute Percentage Error (MAPE) are essential for gauging accuracy [16]. A correlation might appear strong, but without proper validation, you risk chasing patterns that don’t hold up under scrutiny.
To ensure reliability, set aside 20–30% of your most recent data for out-of-sample testing. This step helps confirm whether the correlation remains valid for unseen data [16]. It’s the difference between identifying a theoretical pattern and one that reliably predicts market behavior.
Be cautious of outliers that can skew results. For example, a federal shutdown once disrupted available data [18]. Similarly, the 50% tariff on steel and aluminum in 2025 caused construction costs to surge, breaking historical correlations [18]. Such anomalies can distort the true picture of market fundamentals.
Another key metric to monitor is effective rent versus asking rent. Effective rent accounts for concessions like free rent periods, giving a clearer view of actual cash flow [19]. If asking rents appear stable while effective rents decline, it could signal hidden market weakness.
The bid-ask spread is another critical indicator. A narrow spread suggests market confidence, while a wider spread reflects uncertainty, which can undermine the reliability of your correlations [19]. Combine this data with your correlation findings to assess whether market conditions are favorable for decisive action.
These techniques help you dig deeper into the data, setting the stage for nuanced insights into how different property types react to economic changes.
Impact Analysis by Property Type
Beyond validating correlations, it’s essential to segment your analysis by asset class to uncover actionable insights. Each property type responds differently to economic indicators, making segmentation key to understanding market dynamics.
Take the office sector, for example. It’s currently experiencing a sharp divide: high-quality, amenity-rich spaces in areas like Midtown Manhattan are achieving record rents, while lower-quality buildings face obsolescence [18][20]. As Burke Davis, Head of Real Estate Banking at J.P. Morgan, explains:
High-quality office space has good demand from end users. Lower quality space is at risk of obsolescence [18].
This means a broad correlation between employment rates and office demand won’t tell the full story. You need to break it down by building quality and submarket to make informed decisions.
Meanwhile, industrial properties continue to thrive, bolstered by e-commerce growth and nearshoring trends [18][20]. Unlike office spaces, the correlation between GDP growth and industrial demand remains strong. However, office properties saw a CMBS delinquency rate of 12.34% in January 2026 [22], highlighting the need for deeper analysis in that sector.
Housing prices, on the other hand, show a negative correlation with interest rates, typically ranging from -0.5 to -0.7 [21]. But this relationship can weaken in properties with long-term fixed leases, where rising inflation doesn’t translate into higher rents due to lease restrictions [3].
For retail properties, look beyond broad economic indicators and use tools like the Trade Area Power (TAP) Score. This metric combines local demographics - such as income and education levels - within a specific radius to give a more focused view of market potential [19]. For example, industrial markets along the I-35 corridor, including Dallas and Kansas City, are benefiting from increased trade with Mexico and Canada [2]. This highlights how regional trade policies can create correlations that national data might miss.
Finally, adjust market cap rates for Capital Expenditures (CapEx) to calculate economic cap rates [19]. This approach provides a clearer picture of long-term ownership costs, which is especially important when comparing high-maintenance sectors like office properties to lower-maintenance ones like self-storage.
To make correlations actionable, always cross-check statistical models with local market insights, such as policy changes and supply constraints [16]. A strong correlation only becomes valuable when paired with an understanding of what’s happening on the ground in your target markets.
Step 5: Visualize and Communicate Findings
Once you've interpreted your correlation results, the next step is to present them in a way that inspires action. Raw data alone often fails to resonate - people connect better with visuals that simplify and clarify complex information. Building on the insights from Step 4, your focus now shifts to turning data into visuals that are clear and actionable.
Building Charts and Dashboards
Choosing the right chart type is crucial to telling your data's story effectively. For example:
- Scatter plots: Highlight relationships, like the correlation between square footage and rental income.
- Line charts: Show trends over time, such as quarterly occupancy rate changes.
- Bar charts: Compare categories, like cap rates across various office buildings.
Stick to one key metric per chart to avoid overwhelming your audience. If you're analyzing multiple correlations - say, GDP growth versus industrial demand or interest rates versus multifamily rents - create a series of linked charts rather than cramming everything into one.
When designing your visuals, keep them simple and easy to interpret. Use 2D visualizations over 3D ones, as the latter can distort scale and obscure details. Limit your color palette to 6–8 shades, steering clear of combinations that are hard to distinguish.
Clarity is essential. Always include descriptive labels that provide context. For instance, instead of a generic title like "Office Rental Rates", go for something specific like "2025 Average Office Rental Rates by City ($/SF)." Label every axis with appropriate units, and ensure legends clearly define colors or patterns. This attention to detail matters - 41% of business professionals have misinterpreted data visuals due to unclear or missing labels. One notable example occurred in 2022 when a dashboard without a Y-axis label led investors to confuse cash flow figures (in thousands) with net operating income (in millions), causing temporary investor confusion [23].
Edward R. Tufte, a renowned expert in data visualization, emphasized this point:
Graphical excellence is that which gives to the viewer the greatest number of ideas in the shortest time with the least ink in the smallest space [23].
Before finalizing your visuals, test them with someone unfamiliar with the data to ensure they’re intuitive. Once your charts and dashboards effectively communicate your insights, it’s time to compile them into reports.
Creating Reports for Stakeholders
With your visuals ready, the next step is to tailor them into reports that meet the needs of your audience. For example:
- Investors: Focus on returns, risk exposure, and metrics like cap rate comparisons or portfolio diversification.
- Property managers: Highlight operational insights, such as occupancy trends and maintenance cost forecasts.
- Analysts: Provide technical details, including correlation coefficients, statistical significance, and methodology.
Tools like CoreCast simplify this process. CoreCast allows you to generate branded reports directly from your analysis, summarizing key findings for distribution to investors, partners, and other stakeholders. You can seamlessly integrate correlation analysis with real-time market data, property-level performance metrics, and competitive insights. This approach not only delivers a polished report but also provides a comprehensive view of how economic factors influence your portfolio and where new opportunities might emerge.
Step 6: Use CoreCast for Ongoing Monitoring

Delivering reports is just the beginning - keeping your analysis relevant as the economy shifts is where the real challenge lies. Factors like interest rates, employment numbers, and GDP are constantly changing, which can make static reports feel outdated almost immediately. To stay ahead, you need a way to monitor these changes continuously. That’s where CoreCast comes in. It transforms correlation analysis from a one-time task into an ongoing intelligence system, providing real-time insights into both economic indicators and CRE (commercial real estate) performance. This approach ensures your strategy stays adaptable and informed.
Monitoring Economic and CRE Data in CoreCast
CoreCast simplifies your workflow by consolidating everything onto a single platform. Instead of juggling spreadsheets and multiple tools, you can track economic indicators and property metrics all in one place. One standout feature is its integrated mapping tool, which allows you to visualize your portfolio geographically. This makes it easier to detect regional trends, like how rising unemployment in certain metro areas might lead to lower retail occupancy rates.
The platform also includes a pipeline tracker to monitor deals as they progress through different stages. On top of that, portfolio analysis tools let you compare performance across various asset classes. For example, you can keep an eye on interest rate changes and multifamily cap rates to get a real-time picture of how your properties are performing.
Making Better Decisions with CoreCast
CoreCast’s tools don’t just stop at monitoring - they help you turn insights into actionable decisions. For instance, when evaluating a new property, you can reference how similar assets fared during economic shifts. You can also review competitive properties directly on the platform’s map and analyze patterns across your entire portfolio.
Another key feature is the stakeholder center, which simplifies communication with investors and partners. Instead of manually updating reports every quarter, you can automate them to show how your correlation analysis impacts portfolio performance. These reports highlight how factors like GDP growth, employment trends, or interest rate changes are influencing returns.
As the economy evolves, CoreCast helps you pivot quickly. Whether you’re shifting focus between asset classes, tweaking underwriting assumptions, or spotting new market opportunities before others, the platform ensures you’re always ready to adapt.
Conclusion
Connecting economic data with commercial real estate trends doesn’t have to be overwhelming. By sticking to a clear checklist - and using tools like CoreCast for real-time insights - you can turn complex data into smarter investment choices.
This method ties together data analysis and timely decision-making. The secret to staying ahead of market shifts lies in tracking how macroeconomic factors influence property performance. Recognizing these connections lets you adapt your strategy before market changes take full effect.
CoreCast simplifies this process by acting as a continuous intelligence platform. It keeps tabs on interest rates, employment trends, and portfolio performance in real time, all while offering features like integrated mapping, pipeline tracking, and automated reporting. Economic indicators become your guide, helping you spot trends early and navigate your investments with confidence. Whether it’s assessing how e-commerce growth shapes industrial demand or how inflation impacts multifamily returns, this approach ensures your decisions are grounded in data, not guesswork. The top-performing professionals aren’t necessarily more intelligent - they’re just better at linking economic insights to property fundamentals. Use these strategies to fine-tune your approach today.
FAQs
How do I pick the right economic indicators for my asset type?
When analyzing your commercial real estate (CRE) segment, it’s crucial to start with macroeconomic factors that shape the market. For example, GDP growth can give you a sense of overall market health, while occupancy rates highlight demand trends specific to your sector.
To dig deeper, focus on indicators tailored to your asset type and location. If you're working with multifamily properties, metrics like rent growth and vacancy rates can be especially telling. For retail spaces, consumer spending trends or foot traffic data might be more relevant.
By incorporating data like cap rates and rental price trends, you can refine your understanding of market demand, assess risks, and anticipate shifts. This kind of targeted analysis can make your investment decisions sharper and more informed.
How can I tell if an indicator is leading or lagging for CRE?
Economic indicators are crucial tools for understanding trends in the commercial real estate (CRE) market. They fall into three main categories: leading, lagging, and coincident indicators.
Leading indicators are forward-looking metrics that hint at where the economy might be headed. For example, new housing starts can serve as an early signal of potential shifts in the CRE market, offering insights into future demand and investment opportunities.
Lagging indicators, on the other hand, confirm trends that have already occurred. Data like GDP growth reflects past economic performance, helping to validate previous market conditions and decisions.
Coincident indicators provide a snapshot of current economic activity. Metrics such as employment rates reveal the present state of the economy, offering context for real-time decision-making.
In the CRE sector, paying close attention to leading indicators is critical for staying ahead of market trends. Meanwhile, lagging indicators serve as a useful tool to confirm and analyze historical performance. By balancing both, investors and professionals can make more informed decisions.
How do I avoid mistaking correlation for causation in my model?
Correlation highlights a relationship between two variables, but it doesn't prove that one directly causes the other. To uncover causation, you need to dig deeper. Methods like experimental testing, controlling for confounding variables, or analyzing time-lagged data can help establish a clearer link.
Even when correlations appear strong, they don’t automatically confirm causation. It's crucial to validate your conclusions and explore the underlying mechanisms driving the data - especially when applying these insights to real estate models.