
Data Centers vs. Traditional CRE Valuation
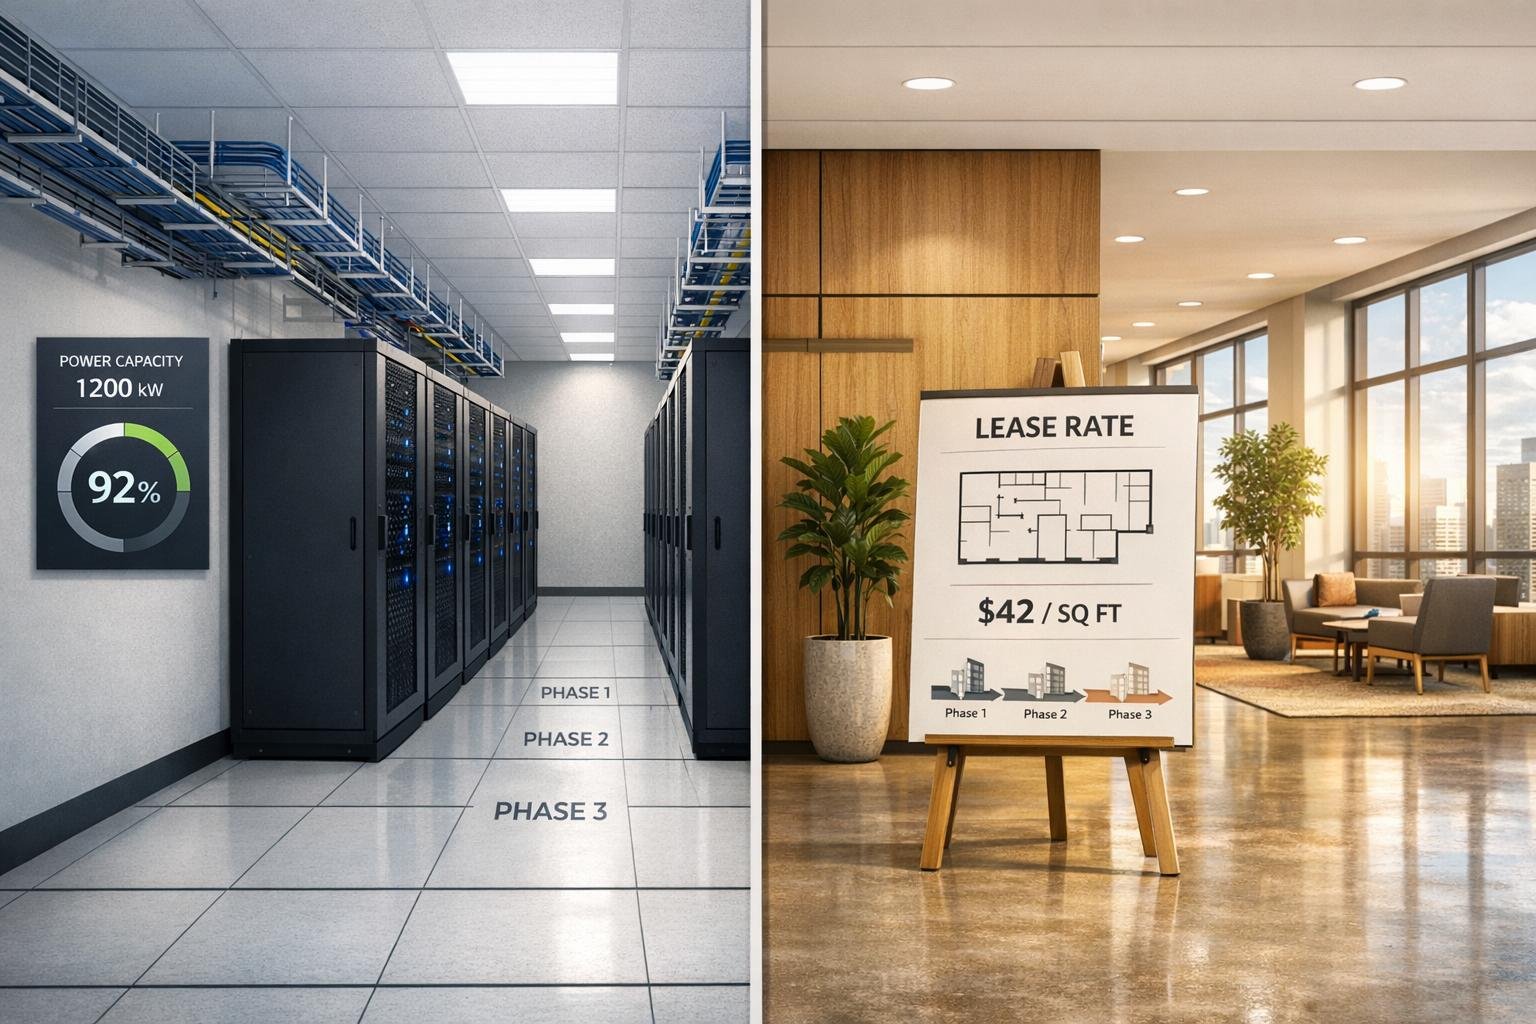
Data centers and commercial real estate (CRE) are valued using entirely different metrics because they serve different purposes. While CRE relies on square footage for pricing and valuation, data centers focus on power capacity (measured in kilowatts). This shift means revenue for data centers grows gradually as tenants activate power, unlike CRE, where rent begins immediately upon occupancy.
Key differences include:
- Valuation Metrics: CRE uses $/sq ft, while data centers use $/kW.
- Revenue Models: Data center revenue depends on power usage, not leased space.
- Operating Costs: Data centers’ largest expense is utilities, tied to power consumption, whereas CRE costs scale with leased space.
- Risk Factors: Data centers face risks like power delays and technological obsolescence, while CRE risks include vacancy rates and tenant credit.
Quick Comparison:
| Aspect | Data Centers | Commercial Real Estate |
|---|---|---|
| Pricing Metric | $/kW (power capacity) | $/sq ft (square footage) |
| Revenue Start | Phased with power activation | Immediate upon tenant move-in |
| Largest Expense | Utilities (power consumption) | Maintenance, property taxes |
| Tenant Profile | Hyperscalers, colocation providers | Diverse industries |
| Risk | Power delays, tech obsolescence | Vacancy, tenant creditworthiness |
Data centers demand specialized valuation models due to their reliance on power, phased revenue, and unique risks. CRE, in contrast, has more predictable metrics tied to physical space and tenant diversity.
Data Centers vs Traditional CRE: Key Valuation Differences
Decoding the Cloud: Valuing Data Centers
sbb-itb-99d029f
Traditional CRE Valuation Methods
Commercial real estate (CRE) is typically valued using three main methods, with over 75% of recent appraisals relying on these approaches [3]. Professional appraisers often combine results from multiple methods to get a more comprehensive view of a property's worth. Each method sheds light on different aspects of property performance.
Income Capitalization Approach
This method evaluates a property based on its ability to generate income, making it especially relevant for investment-grade assets [3][4]. The formula is straightforward:
Value = NOI ÷ Cap Rate
- NOI (Net Operating Income): The annual income after deducting operating expenses.
- Cap Rate: Reflects the expected rate of return based on market conditions.
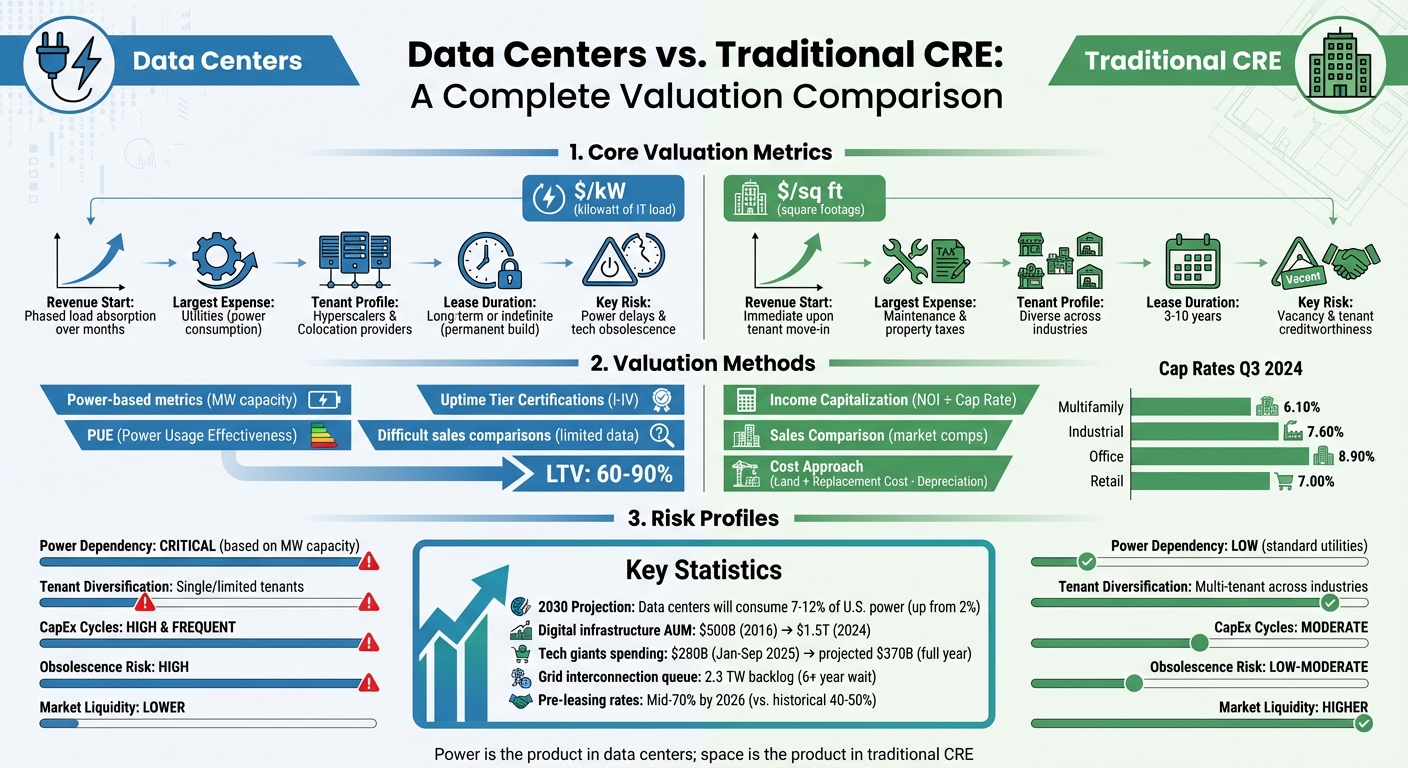
For Q3 2024, average cap rates varied by property type: Multifamily (6.10%), Industrial (7.60%), Office (8.90%), and Retail (7.00%) [6]. Properties with long-term leases to creditworthy tenants often have lower cap rates, leading to higher valuations.
To ensure accurate income projections, appraisers review documents like rent rolls and lease agreements. Operating Expense Ratios (OER) generally range from 45% to 55%. If the OER falls below 40%, it could signal underreported expenses or deferred maintenance issues [6].
Sales Comparison Approach
This method operates on the principle of substitution: buyers won’t pay more for a property than they would for a similar one. It uses recent sales data from comparable properties, or "comps", to determine value. Location plays a critical role, as even small geographic differences can require value adjustments [6].
In rapidly shifting markets, acceptable "recent" comps may be limited to 3–6 months, while more stable markets might allow a 6–12 month window. Around 60% of appraisals in active markets rely on this approach [3]. Digital tools, including crowd-sourced platforms and internal databases, have made it easier and faster to gather and analyze comp data, improving accuracy [7].
Cost Approach
The Cost Approach is often used when income or sales data is scarce. It estimates property value based on the cost to replicate the building today, using the formula:
Value = Land + (Replacement Cost − Depreciation)
This method is particularly helpful for new or specialized buildings where comparable sales or income data may not be available [4][5][7]. It also sets an upper limit on value, ensuring buyers don't pay more than the replacement cost.
Depreciation is broken down into three categories:
- Physical Deterioration: General wear and tear.
- Functional Obsolescence: Outdated design or features.
- External Obsolescence: External factors like neighborhood decline [3][5].
These traditional valuation methods provide a solid foundation for understanding property value, which becomes especially useful when comparing them to more specialized metrics, such as those used for data centers.
Data Center Valuation Methods
Data centers require a completely different valuation approach compared to traditional commercial real estate. While properties like office buildings and warehouses are often assessed based on square footage, data centers are primarily valued by their power capacity - specifically, the IT Load they can deliver. This is measured in kilowatts (kW) or megawatts (MW), making power the key metric that transforms how these assets are evaluated.
Power-Based Valuation Metrics
In the world of data centers, power is the main product. Tenants lease capacity based on kilowatts, and rent is typically structured as $/kW/month rather than the traditional $/SF/year model.
"Power is what drives revenue. It dictates how infrastructure is built, what redundancy is required, and how the facility performs. In these deals, space is secondary."
- Arturo Parada, Financial Analyst, Adventures in CRE [1]
Capital costs and stabilized Net Operating Income (NOI) are also calculated on a $/kW basis, and operating expenses are allocated according to power consumption. Valuation models for data centers must account for the gradual absorption of power load over time rather than assuming full revenue from day one [1][9].
A facility’s Power Usage Effectiveness (PUE) plays a crucial role in valuation. A lower PUE translates to reduced utility costs, which are the largest operating expense, and ultimately enhances the property’s value [1][9].
Uptime Tier Certifications also significantly influence valuations. For example, Tier III facilities - designed for concurrent maintainability with less than two hours of annual downtime - are the standard for institutional-grade properties. Meanwhile, Tier IV facilities, which offer fault-tolerant 2N+1 redundancy for mission-critical tasks, command the highest valuations. On the other hand, Tier I facilities, which cater to non-critical applications, are valued much lower [1][9].
This emphasis on power and operational metrics is a stark departure from the straightforward sales comparisons used in traditional commercial real estate.
Why Sales Comparisons Are Difficult for Data Centers
Market comparisons for data centers are uniquely challenging. Unlike traditional real estate markets, the data center sector is still relatively young, with fewer transactions and limited publicly available pricing data [2]. Additionally, the highly specialized nature of data centers - factoring in aspects like power density, cooling systems, fiber connectivity, and redundancy - makes direct comparisons difficult.
Transaction data is often scattered across internal systems or broker reports rather than consolidated in standardized public databases [8]. For instance, a 20 MW Tier III facility in Northern Virginia operates in a vastly different market compared to a similarly sized Tier II facility in Phoenix, even if both were built in the same year. These differences make direct comparisons nearly impossible without a deep understanding of the operational and market-specific nuances.
Valuation models for data centers also incorporate elements of corporate, project, and structured finance. By late 2025, the data center asset-backed securities market had grown to $35 billion in outstanding volume. Loan-to-value ratios ranged from 60% to 90%, depending on factors like tenant quality and the reliability of infrastructure [10].
Risk Profiles: Data Centers vs. Traditional CRE
Key Risk Factors and Their Impacts
Data centers and traditional commercial real estate (CRE) have very different risk landscapes. Traditional properties typically benefit from having a range of tenants and more predictable market liquidity. In contrast, data centers face unique challenges. For instance, their valuations are closely tied to power infrastructure. A lack of substation capacity for loads exceeding 50 MW can create significant bottlenecks - an issue rarely encountered in conventional real estate [11]. These structural differences highlight the need to examine their risks in greater detail.
One major concern for data centers is technological obsolescence. With rapid advancements in server technology, cooling systems, and power density, existing infrastructure can quickly become outdated. This fast-paced evolution can hurt market liquidity, as data centers must keep up with these changes in ways that traditional properties don't face [11][2].
Connectivity risk is another factor that directly impacts data center valuations. Being near long-haul fiber backbones and having diverse fiber paths are critical for maintaining value, while these considerations are far less significant for traditional retail or industrial properties. Additionally, the operational risks tied to the significant water needs of evaporative cooling systems are unique to data centers. Conventional properties don't face this kind of challenge. The lack of comparable sales for data centers further complicates appraisals and adds uncertainty [2].
"Data center developers are entering a danger zone where the biggest risks aren't inside the walls – they're outside them."
- Terry K. King, Vice President, Guidepost [12]
The combination of these risks means data centers require more frequent capital investments compared to traditional CRE. For example, constant upgrades to cooling and power systems are necessary, while conventional office buildings usually only need major renovations every few years. Adding to this complexity, many data centers operate with single-tenant or limited colocation models, which increases risk concentration. Traditional properties, on the other hand, often have diverse tenant bases spread across multiple industries. These factors not only increase operational complexity but also make it essential to account for future upgrade costs in valuations.
Comparison Table: Risk Profiles
| Risk Category | Data Centers | Traditional CRE |
|---|---|---|
| Power Dependency | Critical; valuation based on MW capacity and grid redundancy [11] | Low; standard utility connection sufficient for operations |
| Tenant Diversification | Often single-tenant (Hyperscale) or limited colocation; high concentration risk | Typically multi-tenant; diversified across various industries |
| CapEx Cycles | High and frequent; constant upgrades to cooling and power systems [2] | Moderate; periodic renovations and standard maintenance |
| Obsolescence | High; driven by rapid hardware and energy efficiency shifts [11][2] | Low to Moderate; influenced by broader architectural trends and location |
| Critical Infrastructure | Requires advanced fiber connectivity, substations, and water-cooling systems [11] | Requires standard road access, water, and sewage |
| Market Liquidity | Lower; specialized assets with fewer buyers and complex appraisals [2] | Higher; established market with frequent comparable sales |
Revenue Models: Data Centers vs. Traditional CRE
How Revenue Models Differ
Data centers approach revenue generation in a way that sets them apart from traditional commercial real estate (CRE). For office buildings, retail spaces, and warehouses, landlords typically base rent on square footage - charging tenants in dollars per square foot (USD/sq ft) annually. In contrast, data centers focus on power capacity, using dollars per kilowatt (USD/kW) of IT load delivered as their pricing metric. This creates a completely different revenue structure [9].
Another key difference lies in when revenue begins. In traditional CRE, rent starts as soon as the tenant moves in. For data centers, however, revenue follows a load absorption schedule. A lease might officially begin months before the tenant starts using power, with revenue gradually increasing as their equipment is powered up [9].
"In traditional real estate, we're taught to model value around square footage... But that framework doesn't hold in data center development. Here, the monetized product isn't space - it's power."
- Arturo Parada, Financial Analyst, Adventures in CRE [9]
Expense recovery methods also vary. Traditional properties allocate costs based on the leased area, while data centers do so based on power usage. Utility costs - by far the largest operating expense for data centers - scale with power consumption and are heavily influenced by Power Usage Effectiveness (PUE). Tenants only start paying their full share of these costs once they actively draw power [9]. This distinction emphasizes the need for specialized valuation models in data center projects.
Tenant profiles and lease dynamics also set data centers apart. Traditional CRE tends to attract a diverse mix of tenants, with lease terms typically ranging from three to ten years. Data centers, on the other hand, cater to two main tenant categories: Hyperscalers (single-tenant facilities for tech giants like Amazon and Microsoft) and Colocation providers (multi-tenant facilities) [13]. Leases for data centers often resemble infrastructure or triple-net (NNN) agreements, making them appealing to investors looking for long-term, stable returns. Additionally, data centers are often considered permanent builds since relocating servers and other computing equipment is extremely expensive [11].
Between January and September 2025, companies like Amazon, Microsoft, Alphabet, and Meta collectively spent around USD280 billion on data center infrastructure and AI hardware, with projections suggesting this could reach USD370 billion by the end of the year [13]. This massive investment contributes to tenant stability, which is generally higher than in traditional office or retail spaces. These revenue patterns align with the unique risks discussed earlier.
Comparison Table: Revenue Models
The table below highlights the primary differences between data centers and traditional CRE revenue models.
| Revenue Element | Data Centers | Traditional CRE |
|---|---|---|
| Primary Pricing Metric | $/kW (kilowatt of IT load) [9] | $/sq ft (square footage) |
| Revenue Commencement | Phased load absorption over months [9] | Immediate upon tenant move-in |
| Lease Structure | Power-linked escalations; infrastructure/NNN-style [13] | Often based on CPI or percentage escalations |
| OpEx Recovery Basis | Pro rata share of absorbed power [9] | Pro rata share of leased area |
| Tenant Profile | Hyperscalers and Colocation providers [13] | Diverse across industries |
| Typical Lease Duration | Long-term or indefinite (permanent build) [11] | 3–10 years |
| Major Expense Driver | Utilities scaling with PUE and power draw [9] | Property taxes and maintenance |
| Vacancy Risk | Delayed energization ("dark" capacity) [9] | Physical empty space |
| Capital Reserves | Allocated on $/kW/month basis [9] | Percentage of revenue |
AI and Power Demand in Valuations
AI-Driven Demand in Data Centers
The way investors assess data centers is undergoing a transformation, driven by the growing demands of artificial intelligence. Unlike traditional commercial real estate (CRE), where demand tends to follow steady patterns, AI workloads are creating unpredictable spikes in power consumption. This shift requires entirely new ways to approach valuations. By 2030, data centers are expected to account for 7% to 12% of the total U.S. power supply, a significant jump from the current 2% [14]. As a result, power availability has overtaken connectivity as the key factor in site selection and valuation. This change is redefining how assets are valued and bringing new operational challenges to the forefront.
In February 2026, the White House introduced the "AI ratepayer protection pledge", mandating that major tech firms self-supply power for new AI-focused data centers [14]. That same month, Google announced plans for the world’s largest battery energy storage project to support a data center in Minnesota [14]. These developments highlight a major shift: power reliability now carries more weight in asset value than location or fiber connections.
"Gone are the days when power strategy was an operational consideration layered onto site selection. It now is site selection."
- Matt Vincent, Editor in Chief, Data Center Frontier [15]
The scarcity of large power blocks has turned traditional pricing models upside down. Hyperscale tenants, who once benefited from volume discounts, are now paying premiums for large capacity blocks (10 MW or more) due to limited availability [15]. This urgency is reflected in preleasing rates, which are expected to hit the mid-70% range by 2026, compared to the historical average of 40% to 50% [15]. Tenants are locking in power capacity years before facilities are even built, treating it as a critical commodity.
Power Constraints and Execution Risks
Power procurement has emerged as the biggest execution risk for data center development. In the U.S., grid interconnection queues now stretch beyond six years, with a backlog of 2.3 TW - double the nation’s current installed generation capacity [16]. For large AI campuses, the high-voltage interconnection requirements have stretched construction timelines to 24, 36, or even 48 months [15].
These delays have a direct impact on valuations. While traditional CRE projects face minimal delivery risks, data center valuations now hinge on the "certainty of delivery" rather than factors like land cost or connectivity [15]. CBRE Group's $1.2 billion acquisition of Pearce Services in November 2025 reflects this shift. The deal was aimed at bolstering CBRE's capabilities in power delivery and infrastructure maintenance [15]. As CBRE Chair and CEO Bob Sulentic explained:
"This acquisition complements our large and growing presence in digital and power infrastructure... where the need for Pearce's services is growing rapidly"
[15]
To address power constraints, operators are adopting strategies like behind-the-meter power solutions - leveraging on-site natural gas, solar, and battery storage - and "bring your own power" (BYOP) methods in deregulated markets to bypass utility limitations [15]. Meanwhile, traditional CRE properties in data center hubs are grappling with a different challenge: rising electricity rates. In states with heavy data center activity, such as Virginia, Illinois, and Ohio, commercial electricity rates have risen by as much as 16% from 2025 to 2026 [14]. For a property with $200,000 in annual utility costs, a 10% rate increase could reduce its implied asset value by $333,000 at a 6% cap rate. Data center markets now require escalation scenarios of 5% to 15% annually through 2028, compared to just 2% to 3% for traditional CRE [14].
This growing divergence underscores the need for valuation professionals to use tailored frameworks. For traditional assets, power remains a relatively stable expense. But for data centers, power has become the central driver of value. Navigating these evolving dynamics requires specialized approaches to keep pace with the changing landscape.
Conclusion: Adapting Underwriting for Different Asset Classes
Using Specialized Tools for Modern Valuation
When it comes to underwriting across various asset classes, having the right tools can make all the difference. Traditional commercial real estate (CRE) valuation and data center valuation operate on entirely different principles. For example, in data centers, revenue depends on tenant load activation phases, while operating expenses are tied to power consumption rather than square footage. These unique factors demand tools that can handle such complexity seamlessly.
CoreCast (https://corecastre.com) is one such platform designed to simplify underwriting for diverse asset classes. It allows users to effortlessly switch between metrics like $/SF and $/kW, eliminating the need for juggling multiple spreadsheets. This unified approach ensures consistent portfolio analysis, regardless of property type. Features like tracking pipeline stages, analyzing competition through integrated maps, and generating professional reports for stakeholders are especially valuable when managing assets with vastly different valuation drivers.
Key Takeaways for Real Estate Professionals
For real estate professionals, adapting to modern underwriting practices means embracing new strategies:
- Shift to power-centric metrics for data center projects. Revenue and capital costs should be modeled around power consumption, with realistic ramp schedules that factor in potential delays, such as energizing tenant loads or shipping equipment [9].
- Assess technical resiliency by prioritizing Uptime Institute Tier Certifications (I-IV). These certifications influence CapEx needs, tenant profiles, and exit valuations directly [9].
- Focus on appropriate debt metrics. Aim for a Debt Service Coverage Ratio (DSCR) of 1.35 to 1.45 over the lease term, with Loan-to-Value (LTV) ratios typically falling between 60% and 75% [10].
- Use multi-layered financial models that account for tenant credit (corporate finance), construction and operational risks (project finance), and securitization (structured finance). This approach ensures a comprehensive view of potential risks [10].
With digital infrastructure assets under management growing from $500 billion in 2016 to $1.5 trillion by 2024 [10], professionals who refine their underwriting frameworks to align with these changes will be better prepared to thrive in this expanding sector.
FAQs
How do you convert $/kW pricing into a data center value?
To translate a $/kW pricing model into a data center's value, start by determining the revenue potential. Multiply the $/kW/month rate by the total capacity in kilowatts (kW) and the lease duration. Don’t forget to account for occupancy levels and any specific contract terms that might affect the calculation.
Next, apply a discounted cash flow (DCF) analysis to estimate the present value of the expected income. This involves factoring in lease details, occupancy rates, and selecting a discount rate that aligns with market conditions and investment risks. This approach helps provide a clearer picture of the data center's financial worth.
What is a realistic power ramp-up schedule for underwriting?
A practical power ramp-up schedule for underwriting must account for increasing load demands, particularly as AI and high-density data center infrastructure continue to expand. Additionally, it should incorporate scenarios for electricity cost increases ranging from 5% to 15% annually through 2028. This approach helps forecast key metrics like Net Operating Income (NOI) and Debt Service Coverage Ratio (DSCR) more accurately, ensuring your projections stay aligned with shifting energy usage and pricing trends.
Which data center risks matter most to lenders and investors?
Investing in data centers comes with its own set of challenges. Some of the biggest risks include valuation uncertainties, technological obsolescence, and market immaturity.
These assets often lack sufficient trading data, making it tough to establish consistent valuation benchmarks. On top of that, valuation methods are still evolving, and market demand can be unpredictable. The unique mix of locational, physical, and technological factors tied to data centers only adds to the complexity. All of this makes appraising their value a tricky task, requiring a careful look at long-term risks.