
Economic Risk Analysis for Real Estate Portfolios

Real estate investments face four major economic risks: interest rates, inflation, recessions, and geopolitical events. These factors can impact property values, rental income, and overall portfolio performance. For example, rising interest rates in 2022–2023 led to property value drops of 5–15%, with office properties declining over 20%. Inflation, while sometimes boosting rents, can strain portfolios with fixed leases or rising costs. Recessions typically reduce returns by 300–500 basis points, while geopolitical risks, though less frequent, can disrupt markets unpredictably.
To mitigate these risks, investors should use tools like Discounted Cash Flow (DCF) analysis, the Market Comparison Approach, and the Income Capitalization Method to assess vulnerabilities. Diversification across property types, regions, and tenant profiles helps balance risks. Monitoring key metrics, such as Debt Service Coverage Ratios (DSCR) between 1.5× and 2.0×, ensures financial stability. Platforms like CoreCast streamline risk tracking, scenario modeling, and portfolio reporting.
Key Takeaways:
- Rising interest rates and inflation directly affect property values and income.
- Recessions and geopolitical events pose significant risks to returns.
- Diversification and regular portfolio rebalancing are crucial for stability.
- Tools like DCF analysis and analytics platforms enhance decision-making.
Staying informed and proactive in risk management ensures real estate portfolios remain resilient amidst economic fluctuations.
Ray Dalio Issues Major Warning for Real Estate Investors
sbb-itb-99d029f
Main Economic Risks Affecting Real Estate Investments
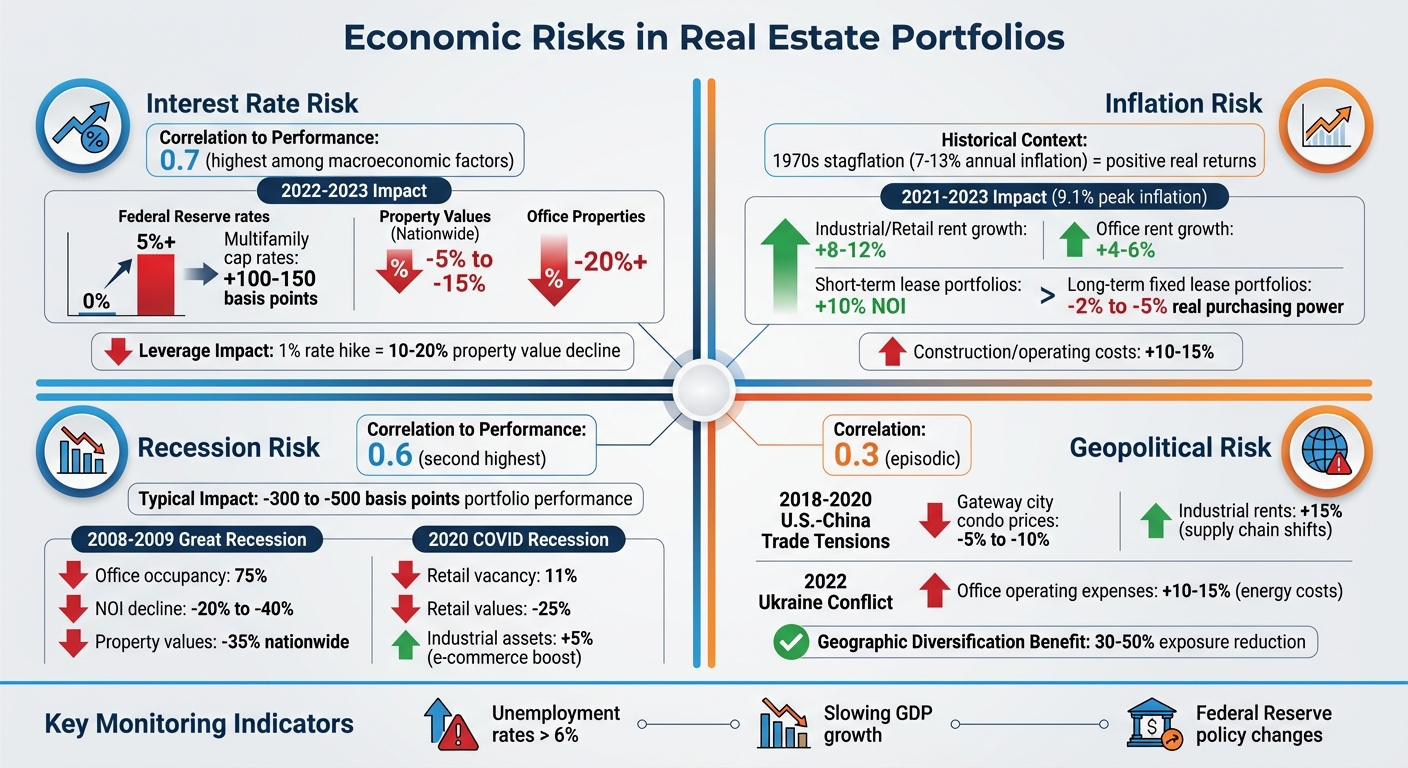
Four Major Economic Risks Affecting Real Estate Portfolios: Impact Data and Key Metrics
Real estate investments are shaped by four major economic risks, each capable of quickly impacting returns. Interest rate risk is the most significant, with NCREIF data from 2010–2023 showing a strong 0.7 correlation to portfolio performance - the highest among macroeconomic factors[1]. For example, when the Federal Reserve raised rates from near 0% to over 5% between 2022 and 2023, multifamily cap rates in the U.S. widened by 100–150 basis points, causing property values to drop 5–15% nationwide[4]. Office properties fared worse, with declines exceeding 20%, as remote work trends amplified the effects of higher refinancing costs. In highly leveraged portfolios, a 1% rate hike can slash property values by 10–20% due to rising debt service costs that cut into net operating income[1].
Inflation risk presents a mixed bag of outcomes. Historically, real estate has acted as a hedge against inflation, as seen during the 1970s stagflation when annual inflation rates of 7–13% still yielded positive real returns due to rent growth[2]. However, sudden inflation surges can reveal weaknesses. Between 2021 and 2023, U.S. inflation peaked at 9.1%, spurring 8–12% rent growth for industrial and retail assets, while office rents grew by only 4–6%[1]. Portfolios with short-term leases saw a 10% boost in net operating income, but those with long-term fixed agreements lost 2–5% in real purchasing power. Rising construction and operating costs - up by 10–15% - added further strain, especially when tenant demand softened[2].
Recession risk, ranking second in severity, has a 0.6 correlation with returns. Economic downturns typically reduce portfolio performance by 300–500 basis points. During the 2008–2009 Great Recession, U.S. office occupancy fell to 75%, net operating income dropped by 20–40%, and property values declined by about 35% nationwide[4]. The 2020 COVID-induced recession hit retail properties hardest, with vacancy rates climbing to 11% and values falling 25%. In contrast, industrial assets gained 5% thanks to e-commerce demand, highlighting how diversification can help offset losses in concentrated portfolios[4].
Geopolitical risk, while less frequent, carries unpredictable consequences, with a 0.3 episodic correlation[1]. For instance, U.S.–China trade tensions from 2018 to 2020 reduced foreign buyer activity, causing a 5–10% drop in condo prices in gateway cities, even as industrial rents rose by about 15% due to supply chain shifts[2]. Similarly, the 2022 Ukraine conflict drove energy costs higher, increasing U.S. office operating expenses by 10–15%. Geographic diversification can mitigate these risks, reducing exposure by 30–50% as international markets often respond differently to U.S.-centric events[2].
Monitoring key indicators - like unemployment rates exceeding 6%, slowing GDP growth, and Federal Reserve policy changes - can help investors stay alert to these risks. Recognizing how these threats can overlap, such as rising interest rates combined with geopolitical instability and recessionary pressures, is crucial for safeguarding returns. The next step involves adopting practical strategies to measure and manage these risks effectively.
How to Assess Economic Risks in Real Estate
Evaluating economic risks in real estate goes beyond guesswork - it requires precise, data-driven methods. Tools like Discounted Cash Flow (DCF) analysis, the Market Comparison Approach, and the Income Capitalization Method provide structured ways to identify and quantify risks. Each method focuses on different aspects of valuation, and when combined, they offer a more comprehensive view of potential challenges. By understanding how these methods respond to economic pressures, investors can make smarter decisions and create portfolios that better withstand uncertainty.
Discounted Cash Flow (DCF) Analysis
The DCF approach calculates the present value of a property's future cash flows. It factors in rental income, operating costs, vacancy rates, and potential exit strategies, all adjusted to today's value using a risk-adjusted discount rate. This method is especially helpful for testing how economic shifts might impact returns. For instance, increasing the discount rate by 2–3% to account for recession risks or tweaking net operating income growth by 1–2% provides a clearer picture of vulnerability to economic changes. DCF analysis is particularly effective for long-term investments and development projects, where the time value of money plays a significant role. It allows investors to proactively model and mitigate risks.
Market Comparison Approach
This method evaluates property values by comparing them to recent sales of similar properties (or "comps") in the same market. By focusing on location, property type, and tenant profiles, it reveals how current market conditions influence valuations. For example, properties in areas with stable economies tend to hold their value better, while those in regions facing demographic or economic challenges might see more volatility. The Market Comparison Approach is highly dependent on factors like market liquidity and transaction activity, making it a practical tool for assessing location-specific risks and shaping diversification strategies.
Income Capitalization Method
The Income Capitalization Method ties a property's value directly to its income potential. It uses the formula:
Property Value = Net Operating Income (NOI) / Capitalization Rate
This method is ideal for stabilized properties with predictable income streams. The capitalization rate reflects perceived risk: higher rates signal greater economic uncertainty, while lower rates suggest steadier income. By monitoring how NOI responds to economic cycles - like rising vacancies or falling rents - investors can gauge whether a property has enough income cushion to weather downturns. For added security, maintaining a debt service coverage ratio (DSCR) of 1.5×–2.0× can help safeguard against economic stress.
Comparison of Valuation Methods
Each method serves a specific purpose, depending on the type of property and the economic risks at play. Here's a quick breakdown:
| Method | Key Inputs | Best For | Sensitivity |
|---|---|---|---|
| DCF Analysis | Future cash flows, discount rate, growth rates | Long-term investments, development projects | Very high |
| Market Comparison | Recent sales, location/size adjustments | Existing properties, resale valuation | Medium - depends on market activity and local conditions |
| Income Capitalization | NOI, capitalization rate | Stabilized properties | High - affected by expenses, rents, and interest rates |
Bringing It All Together
Platforms like CoreCast streamline these methods by integrating data from sources like T12 statements, rent rolls, and live market comps. This allows investors to test assumptions, analyze unit-level risks, and produce detailed reports for stakeholders - all in one place. By blending these approaches, investors can gain a clearer understanding of risk-adjusted returns and make more informed decisions in an ever-changing economic landscape.
Portfolio Diversification Strategies for Risk Reduction
Once risks have been assessed using various valuation methods, investors can further manage these uncertainties by diversifying their portfolios. Spreading investments across different property types, regions, and tenant profiles can help cushion the impact of economic disruptions. When one area of a portfolio struggles, others may balance out the losses, creating more stable overall returns. The key is to align diversification tactics with the portfolio's risk tolerance and long-term goals.
Property Type Diversification
Investing in different property types - like industrial, office, retail, and multifamily - can reduce the impact of downturns in any single sector. For example, if the retail sector faces challenges, gains in industrial or multifamily properties might offset the losses. However, managing such a diverse portfolio often requires expertise in multiple asset classes. Geographic diversification can also complement this approach, providing additional protection against localized risks.
Geographic Diversification
Spreading investments across various cities and regions helps shield portfolios from localized economic slowdowns or natural disasters. Markets with growing populations and job opportunities often offer better long-term returns, while more stable markets deliver steady cash flow. Although emerging markets come with higher risks, they also hold the potential for greater rewards. In Q4 2024, commercial real estate transaction volumes hit $108.5 billion, with 70% of investors planning to ramp up purchases in 2025, even with rising interest rates [5]. Modern strategies frequently combine geographic and property-type diversification - for instance, pairing urban office properties with suburban multifamily assets to reduce exposure to both regional and sector-specific risks [5].
Tenant and Sector Diversification
Relying too heavily on a single tenant industry increases vulnerability to sector-specific downturns. A common rule of thumb is to limit any one tenant industry to around 20–25% of total rental income. Staggering lease expirations is another effective tactic to avoid a wave of vacancies all at once, though it can complicate long-term leasing plans. Achieving effective tenant diversification requires access to detailed industry data and constant monitoring. For instance, portfolios concentrated in one sector may face significant challenges during an industry downturn, while a balanced mix of tenants can create a more stable income stream.
Comparison of Diversification Strategies
| Diversification Strategy | Key Benefit | Main Drawback |
|---|---|---|
| Asset Class Mix | Expands the tenant pool; reduces sector risks | Requires expertise in multiple property types |
| Geographic Spread | Shields against local economic disruptions | Adds complexity to regional management |
| Tenant/Sector Diversification | Reduces reliance on any single industry | Needs detailed data and regular monitoring |
| Lease Staggering | Prevents large-scale vacancies | Can complicate long-term lease strategies |
Platforms like CoreCast provide tools for tracking diversification metrics, monitoring property type and geographic concentration risks, and generating revenue forecasting reports on how different scenarios could affect returns. By using features like integrated maps and unit-level trend analysis, investors can adjust their strategies as economic conditions shift. This proactive approach helps ensure that portfolios remain resilient in uncertain times.
Best Practices for Risk Monitoring and Mitigation
Expanding on earlier strategies like risk assessments and diversification, ongoing monitoring is key to effective portfolio management. Whether it's a decline in cash flow, rising vacancy rates, or fluctuating market conditions, active oversight ensures you can adapt before minor issues escalate into major setbacks. Keeping an eye on critical metrics, such as the Debt Service Coverage Ratio (DSCR), provides early warnings and helps guide timely adjustments to maintain portfolio health.
Debt Service Coverage Ratio (DSCR) Thresholds
The Debt Service Coverage Ratio evaluates whether a property generates enough income to cover its debt payments. It’s calculated by dividing the Net Operating Income (NOI) by the total debt service (principal plus interest). For portfolios with low-risk, stable properties, a DSCR between 1.5x and 2.0x is recommended. For higher-risk investments - like value-add or development projects - a DSCR of 2.0x or higher is advisable to account for potential volatility [1].
A DSCR of 1.5x means the property’s income is 1.5 times the debt payments, offering a buffer if income drops by up to 33%. Monitoring this metric quarterly, or even more frequently during uncertain economic periods, is essential. If your DSCR dips below 1.5x, consider steps like adjusting rents, refinancing, selling underperforming assets, or adding equity. For instance, during the 2008 recession, portfolios that maintained DSCRs above 1.8x through proactive refinancing avoided forced sales [1][3]. Additionally, regular portfolio rebalancing ensures your investments stay aligned with shifting market dynamics.
Regular Portfolio Rebalancing
Rebalancing involves realigning your portfolio’s asset mix to match your original strategy. Market changes can cause certain property types, regions, or sectors to become overrepresented, increasing concentration risk. For example, if office properties outperform, they might unintentionally take up a larger share of your portfolio. Most investors rebalance annually or semi-annually, or when allocations stray by 5–10% from their targets [2].
Triggers for rebalancing include DSCR falling below thresholds, vacancy rates exceeding 10%, or regional economic slowdowns [1][2]. A practical example: in 2022, many U.S. investors reduced their urban office exposure from 30% to 15% due to the rise of remote work, ensuring their portfolios remained resilient [1][2]. While rebalancing can incur transaction costs (typically 2–5% of property value) and liquidity challenges, spreading adjustments over 6–12 months can help reduce disruptions [2][4].
Using Analytics Platforms Like CoreCast

Managing portfolios with spreadsheets often involves manual data entry, which is time-consuming and prone to errors. Modern analytics platforms offer a more efficient alternative by providing real-time tracking of metrics like DSCR, NOI forecasts, and market trends through automated data feeds and integrated dashboards. Tools like CoreCast allow users to analyze portfolios, track deal pipelines, and generate professional reports for stakeholders - all in one place [2][3].
These platforms also enable advanced scenario modeling, such as predicting how a 2% interest rate hike or a recession might affect your portfolio. Automated DSCR calculations and AI-driven forecasts can cut manual work by nearly 50% [2]. Real-time alerts for NOI changes highlight potential issues, helping investors pivot quickly - such as reallocating funds from struggling retail properties to thriving multifamily assets in high-growth areas.
| Feature | Spreadsheet Models | SaaS Platforms (e.g., CoreCast) |
|---|---|---|
| Data Updates | Manual entry; prone to lag | Real-time, automated |
| Error Risk | High | Low |
| Collaboration | Version control issues | Centralized hub |
| Scalability | Limited for complex portfolios | Built for scale |
| Reporting | Manual compilation | Automated, branded |
Conclusion and Key Takeaways
Economic risk analysis plays a crucial role in building portfolios that can weather challenges and adapt to changing conditions. The foundation is simple: identify key economic risks like interest rates, inflation, market cycles, and geopolitical events. Then, use reliable valuation techniques to measure these risks, diversify thoughtfully across property types and regions, and keep an eye on critical metrics like DSCR thresholds, ideally between 1.5x and 2.0x for core portfolios [1].
The real difference comes from execution. Consistently tracking performance indicators - such as rent trends and occupancy rates [2] - allows investors to spot risks early and respond proactively.
Modern tools like CoreCast simplify this process by integrating underwriting, portfolio analysis, pipeline management, and diversification strategies into one platform. By eliminating manual data entry, these tools enable real-time scenario modeling. This means when interest rates rise or economic conditions shift, investors can quickly evaluate the impact across their portfolios.
Data-driven forecasting also provides a measurable edge. For instance, growth rates improve by 19% when using accurate data instead of relying solely on intuition [6]. Additionally, high-quality data reduces forecasting errors by 37%, while poor data quality is responsible for 62% of errors [6]. Geographic diversification is another key strategy - investing in markets with distinct economic drivers and independent interest rate cycles can help reduce systemic risks that mere property count cannot address [2].
Ultimately, long-term success hinges on staying ahead of economic changes, leveraging reliable data, and executing with discipline.
FAQs
How do I stress-test my portfolio for rate hikes and recessions?
To test the resilience of your portfolio, try scenario analysis by simulating best-case, base-case, and worst-case scenarios for interest rate increases and potential recessions. For instance, if interest rates climb by 1%, property values could drop by 10%. Leverage tools that provide real-time data and predictive analytics to evaluate how changes might affect cash flow, occupancy rates, and property values. Running these tests regularly can help you spot risks early and create strategies to minimize potential losses.
Which valuation method should I use for my property type?
The best way to value a property depends on its type and your investment goals. Here are three common approaches:
- Income Approach: Perfect for properties that generate income, like multifamily buildings or office spaces. This often involves using discounted cash flow (DCF) analysis to estimate value based on expected income.
- Sales Comparison Approach: Works well for residential properties or those with comparable sales data.
- Cost Approach: Useful for unique properties or newly developed projects, focusing on the cost to replace or reproduce the property.
Your choice should align with market trends, the property’s characteristics, and your investment strategy. Tools like CoreCast can provide an edge by offering real-time data to refine your analysis.
What early warning signs indicate it’s time to rebalance?
Shifts in market conditions - such as unexpected changes in property values, occupancy rates, or rent growth - are often early signs that something isn’t aligning with initial expectations. Keeping a close eye on metrics like Net Operating Income (NOI) and capitalization rates can help pinpoint assets that might not be performing as planned.
Another red flag? When asset allocation moves significantly off course due to market fluctuations. In such cases, rebalancing the portfolio can bring things back in line with your risk management objectives.