
How Pipeline Visualization Improves CRE Deals

Pipeline visualization transforms how commercial real estate (CRE) professionals manage deals. Instead of relying on outdated spreadsheets and scattered emails, it offers a real-time, centralized dashboard that tracks every deal stage - from prospecting to closing. This approach simplifies workflows, identifies bottlenecks, and reduces costly errors.
Key Benefits:
- Clear Deal Tracking: See where every deal stands at a glance.
- Better Decision-Making: Use data insights like conversion rates and pipeline velocity to refine strategies.
- Faster Processes: Spot and resolve delays before they derail timelines.
- Accurate Forecasting: Predict revenue and timelines based on real-time data.
- Improved Collaboration: Cloud-based tools ensure the entire team stays aligned.
Modern tools even integrate AI to automate data entry, saving hours of manual work. For example, platforms like CoreCast centralize underwriting, tracking, and reporting, offering a streamlined solution for CRE professionals. With features like geospatial mapping and real-time analytics, these tools help teams manage complex transactions with ease.
Pipeline visualization isn't just an upgrade - it's a necessity for staying competitive in today's fast-paced market.
What is Pipeline Visualization?
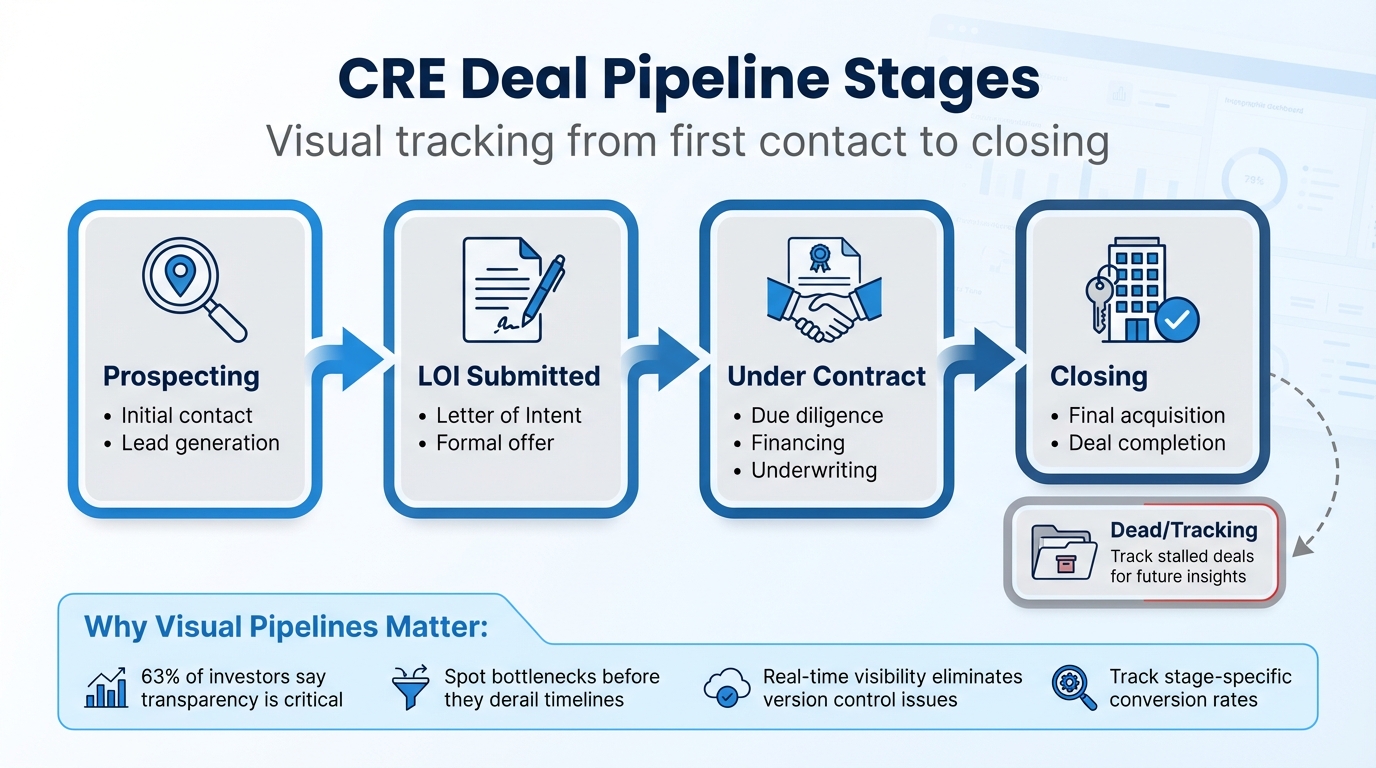
CRE Deal Pipeline Stages: From Prospecting to Closing
Pipeline Visualization Defined
Pipeline visualization is a tool that organizes your deals from the first contact to closing, all within a single, real-time dashboard. Think of it as a replacement for those endless spreadsheets and email chains. Instead of digging through scattered records to figure out where a deal stands, you get a clear, at-a-glance view of everything happening in your pipeline.
"A deal pipeline tracks the lifecycle of every deal. It's a visual representation of the path a prospect takes from their first contact to the moment they become a client (or not)." - Buildout [1]
With this dashboard, you can easily see which deals are in the prospecting phase, which have Letters of Intent (LOIs) submitted, what's under contract, and what’s officially closed - all in one convenient place [1][4].
Now, let’s break down how this applies to commercial real estate (CRE) transactions.
How Pipeline Visualization Works in CRE
In the world of commercial real estate, deals typically follow a series of well-defined stages. Pipeline visualization simplifies these complex transactions into clear, actionable phases like Prospecting, LOI Submitted, Under Contract, and Closed [2]. Each phase serves as a checkpoint where critical steps happen, such as underwriting, making formal offers, conducting due diligence, securing financing, and finalizing the acquisition.
One of its biggest advantages? Spotting bottlenecks. With visual tools, you can quickly identify where deals are getting stuck - those tricky "rock wall" stages where prospects tend to drop off [1]. Instead of just adding more leads to your funnel, you can focus on fixing the problem area, whether that means streamlining due diligence or revisiting LOI terms.
Modern systems take it a step further by using AI to handle data entry. Instead of manually entering details from offering memorandums, AI can pull property data, financial figures, and key dates directly into your pipeline [3][4]. This automation reduces the time spent on admin tasks, allowing your team to focus on analyzing deals and building stronger client relationships.
Benefits of Pipeline Visualization for CRE Professionals
Pipeline visualization is more than just a tool; it's a game-changer for how commercial real estate (CRE) professionals handle their deals. By turning complex processes into clear, actionable visuals, it transforms the way teams operate and make decisions.
Better Deal Tracking and Transparency
Imagine having a single, real-time dashboard where your entire team can access up-to-date deal information. No more hunting through outdated files or reconciling conflicting reports - everyone stays on the same page. This level of visibility isn’t just convenient; it’s essential. In fact, 63% of investors say transparency is critical in their relationships with CRE firms [10].
With live dashboards, weekly status meetings become unnecessary. Updates are instant, and cloud-based audit trails make it easy to track who’s responsible for what and when tasks are due [3]. This kind of clarity ensures nothing falls through the cracks.
Smarter Decisions with Better Data Insights
Visual pipelines don’t just organize your data - they turn it into insights you can actually use. For instance, by tracking stage-specific conversion rates, you can see how many deals progress from proposal to listing. This helps you estimate revenue and pinpoint areas that need improvement [1]. It’s about focusing your energy where it matters most.
"Data should be the driving force behind your real estate pipeline management strategy, but leveraging it should never require substantial effort." - Matt Carrigan, Dealpath [6]
These tools also measure pipeline velocity, showing how quickly deals move through each stage. This gives you a clearer picture of your sales cycle and helps you predict closing timelines [1]. Plus, keeping tabs on your exposure to specific lenders, sponsors, or market sectors means you’re ready to adapt to market changes without scrambling to pull together scattered reports [4].
Beyond insights, these systems help you identify and fix process bottlenecks, speeding up your workflows.
Faster Processes and Bottleneck Removal
A visual dashboard makes it easy to spot where deals are getting stuck. For example, if a deal has been sitting in one stage for two weeks, you can intervene before it derails your timeline. By defining clear entry and exit criteria for each stage, you ensure that no steps are skipped and resources are used efficiently.
The results can be impressive. Northland Investment Corporation, for instance, streamlined its operations and cut the time to prepare investor packages from four days with eight team members to just one day with one person [10]. Automated alerts for critical deadlines - like PSA execution or due diligence expiration - further reduce the risk of deals slipping through the cracks [3][2]. Considering that nearly 90% of spreadsheets contain errors, moving to a visual system with automated checks can save you from costly mistakes [6].
These process improvements also lead to more dependable forecasting.
More Accurate Revenue and Transaction Forecasting
Tracking win rates - the percentage of deals that close successfully - and understanding the time spent in each stage give you a solid foundation for revenue projections [1]. Instead of relying on gut feelings, you can base forecasts on historical data that reveals the average length of your deal cycle.
Real-time updates and variance analysis make your forecasts more precise. This level of accuracy builds trust with investors and executives, who not only want to see the numbers but also understand the story behind them [10].
And none of this is possible without strong collaboration and accountability within your team.
Better Accountability and Team Collaboration
With role-based workflows and cloud-based access, everyone stays aligned. Team members can update information in real time, eliminating the version control headaches that come with traditional spreadsheets [3][11][2]. This ensures deals progress smoothly, with no miscommunication or lost details.
Key Features of Effective Pipeline Visualization Systems
Building on the advantages discussed earlier, certain features take pipeline visualization systems to the next level, enabling CRE professionals to streamline their deal processes. These systems transform raw data into actionable insights through customization, intuitive design, automation, and real-time analytics - all tailored to align with the unique stages of your deals.
Customizable Stage-Based Tracking
Every deal process is different, and your pipeline system should reflect those differences. Customizable stage-based tracking allows you to adapt your software to fit the specific workflows of various asset classes, whether you're managing multifamily acquisitions, retail projects, or industrial leases. You can define each phase - from lead generation to closing - so your system mirrors your actual process, not a generic template.
For example, in 2024, a Director of Acquisitions at a REIT transitioned from manual spreadsheets to CoreCast's Pipeline Tracker. This shift to automated visualization reduced deal slippage by 30% over two consecutive quarters [12]. When your pipeline stages align with your real-world operations, the results speak for themselves.
Easy-to-Use Visualizations and Design
Even the best data is useless if it’s hard to interpret. Intuitive visualizations - like Kanban boards, color-coded dashboards, and dynamic charts - make complex portfolios easier to understand at a glance. When you're managing dozens of transactions, you need quick insights into which deals are progressing, which are stalled, and which demand immediate attention.
Color-coded cues, such as green for progress, red for issues, and neutral for baseline metrics, speed up decision-making [10]. This isn't just about aesthetics; it's about functionality. For instance, Denning & Company adopted a visualization-driven pipeline management system and managed to cut the time spent on daily administrative tasks by 50% [9]. Clear visuals equal faster, smarter decisions.
Automated Data Integration
Manual data entry is not only time-consuming but also prone to errors. Automated data integration solves this by connecting your pipeline system directly to CRM platforms, email accounts, and document repositories. This seamless flow of information eliminates bottlenecks and ensures accuracy. AI-driven tools further enhance the process, streamlining tasks like underwriting and creating what Chris Kazanowski, VP of Financial Planning & Analysis at IDI Logistics, describes as a "single source of truth":
"Information that was stored across countless spreadsheets is now aggregated in a single source of truth, allowing senior leadership and other team members to make better-informed decisions based on real-time information" [7].
In 2021, Principal Real Estate managed a pipeline of 3,500 deals worth $250 billion in gross value, closing $2.3 billion in acquisitions and $3.1 billion in new development starts [7]. Automation was key to handling such scale efficiently.
Real-Time Analytics and Reporting
Static reports become outdated quickly, but real-time analytics provide live insights into key metrics like pipeline velocity, conversion rates, and deal health. This allows you to adjust strategies on the fly. Dynamic reporting tools let you track trends, analyze variances, and monitor win rates as they happen.
With 72% of real estate owners and investors already leveraging AI-powered tools [10], those who lag in adopting real-time analytics risk falling behind. Automated reminders for critical deadlines, like PSA execution or non-refundable dates, further safeguard your capital and keep deals on track [2][7]. When your data updates in real time, your decisions can follow suit just as quickly.
sbb-itb-99d029f
How to Implement Pipeline Visualization in Your CRE Business
Introducing pipeline visualization can transform how your team tracks deals, manages deadlines, and makes informed decisions. Shifting from spreadsheets to a centralized system brings immediate clarity and efficiency. Here’s how to get started.
Choosing the Right Platform
First, make sure the platform you choose can handle your current deal volume and has the capacity to grow with your business. Look for tools that integrate seamlessly with your existing CRM, email systems, and third-party data providers like Esri or Cherre. Platforms that centralize communication and approvals are key - they eliminate data silos, reduce email clutter, and provide a clear audit trail for every transaction [3][8][14].
For example, in 2021, Principal Real Estate used a centralized platform to manage 3,500 deals worth about $250 billion, completing $8.5 billion in total transactional activity that year [7]. Managing operations at that scale requires a platform built for high-volume, complex workflows.
Once you’ve selected the right platform, customize it to reflect your specific deal processes.
Defining and Customizing Deal Stages
Your pipeline should align with how your team actually works - not just follow a cookie-cutter approach. Break it into stages like Prospecting, LOI Submitted, Under Contract, Closing, and Dead/Tracking to track both active and stalled deals [2]. Add industry-specific data fields, such as unit mixes for multifamily properties, truck court depth for industrial spaces, or anchor tenant details for retail deals [7].
Use conditional checklists to trigger tasks at specific stages. For instance, zoning analysis might be required for ground-up developments [6]. Role-based workflows can help clarify who is responsible for what at every step of the process [3][4]. To keep things on track, monitor pipeline velocity - a measure of how quickly deals progress through the stages. Use this formula to identify bottlenecks:
(Number of Opportunities × Average Deal Value × Win Rate) / Average Deal Cycle Length [1].
With your stages and workflows clearly defined, automation can help ensure consistency and accuracy.
Automating Workflow and Task Management
Automation is a game-changer for eliminating repetitive tasks. Use AI-powered tools to pull data from Offering Memorandums and flyers, kicking off underwriting processes without manual input [3][5][13]. Set up automated reminders for critical deadlines like PSA execution, due diligence expiration, and non-refundable deposit dates to safeguard your investments [2][7][13].
IDI Logistics offers a great example of this in action. They replaced "countless spreadsheets" with a centralized tracking system, giving them a real-time overview of their development pipeline. Chris Kazanowski, VP of Financial Planning & Analysis, shared how this change improved their operations:
"We are able to track where each of our projects stand relative to underwriting from a timing, cost and returns standpoint, which has enhanced budgeting and reduced cost overruns" [7].
Regularly auditing your pipeline metrics ensures accountability and highlights where deals might be getting stuck. As the saying goes: "You can't manage what you don't measure" [1]. By automating workflows, you not only save time but also create a system that ensures nothing slips through the cracks.
CoreCast: An End-to-End Solution for Pipeline Visualization
Imagine managing your entire deal lifecycle in one place. That’s exactly what CoreCast is designed to do. Founder Jared Stoddard puts it best:
"We built CoreCast because the way commercial real estate operators work today is fundamentally dysfunctional... hacking together systems that were never meant to talk to each other."
CoreCast brings together underwriting, pipeline tracking, portfolio analysis, and stakeholder reporting into a single, cohesive system. This means you can oversee everything - from the earliest deal evaluations to closing and beyond - all in one platform. It's a game-changer for commercial real estate (CRE) professionals.
Core Features of CoreCast for CRE Pipeline Management
CoreCast goes beyond just tracking deal stages. Its geospatial mapping feature offers a visual representation of your deals on interactive market maps. You can filter these maps by product type, risk profile, or sponsor, making it easier to spot market density and geographic exposure risks in seconds.
The platform’s Output View provides real-time updates on key metrics like IRR, equity multiples, and DSCR as assumptions change. Plus, CoreCast’s AI-driven parsing automatically fills in rent rolls and T-12s, saving you hours of tedious manual work.
CoreCast is versatile enough to handle various asset classes, including multifamily, office, industrial, retail, hospitality, and even specialty projects. Whether you're assessing stabilized acquisitions, value-add opportunities, or ground-up developments, the platform adapts seamlessly to your needs.
How CoreCast Streamlines Transactions
CoreCast integrates directly with property management systems like Yardi, AppFolio, and RealPage, pulling in historical data to ensure accurate underwriting. Its conversational AI allows you to adjust assumptions with simple, natural language commands - type something like "layer in stabilized assumptions for medical office", and the platform makes the updates instantly.
Customizable portals give LPs and lenders live access to deal metrics, while branded reports ensure everyone stays on the same page.
"With the Output View, you're no longer modeling in the dark. You're seeing the consequences of every decision as you make it."
This level of integration and real-time insight simplifies workflows, giving CRE professionals more time to focus on strategy.
Why CRE Professionals Need CoreCast
CoreCast tackles one of the biggest challenges in commercial real estate: fragmented systems. By combining underwriting, pipeline tracking, and reporting into one platform, it eliminates data silos, reduces errors, and ensures your analyses are always up-to-date. For teams juggling multiple deals, CoreCast provides real-time analytics from start to finish.
With beta pricing set at $50 per user per month and a planned Version 1.0 launch in Q1 2026, CoreCast is poised to become an essential tool for modern CRE professionals looking to streamline their operations and make faster, more informed decisions.
Conclusion
Pipeline visualization has become an essential tool in commercial real estate (CRE), offering a much-needed upgrade from outdated spreadsheets to centralized platforms. This shift turns deal management into a more proactive, data-driven process. By having a clear view of where every deal stands, tracking velocity metrics in real time, and identifying bottlenecks as they happen, teams can manage deals with precision. After all, "You can't manage what you don't measure" [1].
The advantages are clear: better decision-making through data, improved team collaboration, and faster deal closings. As Matt Carrigan from Dealpath aptly states:
"Speed, precision and scale can make the difference between capturing emerging opportunities and following the market's lead" [4].
This insight is especially relevant in today’s fast-paced CRE market, where timing often determines success or failure.
Still, many firms are held back by outdated methods. Spreadsheets, for instance, create version control headaches, limit team collaboration, and increase the risk of errors that could derail deals. Modern platforms not only solve these issues but also help firms build a proprietary database of market insights. Even deals that don’t close contribute valuable historical data for future underwriting.
To tackle these challenges, integrated solutions are stepping in. CoreCast, for example, offers a platform that centralizes underwriting, pipeline tracking, mapping, and stakeholder reporting - all at an accessible beta rate of $50 per user per month. This kind of tool empowers teams to create scalable real estate intelligence systems.
FAQs
How does pipeline visualization help streamline CRE decision-making?
Pipeline visualization gives commercial real estate (CRE) teams a centralized, up-to-the-minute view of every deal as it moves through stages like sourcing, negotiation, and closing. By visually mapping out transactions, teams can easily see where deals stand, identify risks, and tackle bottlenecks before they become bigger issues.
Instead of juggling fragmented spreadsheets, this process brings all the data into one place, making it easier to analyze deal performance, financing assumptions, and market trends with speed and accuracy. With built-in performance metrics and alerts, decision-makers can focus their resources on the most promising deals, fine-tune strategies to avoid setbacks, and keep things moving smoothly. The result? Sharper forecasts, greater efficiency, and more confident decisions.
CoreCast takes this a step further with its comprehensive pipeline visualization platform, which not only tracks deals but also analyzes their performance and produces polished reports - all in one streamlined interface. This tool equips CRE professionals to stay competitive and make smarter, data-backed choices in an ever-changing market.
What features should a pipeline visualization tool have to improve deal management?
A pipeline visualization tool should offer a real-time, centralized view of all deals, covering every step from the initial lead to closing. It needs to help you track deals through customizable stages - like Lead, Negotiation, Under Contract, and Closed - ensuring consistency across your team. This way, no opportunities slip through the cracks. Tools with real-time updates and visual dashboards, such as map-based displays, let you quickly grasp the status of every transaction at a glance.
Automation and analytics play a big role in simplifying workflows. The best tools pinpoint bottlenecks, send automated reminders for deadlines, and cut down on manual data entry with features like AI-powered document processing. Collaboration is another essential feature - tools that allow secure sharing of updates and documents among team members and external partners can significantly reduce delays.
Equally important are integration and reporting capabilities. A solid tool should connect seamlessly with third-party systems like market data or property management platforms. It should also generate branded, investor-ready reports directly from your pipeline. These features combined make pipeline visualization a game-changer for keeping deals on track, improving decision-making, and boosting transaction efficiency in commercial real estate.
How does AI improve pipeline management in commercial real estate?
AI is transforming pipeline management in commercial real estate by automating tedious tasks and offering valuable insights. Instead of manually updating spreadsheets, AI can quickly process offering memoranda, property flyers, and market reports. It extracts key metrics and updates your pipeline in seconds, ensuring your data is always accurate and current while saving you countless hours.
Once the data is in place, AI takes it a step further with predictive analytics. It can spot trends, highlight high-potential deals, and flag potential risks. Need to forecast closing timelines or estimate cash-flow impacts? AI has you covered. It can even suggest financing strategies, giving you a clearer picture of what lies ahead so you can make faster, more informed decisions. Plus, routine tasks like assigning deadlines or creating branded stakeholder reports are automated, keeping your team on track and your investors in the loop.
By converting static pipeline data into a dynamic, real-time decision-making tool, AI empowers CRE professionals to streamline their workflows, zero in on the most promising opportunities, and close deals with greater efficiency.