
Mapping Competitive Landscapes in CRE

Understanding the competitive landscape in commercial real estate (CRE) is no longer optional - it’s essential for staying ahead. This involves analyzing direct competitors, indirect alternatives, and substitutes in the market. Modern mapping tools simplify this process by visualizing data like property locations, demographics, and market trends in real time.
Key takeaways:
- Categories of competition: Direct competitors (similar properties), indirect competitors (e.g., coworking spaces), and substitutes (adjacent market players).
- Challenges: Fragmented data, reliance on static spreadsheets, and slow analysis lead to missed opportunities.
- Solutions: Real-time mapping tools integrate geospatial analysis, layered data visualization, and portfolio tracking to provide actionable insights instantly.
- Example: CoreCast’s platform allows users to combine mapping, underwriting, and deal tracking, cutting errors and speeding up decisions.
These tools help CRE professionals identify underserved markets, avoid oversaturated areas, and make data-driven decisions faster than ever.
Challenges in Analyzing Competitive Landscapes
Fragmented Data and Limited Visibility
One of the biggest hurdles for commercial real estate (CRE) professionals today is dealing with fragmented data. Key information - like property details, financial metrics, and market research - often exists in separate systems. This lack of integration creates blind spots, making it nearly impossible to get a clear and complete view of the competitive landscape.
Professionals end up spending as much as 40% of their time on time-consuming administrative tasks, such as manually reconciling data from these disconnected platforms[2]. On top of that, about 40% of IT budgets in these firms are tied up in managing technical debt caused by outdated or fragmented systems[2].
"In 2025, commercial real estate professionals will continue to confront challenges such as fragmented data and location-specific distinctions."
– Anthony F. DellaPelle, Esq., Global Chair, Counselors of Real Estate[4]
This isn't just an issue of wasted time or inefficiency - it’s a serious risk. With $1.8 trillion in commercial loans maturing in 2026[2], CRE professionals are under intense pressure to deliver accurate and timely competitive analyses to support critical refinancing decisions.
Limitations of Spreadsheets and Static Reports
Traditional tools like spreadsheets are another stumbling block. While they can list property comparables, they fail to uncover spatial trends or provide deeper insights. Manual data entry only worsens the problem, introducing errors and inconsistencies into even basic calculations like Net Operating Income (NOI)[2][3]. And because spreadsheets and static reports lack real-time updates, they offer little more than a snapshot of the past - hardly useful when decisions need to be forward-looking.
The consequences of these inefficiencies are felt across the industry. Burnout among CRE professionals is on the rise, driven by repetitive workflows and endless data reconciliation. This, in turn, leads to higher rates of talent attrition, making it even harder for firms to stay competitive[2].
Missed Opportunities in Fast-Moving Markets
In fast-changing markets, slow analysis tools can lead to missed opportunities and poor investment decisions. Conventional methods often take weeks to deliver insights - an eternity in markets where conditions can change daily. By the time an emerging hotspot is identified, competitors with faster, more agile tools may have already seized the opportunity.
The stakes couldn’t be higher. Borrowers are bracing for debt service payments that could increase by 75% to 100% on maturing loans[4]. In response, investors are gravitating toward Class-A assets with steady cash flows, relying on competitive analysis to guide their decisions[2]. But when analysis is delayed or incomplete, firms risk consistently arriving too late to capitalize on key opportunities.
Adding to the problem, many firms attempt to scale by layering advanced tools like AI onto an already broken data foundation. This approach often leads to underwhelming results, as technology investments fail to deliver their full potential without first addressing the underlying data fragmentation[2]. As one speaker at CREtech New York 2024 aptly put it, "Whoever Wins Data, Wins AI"[2].
Tackling these challenges is essential before adopting modern mapping tools that enable real-time, integrated competitive analysis. Without addressing these foundational issues, the benefits of advanced tools will remain out of reach, and competitive analysis will continue to fall short.
sbb-itb-99d029f
Unlocking Location Intelligence for Commercial Real Estate and Retail Webinar Recording
How Mapping Tools Solve CRE Competitive Challenges
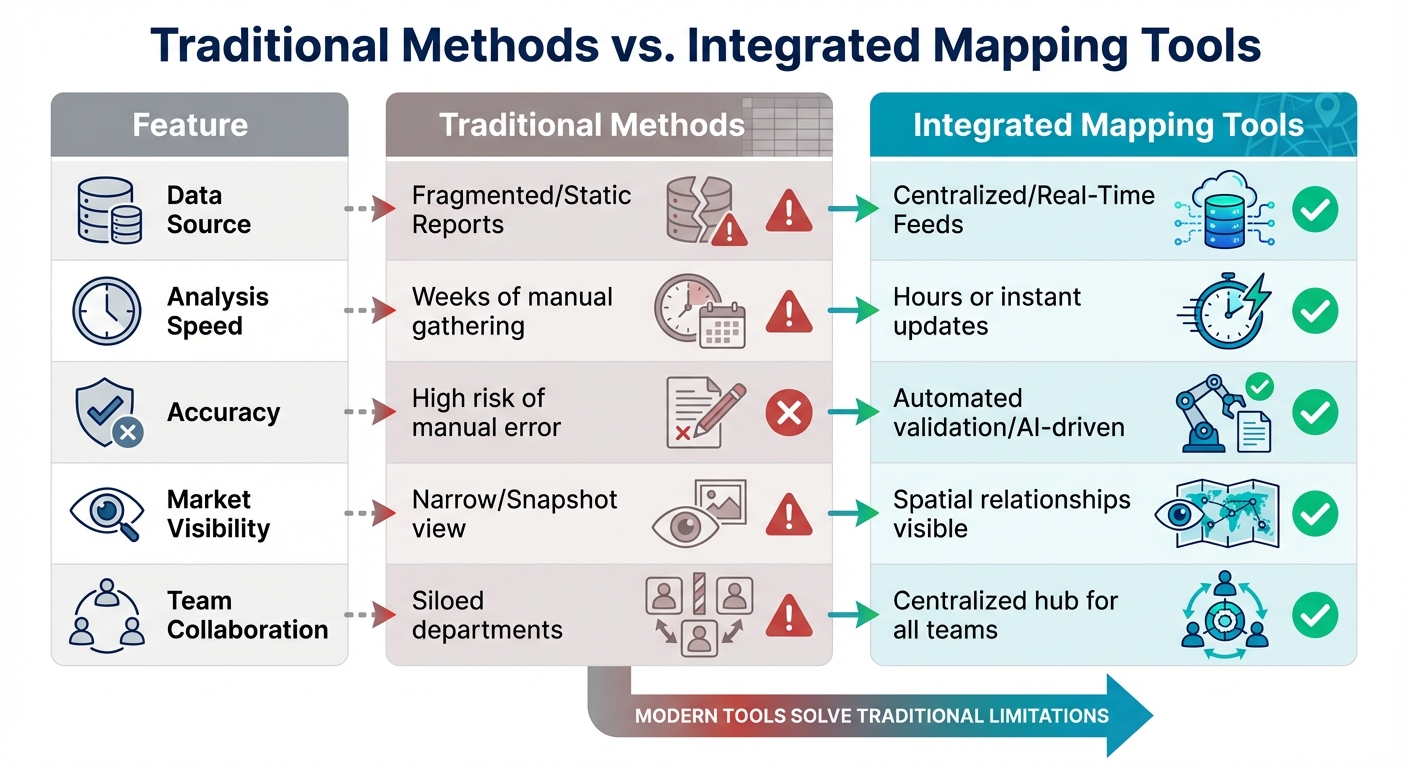
Traditional vs Modern Mapping Tools in Commercial Real Estate Analysis
Mapping tools address the challenges of fragmented data and slow analysis by delivering real-time, dynamic insights.
Real-Time Geospatial Analysis
Modern mapping tools have changed how commercial real estate (CRE) professionals evaluate competitive landscapes by enabling rapid processing of large datasets. This speed is critical, especially as U.S. office real estate values are expected to decline by over 25% by 2025[1]. In such a volatile market, tools that provide precise risk assessments are essential.
Instead of waiting weeks for static reports, professionals now have immediate access to up-to-date information on competitor locations, market trends, and property performance. For instance, when a competitor adjusts pricing or a new development begins, these changes are reflected in real time.
The geospatial analytics market is forecasted to hit $96.3 billion by 2025, with an annual growth rate of 12.9%[1]. In addition to market data, savvy professionals incorporate environmental risk information, overlaying climate and hazard data to evaluate long-term site viability and avoid unexpected maintenance costs[1].
Layered Data Visualization
Traditional spreadsheets, while useful, fall short when it comes to showing spatial relationships or market dynamics. Mapping tools overcome this limitation by merging demographic, financial, and geographic data into a single, visual interface. As FocusedCRE explains:
"By visualizing data geographically, patterns, correlations, and opportunities that may go unnoticed in traditional spreadsheets become apparent"[5].
This layered visualization allows professionals to observe how various factors interact in real time. By moving away from fragmented data sources to integrated visuals, mapping tools eliminate the need for manual reconciliation and empower teams to make confident, data-backed decisions.
Integrated Pipeline and Portfolio Tracking
Building on the advantages of layered visualization, integrating pipeline tracking into mapping tools adds another layer of strategic insight.
By combining deal pipelines with portfolio analysis and competitive intelligence, professionals gain a comprehensive view of the market. This approach eliminates the inefficiencies of juggling disconnected property databases, demographic reports, and financial models - a process prone to errors and fragmented insights.
Mapping a deal pipeline offers a spatial perspective that spreadsheets simply cannot provide. Teams can quickly identify how potential investments align geographically and strategically, helping them allocate resources wisely. For instance, they can pinpoint market clusters to invest in or avoid oversaturation in certain areas. As competitor pricing shifts or new developments arise, these updates are reflected instantly in underwriting models and deal trackers.
| Feature | Traditional Methods | Integrated Mapping Tools |
|---|---|---|
| Source | Fragmented/Static Reports | Centralized/Real-Time Feeds |
| Speed | Weeks of manual gathering | Hours or instant updates |
| Accuracy | High risk of manual error | Automated validation/AI-driven |
| Visibility | Narrow/Snapshot view | Spatial relationships visible |
| Collaboration | Siloed departments | Centralized hub for all teams |
CoreCast: End-to-End CRE Intelligence with Integrated Mapping
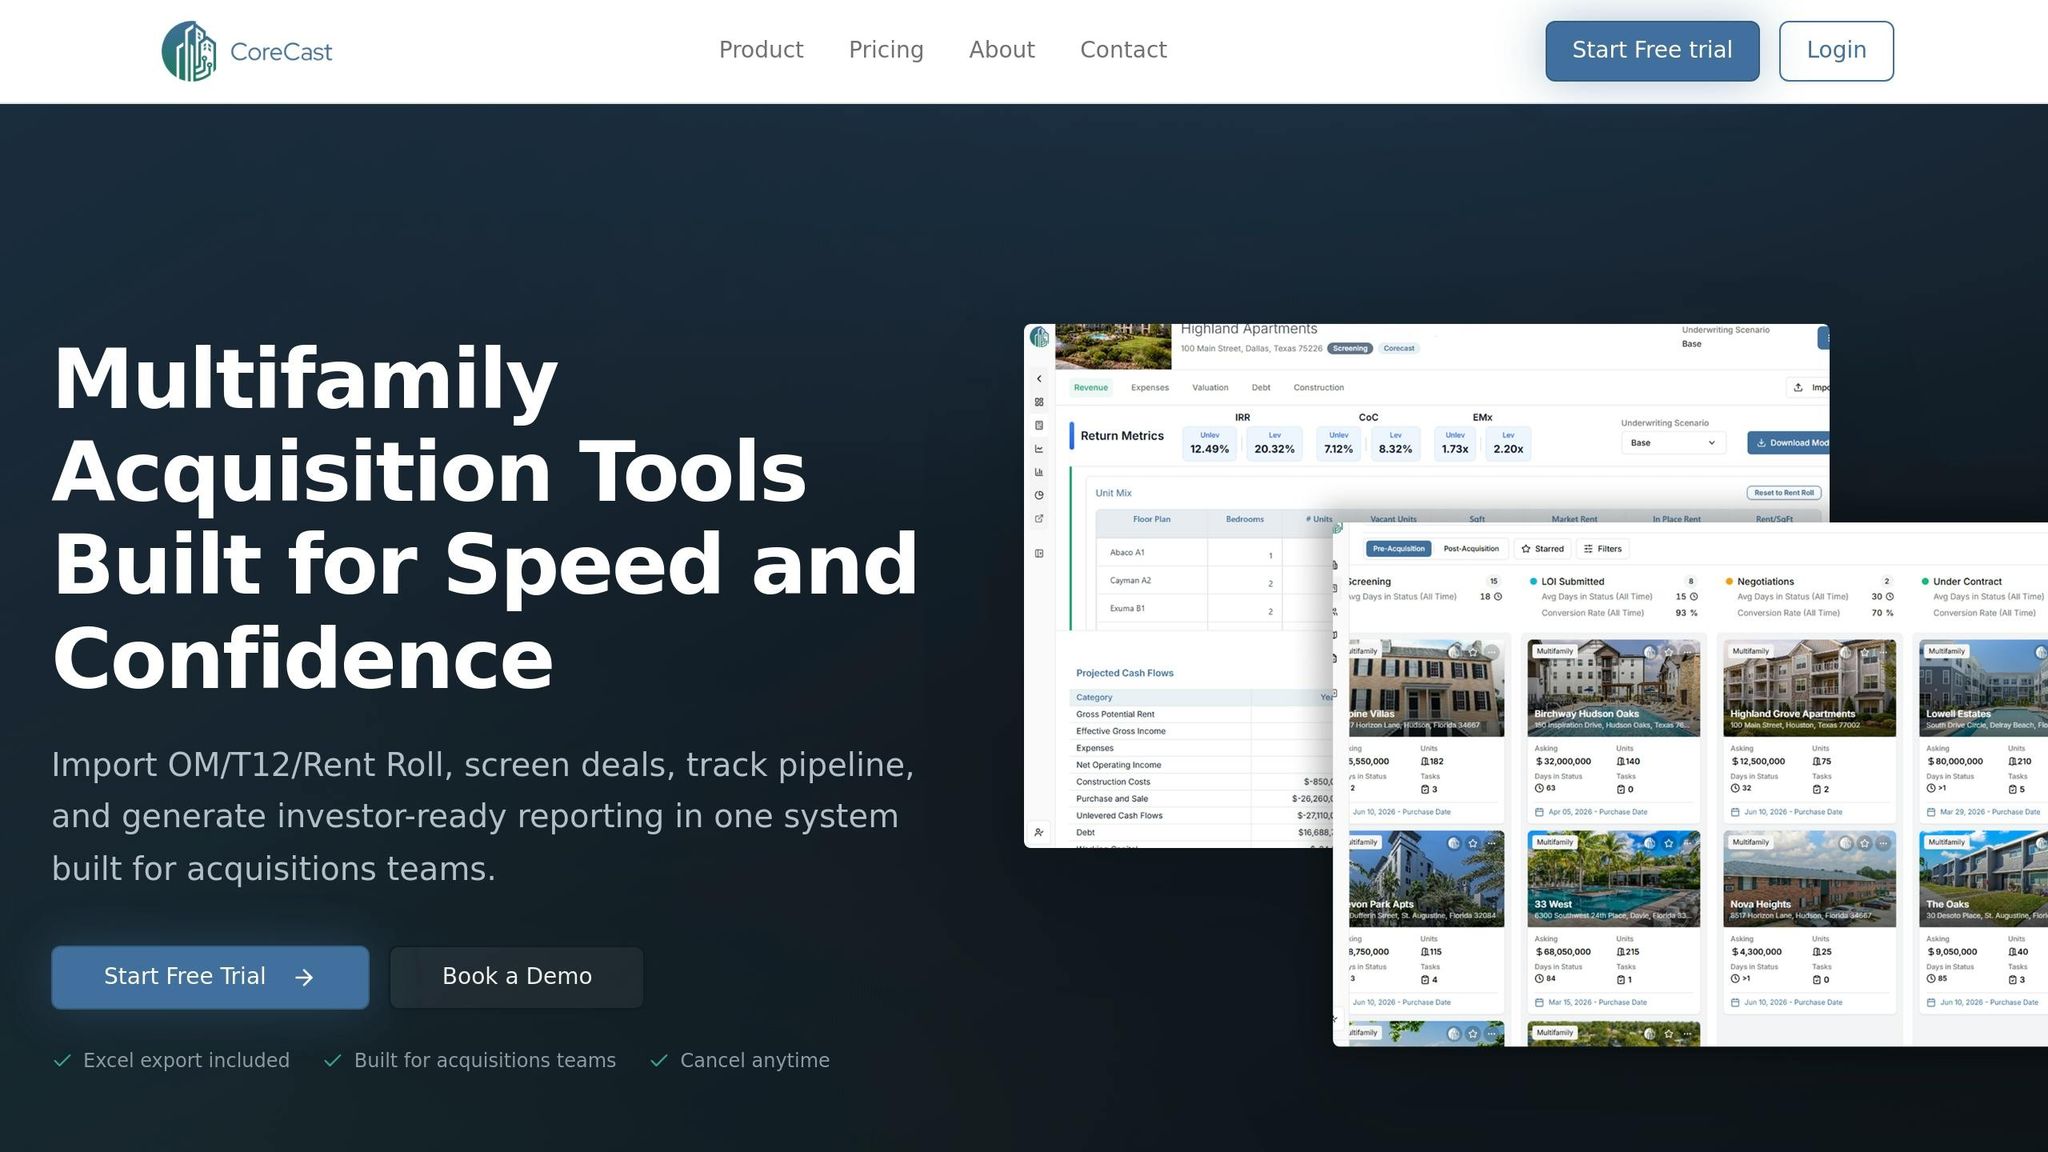
CoreCast tackles the ongoing challenges in commercial real estate (CRE) by offering a complete, streamlined solution that connects every step of the workflow. Through its platform, CoreCast (https://corecastre.com) merges underwriting, pipeline tracking, and portfolio benchmarking into one system. This eliminates the need for multiple tools, reducing errors and speeding up decision-making. With CoreCast, professionals can evaluate properties, analyze competitive landscapes, and manage deals from start to finish - all in one place.
The platform accommodates all major commercial asset categories, including multifamily, office, industrial, retail, hospitality, self-storage, medical offices, and even more specialized types like RV parks and cold storage. By directly integrating with property management systems like Yardi, AppFolio, RealPage, Entrata, and Buildium, CoreCast automates the import of historical performance data and rent rolls, cutting manual data entry from hours to just seconds.
Key Features of CoreCast's Mapping Tools
CoreCast's mapping tools bring a new level of clarity to property analysis. The integrated map allows users to view their properties alongside competitor listings, market data, and demographic overlays in real-time. Heat maps make it easy to spot high-potential neighborhoods by visualizing key metrics like listing prices, cash-on-cash returns, and vacancy rates. Drive-time analysis further enhances site evaluation by calculating accessibility and proximity to competitors within customizable radius buffers, while also incorporating traffic counts and nearby points of interest.
For portfolio benchmarking, the platform overlays your assets against market comparables, instantly highlighting performance gaps. Users can also layer zoning codes, flood zones, and sales trends to evaluate long-term viability. As Jared Stoddard from CoreCast puts it:
"CoreCast brings spatial intelligence to your pipeline so you can manage risk, allocate capital, and prioritize conversations based on market density."
Another standout feature is CoreCast's AI document parsing, which pulls data from PDFs, Excel files, or even photos and maps it directly into underwriting models. A live "Output View" updates metrics like IRR, equity multiple, and DSCR in real-time as users tweak assumptions - eliminating delays between analysis and decision-making.
Together, these tools simplify complex analyses, making pipeline tracking more efficient than ever.
How CoreCast Simplifies Competitive Landscape Analysis
CoreCast makes evaluating the competitive landscape effortless. Users can filter properties by square footage, zoning, or vacancy rates, then visualize comparable listings geographically - all within one workflow. The platform also provides map-based views of pipeline progress, showing exactly where each opportunity stands in relation to competitors and market clusters.
For instance, a REIT investor could pin 50 potential sites, apply filters for demographics and competitor density, and generate side-by-side reports - all without switching between tools. CoreCast also supports "what-if" scenarios, letting users forecast returns based on occupancy changes or other market trends. Automated stakeholder portals create branded, live reports for investors and lenders, ensuring transparency without the need for manual updates.
The Competitive Edge with CoreCast
CoreCast identifies untapped opportunities by overlaying heat maps of low-inventory zones (under 5% vacancy) with high population growth data and competitor drive-times. The platform flags parcels with ideal access to amenities, such as locations within a 10-minute drive of highways. Users can bookmark these opportunities, underwrite them using integrated comparables, and generate branded reports to share with stakeholders.
Conclusion: Using Mapping to Gain a Competitive Advantage in CRE
In commercial real estate (CRE), understanding the competitive landscape isn't just helpful - it’s critical. Properties in markets that undergo thorough competitive analysis tend to deliver 15–20% higher returns, thanks to better-informed pricing and strategic positioning[6]. Without access to real-time insights on competitor density, market trends, or demographic changes, decisions are often based on guesswork rather than accurate data.
Modern mapping tools replace outdated spreadsheets by consolidating scattered data into clear, geospatial views. These tools offer instant insights into key metrics like occupancy rates, rental comparisons, and transaction volumes. As Ivo Draginov, President of BatchData, explains:
"Data freshness means daily updates and real-time checks for content accuracy. It is what separates productive deal-making from wasted effort"[6].
The move from static reports to dynamic platforms enables faster and more informed decision-making in rapidly changing markets. With real-time insights, businesses can adapt quickly, giving them an edge over competitors.
Take CoreCast, for example. This platform integrates mapping, underwriting, pipeline tracking, and portfolio analysis into one seamless solution. It allows users to visualize properties alongside competitors, run scenario models, and create branded stakeholder reports - all without switching between tools. The result? A 30–40% reduction in operational costs for licenses and fewer errors caused by manual data handling. Users also report 20–30% faster closings and improved yields[8][7]. These capabilities make mapping tools a cornerstone of effective CRE strategies.
The real game-changer, however, is scalability. As portfolios grow, platforms with AI-driven forecasting and third-party integrations evolve alongside them, maintaining consistent, real-time intelligence across various asset types. Whether analyzing a single property or managing dozens across multiple regions, mapping tools help identify underserved areas, quantify site differences, and back up recommendations with reliable data. This scalability ensures that as your portfolio expands, so does your competitive edge.
Success in CRE often comes down to spotting opportunities before anyone else does. Mapping tools go beyond showing property locations - they uncover the hidden potential behind market trends, giving you the insights needed to stay ahead.
FAQs
What data should I map to size up competitors in a market?
To get a clear picture of your competition in the market, focus on gathering and analyzing essential data points like rental income, occupancy rates, net operating income (NOI), operating expenses, tenant profiles, property types, locations, and market trends. This information gives you the tools to understand the competitive landscape and make smarter, more informed decisions.
How do mapping tools reduce underwriting and comp errors?
Mapping tools help reduce underwriting and comparable errors by providing accurate and current geographic and property data. This improves risk evaluations and supports detailed site analysis, leading to smarter decisions and fewer mistakes.
How can CoreCast map my pipeline and portfolio in one view?
CoreCast brings your pipeline and portfolio together in one place by combining real-time data. With its interactive map and analytics dashboard, you can easily track deal stages, keep an eye on property performance, and gather market insights. This unified setup helps you make informed, data-backed decisions for all assets and pipeline stages, giving you a clear view of your competitive environment.