
Behavioral Data for Emerging Market Opportunities
Behavioral data is transforming how we identify real estate opportunities. By analyzing real-time actions like online searches, foot traffic, and spending patterns, investors can spot trends before traditional metrics catch up. For example, a surge in searches for "affordable homes in Austin" or increased foot traffic in a specific neighborhood can signal rising demand. Platforms that integrate this data help investors act faster, improve lead targeting, and make smarter decisions.
Key takeaways:
- Behavioral signals (e.g., search trends, movement patterns) reveal market shifts early.
- Real-time data allows faster responses to emerging opportunities.
- AI tools predict trends with up to 85% accuracy, combining multiple data sources.
- Unified platforms streamline decision-making and improve efficiency.
Behavioral data isn't just a tool - it's becoming a critical part of staying ahead in today's fast-moving real estate market.
AI is Watching: How to Use Behavioral Data to Sell Homes in 2026 🏠🤖
sbb-itb-99d029f
How Behavioral Data Reveals Emerging Market Opportunities
Every action we take leaves behind digital breadcrumbs, and these signals can reveal market trends long before traditional metrics catch on. Whether it's a spike in online searches, increased visits to local businesses, or shifts in spending habits, these real-time behaviors give us a sneak peek into changing market dynamics that might not show up in sales data for months.
Identifying Market Shifts Through Behavioral Signals
Some behavioral patterns are like crystal balls for spotting new opportunities - foot traffic changes, digital search activity, and consumer spending shifts are three big ones. Take Boston, for example. Analysts discovered the "Starbucks Effect", where homes near Starbucks locations appreciated in value faster than similar homes without a nearby coffee shop [2]. By tracking where new Starbucks stores popped up, investors identified high-demand areas and reaped higher returns.
When foot traffic in a neighborhood jumps by 20% or more while inventory stays the same, it often hints at rising demand and potential price increases. Similarly, digital search trends can uncover buyer preferences before they even make offers. For instance, when searches for "three-bedroom homes under $400,000" spike but listings remain steady, it signals a growing interest in that price range. One real estate agency tapped into this kind of data, combining transaction details with income demographics to tailor their campaigns by ZIP code. The result? A 30% increase in qualified leads in high-income areas [1]. Other signals, like click-through rates on listings or virtual tour activity, can also spotlight neighborhoods gaining traction. Together, these patterns offer a fast and efficient way to assess markets in real time.
The Role of Real-Time Data Processing
Timing is everything in fast-moving markets. Real-time behavioral data processing lets investors detect shifts instantly, compared to traditional methods that might take weeks or months to catch up [1]. Platforms with hourly MLS updates or live mobile location tracking can flag sudden surges in foot traffic or search activity, giving investors a head start before competitors even notice.
AI-powered tools take this a step further. By analyzing multiple signals - like geofencing data, social media sentiment, search trends, and spending patterns - these platforms can forecast property values with up to 85% accuracy [2]. They even tackle complex trends like volatility clustering, where behavioral data (like Google Trends) enhances price forecasts beyond what economic models alone can achieve [4]. The edge is undeniable: investors who monitor these signals daily and set alerts for major changes (like a 20% jump in local searches or foot traffic) can act quickly, locking in deals while they're still undervalued [1].
Key Sources of Behavioral Data for Market Insights
Behavioral Data Sources and Impact on Real Estate Investment Decisions
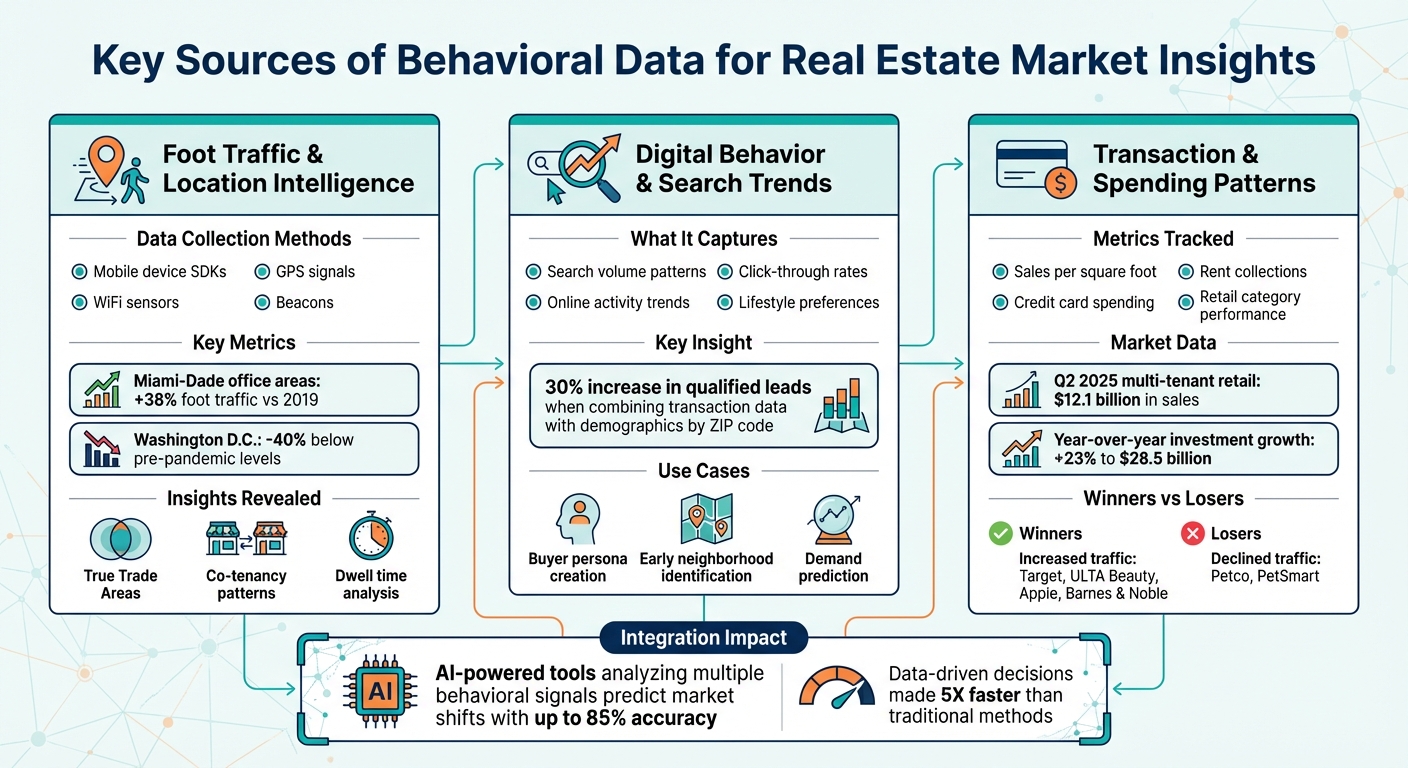
Real estate professionals rely on three main data streams to identify emerging opportunities: foot traffic patterns, digital behavior data, and transaction records. Each provides a unique perspective on consumer behavior, and together they offer a well-rounded view of shifting demand.
Foot Traffic and Location Intelligence
Foot traffic data is collected through mobile device SDKs, GPS signals, WiFi sensors, and beacons - technology that tracks actual consumer movement [5]. This data helps define "True Trade Areas", which reveal where visitors originate and how they move within a space [5]. As Unacast explains:
Foot traffic data goes beyond transactions, revealing how people actually use an area [6].
When combined with demographic data, these insights can uncover mismatches between supply and demand. For example, office-heavy neighborhoods in Miami-Dade are now seeing foot traffic levels 38% higher than in 2019, while Washington D.C. remains 40% below pre-pandemic levels [7]. Such contrasts help investors decide where to allocate resources in a hybrid-work environment. Utilizing a real estate deal analysis tool can further refine these investment choices by calculating potential returns based on these shifting patterns.
Foot traffic data also enables analysis of co-tenancy, showing whether visitors to a potential site frequent locations that attract your target audience. Additionally, monitoring dwell time can reveal how changes, like renovations, affect visitor retention [5].
While physical movement data highlights where demand is shifting, digital behavior provides insights into the motivations behind those shifts.
Digital Behavior and Search Trends
Digital behavior data captures the "why" behind consumer actions, offering a window into lifestyle preferences, values, and online activities. This psychographic layer aids in creating detailed buyer personas and helps predict market demands before they become evident in sales. Metrics like search volume and click-through rates can even spotlight up-and-coming neighborhoods early in their growth.
To complement these insights, transaction data offers a more concrete measure of economic activity.
Transaction and Spending Patterns
Transaction data - covering metrics like sales per square foot, rent collections, and credit card spending - provides a clear picture of a neighborhood's economic health. Paired with foot traffic data, it can identify thriving retail categories using real-time CRE analytics. For instance, brands like Target, ULTA Beauty, Apple, and Barnes & Noble have seen increased visitor traffic since 2019, whereas Petco and PetSmart have experienced declines [7]. Such insights help pinpoint anchor tenants that contribute to a neighborhood's vibrancy.
Cross-referencing these data streams with local infrastructure developments - such as new transit lines or data centers - can help distinguish long-term growth from temporary trends [6]. Additionally, in areas with high migration but slower construction, tracking housing starts alongside population movements can provide a clearer picture of supply-demand imbalances [6].
Using Behavioral Data for Better Investment Decisions
Leverage behavioral data to predict trends, refine tenant strategies, and perfectly time market moves to maximize returns.
Forecasting Market Trends with Predictive Analytics
Predictive analytics combines consumer behavior, demographics, and infrastructure data to anticipate market changes. Instead of just analyzing historical trends, these tools track alternative behavioral signals - like job postings, commuting patterns, and workplace policies - to spot shifts in neighborhood demand before they reflect in property prices.
Take labor market signals, for instance. They can highlight areas poised to attract high-income professionals. In 2025, Northern Florida saw a 1.4% job growth rate, outpacing the national average of 1.2%. Texas wasn’t far behind, with a growth rate of 1.3%, also exceeding the national benchmark.
Geospatial analytics goes even deeper by evaluating factors like commute times, access to retail, and walkability to identify emerging "hot zones" with strong growth potential. Machine learning models take it a step further, analyzing non-traditional factors such as local service quality and social sentiment to refine forecasts. These tools help investors identify opportunities in neighborhoods gaining popularity due to hybrid work trends or in areas where energy-efficient homes attract sustainability-minded buyers.
Such insights also help landlords fine-tune their tenant strategies.
Optimizing Tenant Mix and Amenities
Behavioral data empowers property owners to make smarter decisions about tenant selection and amenities. Void analysis uses demographic insights, foot traffic data, and tenant performance metrics to identify gaps in the market and find the "ideal tenant" to enhance the existing mix [3]. Meanwhile, cross-shopping pattern analysis examines mobile data to understand where consumers shop during a single trip - like visiting a coffee shop and a bookstore - helping landlords strategically position tenants for maximum synergy [3][8].
The numbers back this up. In Q2 2025, the multi-tenant retail sector generated $12.1 billion in sales, with investments climbing 23% year-over-year to $28.5 billion [9]. Heat mapping further aids tenant placement by identifying high-traffic zones for impulse-buy retailers and quieter areas for essential services [8]. These data-driven strategies allow professionals to make real estate decisions five times faster than traditional methods [3].
David Chastain from Epsilon sums it up well:
"'People walked by your storefront!' doesn't satisfy tenants who expect measurable performance." [9]
Landlords are moving beyond basic foot traffic metrics to "buyer-level" data, which tracks actual conversions and spending. This approach lets property owners show tenants a clear return on investment by linking property visits directly to revenue [9]. Testing new concepts with pop-up spaces and flexible leases also allows landlords to experiment with amenities before committing to long-term changes [8].
Once tenant strategies are optimized, the next step is pinpointing the best time to enter or exit the market.
Timing Investments for Maximum Returns
Real-time analytics tools are key to acting on emerging opportunities. By using these tools, investment teams can close deals faster without sacrificing outcomes. Instead of waiting for trends to fully emerge, predictive analytics helps investors identify "hot zones" or neighborhoods just starting to see increased demand.
Behavioral data tracks subtle changes in pricing, demographics, and consumer behavior to signal market cycles, helping investors decide exactly when to buy or sell. For short-term forecasting and accurate property valuation, focusing on comparable sales from the last three to six months is critical. Migration trends, like population growth in Sunbelt cities such as Charlotte or Jacksonville, can also reveal long-term appreciation opportunities before they become widely recognized.
Scenario modeling adds another layer of precision by testing variables like rent growth or interest rate changes. This is particularly useful during economic or policy shifts - such as zoning law updates or interest rate hikes - helping predictive models estimate their impact on buyer demand and transaction volumes. Cross-referencing behavioral data with public records and on-site inspections ensures decisions are based on reliable, actionable insights.
Building a Unified Data Strategy with CoreCast

In real estate, fragmented data often slows decision-making and forces teams to spend weeks gathering information that should take just hours. CoreCast steps in as an end-to-end real estate intelligence platform, combining behavioral data, market analytics, and portfolio management into a single system. This unified setup connects various data sources, turning scattered information into actionable insights.
CoreCast's Role in Consolidating Behavioral Data
CoreCast brings together diverse data streams - such as location intelligence, digital trends, and transaction patterns - into one centralized platform. Instead of juggling multiple tools, users can access real-time updates on market conditions, competitive landscapes, and emerging opportunities, all in one place. This shift replaces outdated quarterly reports with continuous, real-time feeds that reflect current market dynamics.
One standout feature is CoreCast's integrated mapping tool, which allows users to perform spatial analysis. Professionals can visualize properties alongside behavioral data like foot traffic patterns, demographic changes, and infrastructure developments. This helps identify "hot zones" before they gain widespread attention, giving investors a timely advantage. By merging these data points, CoreCast enhances efficiency throughout the entire investment process.
Improving Workflows and Decision-Making
With CoreCast, workflows become more streamlined by centralizing key tasks like underwriting, pipeline tracking, portfolio analysis, and stakeholder reporting. Users can underwrite assets across various classes and risk profiles, track deals through every stage, and generate automated, branded reports with a single click - saving hours of manual effort.
The platform's pipeline tracker offers clear visibility into deal stages, enabling teams to prioritize opportunities and manage resources effectively. portfolio performance tracking tools allow for detailed comparisons across holdings, while the stakeholder center provides tailored updates to keep investors and partners informed. This integrated approach cuts decision-making time from weeks to mere hours, enabling quicker and more confident actions.
Future Innovations in Behavioral Data Integration
CoreCast is gearing up to expand its functionality with AI-driven automation. Upcoming features like AI-powered analytics, construction management tools, and enhanced investor relations modules aim to automate workflows and improve forecast accuracy. These advancements will help real estate professionals anticipate market changes and seize new opportunities as they emerge, ensuring behavioral data remains central to staying competitive in a fast-moving industry.
Conclusion
Behavioral data is changing how real estate professionals spot and act on market opportunities. Instead of relying on outdated reports or gut feelings, investors now use real-time insights like foot traffic patterns, online search trends, and transaction data. This approach helps them identify high-growth areas before they become overcrowded, fine-tune tenant mixes based on actual consumer behavior, and time their investments with precision. Unified data platforms have made these insights more accessible [1].
However, one major hurdle persists: turning scattered data sources into actionable insights through automated collection. Fragmented tools often lead to wasted time - weeks that could be condensed into hours with the right system.
CoreCast addresses this issue by bringing all data streams into one place. As a comprehensive real estate intelligence platform, CoreCast consolidates behavioral data and analytics, allowing users to underwrite any asset class, visualize properties alongside demographic and foot traffic trends on interactive maps, and create branded reports - all within a single system. This streamlined setup eliminates inefficiencies from switching between tools, enabling faster and smarter decisions.
Looking ahead, AI-driven automation will further enhance behavioral data integration. CoreCast's upcoming features, like AI-powered analytics and advanced forecasting tools, will help professionals predict market shifts more accurately and respond to trends as they happen. These advancements align perfectly with the need for proactive market engagement. As behavioral data continues to evolve, platforms that centralize these insights will become critical for staying competitive in an increasingly data-focused industry.
Using a unified platform isn’t just a smart move - it’s essential in today’s fast-paced market. Real estate professionals who embrace these tools gain the ability to spot opportunities sooner, make better investment choices, and secure long-term success.
FAQs
What behavioral signals matter most for spotting an emerging market?
Key behavioral signals that can help spot an emerging market include rising property values, increasing rental demand, population growth, and shifts in foot traffic trends. Other important clues are changes in consumer spending habits, online search activity, and social media sentiment. Together, these indicators reveal where buyer and tenant interest is gaining momentum, offering insight into areas with growth potential.
How can I confirm a “hot zone” isn’t just a short-term spike?
To determine if a "hot zone" is showing genuine, sustained growth rather than just a temporary surge, it's essential to look at several key indicators over an extended period. These include steady increases in property values, low vacancy rates, growing rental demand, and continuous infrastructure development in the area. Combining real-time data with historical trends helps validate these patterns and evaluate the area's long-term potential.
How does CoreCast unify behavioral data into one workflow?
CoreCast brings together behavioral data from multiple sources into a single, unified platform. This setup allows for real-time insights and incorporates predictive analytics, making it easier to analyze trends, forecast outcomes, and make decisions - all within one seamless workflow.