
How Predictive Analytics Boosts Rental Yields

Predictive analytics is transforming rental property management by helping owners and managers make data-driven decisions. Instead of relying on intuition, this approach uses historical and real-time data to forecast trends and property values, optimize rental pricing, and minimize vacancies. Here's why it matters:
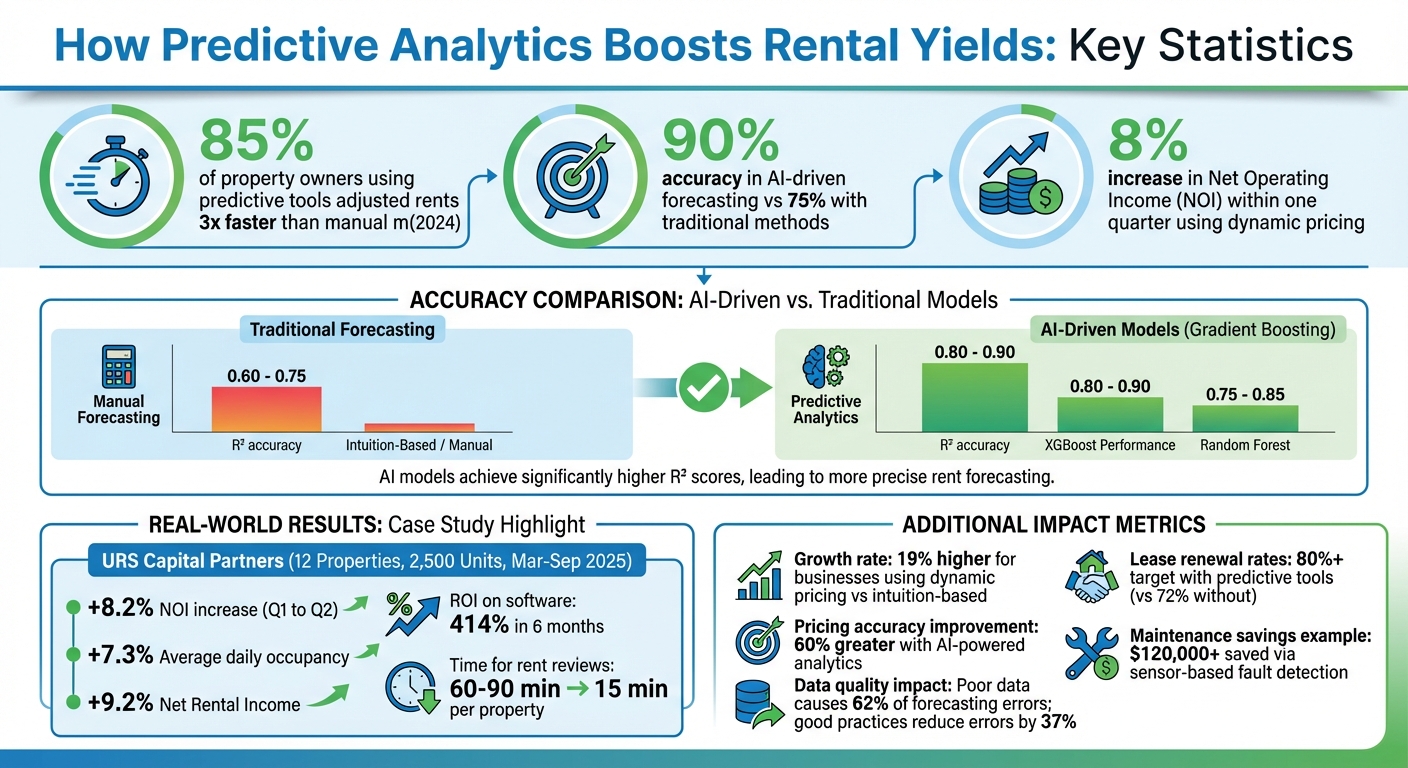
- Faster Pricing Adjustments: In 2024, 85% of property owners using predictive tools adjusted rents up to 3x faster than manual methods.
- Higher Accuracy: AI-driven models achieve up to 90% accuracy in forecasting, compared to 75% with traditional methods.
- Revenue Growth: Tools like dynamic pricing systems have shown to increase Net Operating Income (NOI) by over 8% within just a quarter.
Predictive Analytics Impact on Rental Property Performance: Key Statistics and ROI
What Predictive Analytics Means for Real Estate
Predictive Analytics Explained
Predictive analytics uses historical and current data to forecast future trends and outcomes. Unlike traditional methods that focus on past metrics like rent levels or recent vacancy rates, it uncovers patterns across a wide range of factors - employment rates, local development projects, seasonal demand, and demographic trends - to estimate what’s likely to happen next.
In real estate, this approach allows for proactive management instead of merely reacting to market changes. For example, while traditional forecasting might assume a steady 3% annual rent increase, predictive analytics acknowledges that market behavior is rarely linear. It processes diverse datasets quickly, adapting to real-time changes like new construction projects or shifts in local employment [1].
Machine learning algorithms play a central role here, constantly refining forecasts. For instance, if data shows an increase in "Days on Market" for a particular ZIP code, predictive models might flag a potential rise in vacancy rates within the next 90 days. These early warnings, often missed in manual analyses, empower property managers to adjust rental pricing on the fly [1].
How Predictive Analytics Affects Rental Income
Predictive analytics doesn’t just forecast trends - it directly impacts rental income by enabling smarter pricing strategies. Accurate forecasts lead to better pricing decisions, higher occupancy rates, and reduced revenue loss. By anticipating demand changes before competitors, property managers can adjust rents strategically rather than scrambling to fill units after prolonged vacancies.
For instance, predictive models can detect "vacancy creep" - a slow rise in Days on Market that suggests rents may be too high - before it significantly affects occupancy rates [1].
Traditional forecasting methods typically achieve an R² (a measure of accuracy) between 0.60 and 0.75. In comparison, AI-driven models using advanced techniques like gradient boosting achieve R² values between 0.80 and 0.90 [1]. This increased accuracy results in fewer mispriced units, quicker lease-ups, and improved Revenue Per Available Unit (RevPAR). RevPAR is a critical metric for evaluating whether pricing strategies are effectively driving revenue, even when occupancy fluctuates [1].
Another major benefit is scenario analysis. Predictive analytics allows property managers to simulate how rental income might respond to events like major layoffs at a local employer, the construction of competing properties, or changes in interest rates. This "what-if" analysis turns uncertainty into actionable insights, helping managers make informed decisions [1].
sbb-itb-99d029f
Data Types That Drive Rental Income Optimization
Core Data Sources
Predictive analytics thrives on combining multiple data streams to paint a clear picture of rental performance. At the heart of this process is property-level data. This includes details like historical occupancy rates, tenant turnover, lease expiration dates, maintenance requests, and payment histories. These internal metrics act as a foundation, offering a snapshot of how a property has performed over time.
Adding to this is market and competitor data, which provides essential context. Metrics such as Average Daily Rate (ADR), occupancy levels, and Revenue Per Available Room (RevPAR) help benchmark performance. These "comp sets" - groups of comparable properties in the same submarket - can pinpoint if challenges stem from pricing, distribution, or property quality. For example, during the FIFA World Cup 2026, host markets saw a 29% increase in reservations and a 25% rise in ADRs, underscoring how external events can influence these metrics [4].
Economic indicators play a broader role in understanding demand. Employment data from the Bureau of Labor Statistics, such as job growth and unemployment rates, directly ties to rental demand. On the demographic side, U.S. Census Bureau data - covering population growth, age distribution, and household formation - helps predict longer-term housing trends. Meanwhile, local development data on building permits and planned construction offers insights into upcoming competition, helping managers stay ahead of new supply hitting the market.
The growing emphasis on hyperlocal modeling shifts the focus to neighborhood or ZIP code-level insights, moving away from city-wide averages [3]. This level of detail is critical, as properties just a few blocks apart can experience vastly different trajectories due to factors like school ratings, walkability, or crime rates. Of course, all these insights hinge on maintaining high-quality data for accurate forecasting.
Why Data Quality Matters
The reliability of predictive models depends entirely on the quality of the data feeding them. Even the most advanced algorithms can't compensate for inaccurate or incomplete data. Poor data quality can lead to flawed cash flow projections, whether due to errors in lease terms, rent escalation clauses, or expense reimbursements. For instance, a regional REIT saved over $2 million in potential losses by using AI to identify leases in flood-prone areas, combining rental data with climate risk insights to mitigate exposure effectively.
Standardization is key. Using consistent naming conventions, date formats, and measurement units across a portfolio ensures accurate comparisons and simplifies consolidating individual models into a single, cohesive view. Automated validation tools can catch inconsistencies and outliers early, but manual checks remain vital - especially for lease terms and financial metrics where precision is non-negotiable.
Another challenge is model drift. As tenant behaviors and market conditions evolve, algorithms based on outdated data lose their effectiveness. Regularly retraining these models ensures forecasts stay relevant [5]. The effort pays off: 81% of commercial real estate firms have identified data and technology as top spending priorities for 2025, acknowledging that better data practices can boost tenant retention rates from 72% to 87% [5]. Clean, standardized data doesn't just improve forecasting - it directly impacts rental income optimization, making it a cornerstone of effective property management.
Technology Behind Predictive Analytics
Machine Learning Models for Rental Analysis
Machine learning models are at the heart of predictive analytics for rental income, processing large datasets to uncover patterns and trends. These models range from straightforward statistical approaches to more advanced ensemble techniques.
ARIMA (Autoregressive Integrated Moving Average) is a classic time series model that uses historical rental data and past forecast errors to predict short-term trends. It works best in markets where seasonal variations are minimal but struggles when annual patterns are prominent[6].
SARIMA and SARIMAX enhance ARIMA by accounting for seasonal trends and external factors, like employment rates or interest rates, improving their ability to forecast over longer periods[6].
XGBoost (Extreme Gradient Boosting) is a standout performer for rental forecasting, delivering R² scores between 0.80 and 0.90 by effectively capturing complex, non-linear relationships. For instance, it can analyze how proximity to a new transit line interacts with factors like local school ratings. In contrast, Random Forest models achieve slightly lower R² scores, typically between 0.75 and 0.85[1][6].
One major challenge remains: poor data quality. It accounts for around 62% of forecasting errors, highlighting the importance of automated data validation techniques such as IQR detection[6]. As Indraneel Dutta Baruah aptly puts it:
How well we clean and understand the data has a tremendous impact on the quality of the results[6].
These advanced models form the backbone of dynamic pricing systems, enabling real-time rent optimization.
Dynamic Pricing and Rent Optimization
Dynamic pricing systems take predictive analytics a step further, converting forecasts into real-time rental rate adjustments. These systems leverage live data - such as competitor pricing, occupancy rates, and local events - to make instant pricing changes[7]. This approach has proven effective, with businesses using it seeing growth rates 19% higher than those relying on intuition alone[6].
By analyzing historical trends alongside current market signals, these algorithms can anticipate demand shifts and adjust prices before competitors react. For example, if a major conference is scheduled months in advance, the system can recommend higher rates well ahead of time. On the flip side, if an influx of new housing supply is expected to impact demand, the model might suggest lowering rates strategically to maintain occupancy.
Automated recalibration ensures pricing remains accurate and eliminates errors often found in manual processes[7][8]. Predictive analytics also supports lease renewals by identifying the best timing and pricing strategies to reduce income gaps.
To implement these systems effectively, a strong technical infrastructure is essential. This includes API integrations between property management software, listing platforms, and analytics tools to facilitate smooth data exchange[1]. Auditing historical data across multiple seasonal cycles is also crucial for reliable forecasting. Pilot programs can be used to test algorithm recommendations through A/B testing before full deployment[1]. This seamless blend of forecasting and pricing adjustments leads to higher occupancy rates and better rental income.
Practical Applications and Performance Tracking
Case Studies: Predictive Analytics Results
Between March and September 2025, URS Capital Partners implemented an integrated revenue management platform across 12 properties, totaling 2,500 units in the Southeast U.S. and Maine. The results were impressive: an 8.2% increase in Net Operating Income (NOI) from Q1 to Q2 2025. Key outcomes included a 7.3% boost in average daily occupancy, a 9.2% rise in Net Rental Income (NRI), and a 414% return on investment (ROI) for the software within just six months. Notably, the time required for rent reviews dropped significantly - from 60–90 minutes to just 15 minutes per property [9].
Chris Urso, reflecting on this transformation, shared:
Our fantastic AI-driven revenue management tool has shifted our thinking. We are focused on NOI and total revenue rather than holding rents too long or relying on concessions. [9]
Predictive analytics also proved valuable in operational efficiency. For example, implementing sensor-based fault detection helped property owners avoid costly maintenance issues. In one instance, the system prevented HVAC failures across 22 units, resulting in savings of over $120,000 in repair costs and leasing losses [5].
These examples illustrate how predictive analytics delivers measurable outcomes, from increased revenue to operational savings. Centralizing this data within a real estate investment source of truth ensures these insights remain actionable across the entire portfolio.
Key Performance Metrics
Tracking specific metrics is crucial for understanding and validating the impact of predictive analytics. Here are some key metrics to monitor:
- Revenue Per Available Unit (RevPAR): Calculated by dividing monthly rental income by total available units, this metric reflects pricing power.
- Occupancy Rate: Shows the percentage of occupied units compared to total units, measured against market benchmarks.
- Lease Renewal Rate: Tracks the percentage of leases renewed at expiration. Predictive strategies aim for rates of 80% or higher, reducing turnover and vacancy costs [5].
- Average Days on Market: Measures the time from listing to lease execution. A shorter timeframe indicates pricing aligns well with demand [1].
- Price Variance Analysis: Compares algorithm-recommended prices with actual rents achieved, helping identify and correct pricing biases [1].
| Metric | Calculation | Industry Benchmark |
|---|---|---|
| Occupancy Rate | (Occupied Units / Total Units) × 100 | 92.9% [1] |
| RevPAR | Monthly Rental Income / Total Available Units | Higher values indicate stronger pricing [1] |
| Lease Renewal Rate | (Renewed Leases / Expiring Leases) × 100 | Target: 80%+ with predictive tools [5] |
| Days on Market | Time from listing to lease execution | Lower values indicate effective pricing [1] |
| Net Operating Income (NOI) | Total Income - Operating Expenses | +8.2% quarterly growth via predictive tools [9] |
How to Implement Predictive Analytics for Rental Income
Implementation Steps
To get predictive analytics up and running in rental operations, you need a well-organized plan. The first step is to establish a strong data foundation. Bring together historical rent rolls, lease agreements, occupancy rates, and market comparisons into a centralized system. Then, clean the data thoroughly - this is crucial because poor data quality is responsible for about 62% of forecasting errors in real estate. On the flip side, implementing strong data quality practices can cut these errors by 37% [6].
Once your data is ready, the next step is selecting and training the right models. The choice of algorithm depends on your data. For example, ARIMA is great for spotting trends, SARIMA handles seasonal patterns, and machine learning models like Random Forest are ideal for more complex datasets. Train these models using your historical data, and then validate their performance by comparing predictions with past outcomes. Use metrics like Mean Absolute Error (MAE) or Root Mean Squared Error (RMSE) to measure accuracy [6].
After validation, integrate these models into your daily operations. Use them for dynamic pricing strategies, occupancy forecasts, and deciding the best times to adjust rents. Run simulations to test pricing scenarios and predict occupancy under different market conditions. To make this process seamless, connect your analytics tools to property management platforms like Buildium, AppFolio, or Rentec Direct. This integration allows for automated data updates and creates feedback loops that refine your predictions over time [10].
If you're looking for a streamlined way to manage this entire process, check out CoreCast.
CoreCast: An End-to-End Platform
CoreCast is a platform designed to simplify predictive analytics for real estate professionals. It combines everything you need into one system, using advanced statistical models like ARIMA for trend analysis, SARIMA for seasonal patterns, and SARIMAX for external factors such as interest rates. These tools help with rental forecasting, underwriting across different asset types, tracking deals through various stages, and conducting in-depth portfolio analysis - all from a single platform [6].
CoreCast also offers interactive property mapping, custom-branded reports, and automated forecasting capabilities. By integrating directly with property management systems, it ensures smooth data flow and prioritizes actionable insights over basic bookkeeping. During its beta phase, CoreCast is priced at $50 per user per month. After launch, the pricing will include tiers: $75 for the Essentials plan, $100 for the Pro plan, and $105 per month for access to automated forecasting features [6].
AI Rental Property Investment Software App - Make Smarter Rental Investments & Boost Cap Rate & NOI
Conclusion
Predictive analytics has moved from being just an optional tool to becoming a key player in rental property management. With market conditions growing more complex, relying solely on traditional pricing methods or local expertise often falls short. Decisions based purely on intuition can lead to overpaying during market highs or missing out on undervalued opportunities entirely [2].
The shift to data-driven approaches is yielding tangible results. Properties leveraging AI-powered predictive analytics can achieve up to 60% greater pricing accuracy compared to manual methods. Dynamic pricing now adapts in real time, replacing outdated, static updates. That said, even the best algorithms can't account for every nuance in the market.
Predictive analytics serves as a reliable guide but works best when paired with human insight. Successful investors know how to balance advanced forecasting models with local expertise, recognizing that algorithms might overlook sudden regulatory changes or shifts that only firsthand experience can detect [2].
Getting started with predictive analytics doesn’t have to be complicated. It begins with clean, organized data and selecting models that align with your portfolio's needs. Platforms like CoreCast simplify this process by offering end-to-end tools for underwriting, pipeline tracking, and portfolio analysis. By integrating predictive analytics into daily operations, you not only streamline your workflow but also position your investments for long-term growth.
FAQs
What data do I need to start using predictive analytics for rent pricing?
To apply predictive analytics for rent pricing, start by collecting detailed and relevant data. This includes property details like unit layouts and available amenities, as well as market trends such as rental demand and vacancy rates. Don't overlook broader economic factors like employment levels and migration patterns, as these can heavily influence pricing.
You should also consider demographic changes, regional construction activity, and historical transaction data. The more granular and comprehensive your dataset, the better your models can predict rent prices, helping you remain competitive in the market.
How often should pricing models be retrained to avoid model drift?
Pricing models need regular retraining - ideally every 6 to 12 months. Why? Because market conditions change, and without updates, models can drift away from accuracy. By keeping them updated, you ensure they stay aligned with current trends and continue providing reliable, actionable results.
How do I connect predictive analytics to my property management system without disrupting operations?
To connect predictive analytics with your property management system, first check whether your system allows API connectivity or supports third-party integrations. Look for a platform that works well with your existing setup to automate data sharing - like analyzing tenant behavior or tracking market trends. Start small by testing the integration in phases, such as running a pilot program, to confirm everything functions correctly. Opting for cloud-based solutions can further streamline the process by providing real-time updates and reducing potential disruptions.