
How Geospatial Data Enhances Property Insights

Real estate decisions are no longer driven by guesswork or outdated data. With geospatial technology, you can analyze location-based insights like demographic trends, infrastructure developments, and even climate risks to make smarter investment choices. Here's why this matters:
- Precision: Move beyond zip codes to identify emerging micro-markets with pinpoint accuracy.
- Risk Analysis: Visualize risks like flood zones or wildfire areas before committing to a property.
- Growth Prediction: Spot neighborhood trends early by layering multiple datasets, from zoning maps to mobility data.
- Competitive Edge: Over 83% of real estate professionals say geospatial tools give them an advantage.
This approach transforms how we evaluate properties, from uncovering hidden opportunities to forecasting future demand. Platforms like CoreCast make it easier by combining mapping, real-time data, and benchmarking and portfolio analysis into one tool. Ready to move beyond intuition and start using data-driven insights? Geospatial analytics is your answer.
What is Geospatial Data and How Does it Apply to Real Estate?
Defining Geospatial Data
Geospatial data is all about tying information to a specific location on or near the Earth's surface. It blends three key components: location coordinates (like latitude and longitude), attributes (such as building type or population density), and temporal details (tracking changes over time) [8][11]. Essentially, it answers the "where" and "when" for every data point.
In real estate, geospatial data comes in two main forms. Vector data represents discrete features using points, lines, and polygons - think property boundaries, roads, or city limits [7][11]. On the other hand, raster data uses grid cells to display continuous data like satellite imagery, elevation, or temperature maps [10][11]. Tools like ArcGIS and QGIS are widely used to manage, analyze, and visualize these datasets [7][10].
What makes geospatial data so powerful is its ability to layer multiple datasets to uncover patterns that spreadsheets simply can't show. For example, combining demographic trends with zoning maps and transit routes can reveal hidden relationships, offering insights that drive more informed real estate decisions [9][13].
Why Real Estate Professionals Need Geospatial Data
For real estate professionals, geospatial data is a game-changer. Property values are deeply influenced by the surrounding environment - social, economic, and physical factors all come into play. Geospatial tools allow professionals to measure these connections with precision. With 58% of homebuyers listing neighborhood quality as their top concern [14], geospatial analysis helps define what "quality" means by examining factors like income levels, education rates, crime statistics, and access to infrastructure.
This data also enables highly specific, block-by-block analysis of neighborhood trends, often years before they become obvious to the broader market [5][4]. Modern GIS platforms now offer access to over 15,000 variables down to the block group level [4], making it easier to spot emerging hotspots and undervalued areas before others do.
Risk assessment is another area where geospatial data shines. It helps visualize whether a property is located on an earthquake fault line, in a flood zone, or near wildfire-prone areas - factors that can affect insurance costs and long-term value [12][13]. With more than 60% of property companies investing in Location Intelligence technology [12], integrating geospatial analysis into your workflow is no longer optional - it's essential for staying competitive.
sbb-itb-99d029f
Types of Geospatial Data Used in Property Analysis
Demographic and Socioeconomic Data
Understanding the profiles and spending habits of residents plays a critical role in predicting property performance. Key metrics like median household income, education levels (such as the percentage of residents with bachelor's degrees), and employment trends help forecast purchasing power and rental demand [6][5].
Today, investors lean toward dynamic, real-time data rather than relying solely on outdated census reports. Aggregated credit card transaction data, average purchase prices, and retail spending patterns offer deeper insights into sales potential and tenant suitability [15]. On top of that, location-tagged social media activity - like mentions and reviews on platforms such as Yelp and Foursquare - can provide a snapshot of a neighborhood's popularity and nightlife trends [6][5].
Between 2018 and 2022, Enterprise Community Partners showcased the power of this approach by using an opportunity mapping tool that combined 47 variables, including access to transportation, school quality, and economic opportunity metrics. The result? Affordable housing projects guided by this analysis saw a 35% improvement in resident economic mobility over five years [6].
The real advantage comes from layering multiple datasets. Combining traditional demographic information with mobility data (like visitor activity) reveals not just who lives in an area but also who visits and spends money there [5][15]. Additionally, tracking building permits can highlight investment trends and neighborhood changes [6].
Next, environmental and land use data offer another layer of critical insights for property analysis.
Environmental and Land Use Data
Environmental data helps assess risks and uncover opportunities tied to property investments. Factors such as flood zones, protected wetlands, wildfire boundaries, seismic risks, and zoning restrictions all influence property valuation and long-term strategies [2][3].
High-resolution satellite imagery adds another level of detail by tracking land use changes, encroachments, and construction progress on adjacent properties - often offering a more up-to-date perspective than physical inspections [1]. Long-term climate models, such as heat maps and sea-level rise projections, are also being integrated into property evaluations to predict future risk exposure and refine investment strategies [1][3].
For example, in 2022, JP Morgan Asset Management used geospatial analysis to evaluate their portfolio's exposure to rising sea levels. By overlaying NOAA coastal inundation models with property locations, they identified $87 million in assets at critical risk. This led to a targeted divestment plan and physical upgrades, cutting climate risk exposure by 62% across key properties [3].
Similarly, in 2023, a residential developer in Phoenix, Arizona, teamed up with CBRE to assess water stress risks for potential sites. By incorporating groundwater depletion data and municipal infrastructure maps, they identified locations where developments could achieve 40% lower water consumption compared to market averages [3].
In addition to these environmental insights, proximity data sheds light on how nearby amenities and infrastructure impact property value.
Proximity to Amenities and Infrastructure
The value and desirability of a property are heavily influenced by its proximity to employment hubs, retail centers, schools, and transportation. For instance, 44% of homebuyers rank proximity to their workplace as a top priority when choosing a property [6].
For commercial properties, access to amenities directly affects visitor activity patterns, which in turn impacts sales forecasts and tenant selection [15][1]. Tools like walking and driving isochrones, combined with real-time mobility data, help measure true accessibility and visitor volume while accounting for barriers like highways or rivers [5][15][1].
Layering Point of Interest (POI) data - highlighting nearby competitors or anchor businesses - with mobility data provides a clearer picture of not just what's nearby but also how many people visit those locations [15].
Finally, tracking upcoming infrastructure projects, such as new rail lines or road expansions, can reveal emerging opportunities before property values rise. Monitoring building permits and public infrastructure plans can also offer early signs of neighborhood transformation, helping investors make more informed decisions [6][1].
Unlocking Location Intelligence for Commercial Real Estate and Retail Webinar Recording
How to Use Geospatial Data for Property Analysis
3-Step Process for Using Geospatial Data in Property Analysis
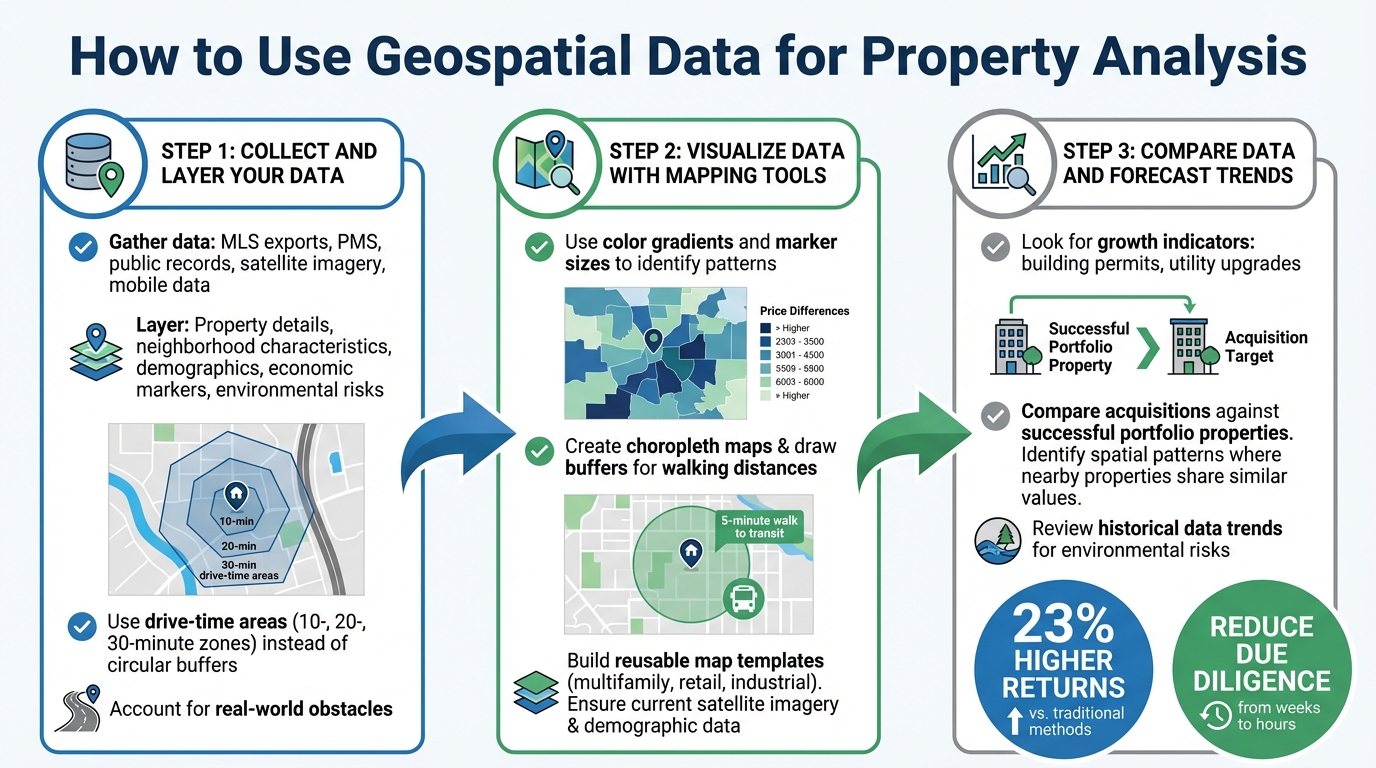
Step 1: Collect and Layer Your Data
To start, gather data from various sources. This includes MLS exports, property management systems, public records, satellite imagery, and mobile data. Together, these sources help paint a fuller picture, uncovering demographic and socioeconomic trends that guide informed real estate decisions [16][17][18]. Combine layers of property-specific details, neighborhood characteristics, demographic insights, economic markers, and even potential environmental risks [16][4][14][1].
When assessing a site's reach, skip the usual circular buffers. Instead, use drive-time areas - such as 10-, 20-, and 30-minute drive-time zones. These provide a more accurate view of the labor pool and customer base by factoring in real-world obstacles like rivers without bridges or highways slicing through neighborhoods [18].
Once you’ve layered your data, the next step is to bring it to life through visual mapping tools.
Step 2: Visualize Data with Mapping Tools
Use color gradients and marker sizes to make patterns in your data easy to spot [16]. For example, choropleth maps can show price differences across neighborhoods, while marker sizes can indicate levels of market activity. You can also draw buffers around properties to analyze walking distances - like a 5-minute walk to transit - and see how nearby amenities influence property values [19][5].
To save time, create reusable map templates tailored to specific property types, such as multifamily housing, retail spaces, or industrial sites. These templates make it easier to produce consistent, professional presentations for clients [16]. Also, ensure your satellite imagery and demographic data are current - outdated data can lead to poor investment forecasting and missed opportunities [1].
With a clear visual framework in place, you’re ready to dive deeper into comparisons and trend analysis.
Step 3: Compare Data and Forecast Trends
Look for early indicators of growth, such as building permits and utility upgrades, which often signal areas poised for investment before they become obvious hotspots [14][2]. Companies leveraging location intelligence report 23% higher returns compared to those sticking with traditional analysis methods [20].
For a deeper analysis, compare potential acquisitions against successful properties in your portfolio using side-by-side infographics [18]. Identify spatial patterns where nearby properties share similar values and use these patterns to refine your market strategies [14]. When evaluating environmental risks, consider historical data trends instead of relying solely on static FEMA maps [1].
This method dramatically reduces the time spent on due diligence, turning weeks of work into just hours [20]. These practices form the backbone of integrating geospatial analysis with CoreCast’s advanced real estate intelligence tools.
Using Geospatial Data with CoreCast

CoreCast takes well-established geospatial analysis techniques and transforms them into a dynamic, all-in-one platform for real estate professionals.
CoreCast's Mapping and Visualization Features
CoreCast consolidates all your geospatial data into a single, interactive map, allowing you to view both your properties and the competitive landscape in real time. This unified platform highlights spatial relationships - like property clusters or shifting demographics - so you can make faster, informed decisions.
The platform overlays property details, demographic data, and competitor insights onto one interface. With features like color gradients and markers, CoreCast offers a clear visualization of market activity in real time, replacing outdated quarterly or annual updates. This streamlined approach helps real estate professionals quickly identify trends and fine-tune their investment strategies.
CoreCast’s mapping tools also seamlessly integrate with its portfolio analysis capabilities, which are outlined below.
Portfolio Analysis and Reporting in CoreCast
CoreCast doesn’t stop at mapping - it offers advanced portfolio analysis tailored to any asset class or risk profile. You can monitor deals at every stage of the pipeline, compare new acquisitions to existing properties, and spot spatial patterns across your portfolio. The platform’s dashboard even allows you to create custom-branded reports, turning geospatial insights into polished, interactive presentations - leaving behind static PDFs for good.
| Feature | Traditional Methods | CoreCast Live Mapping |
|---|---|---|
| Data Source | Disconnected, static reports | Centralized, real-time data feeds |
| Update Frequency | Quarterly or annually | Instant and automatic |
| Visibility | Limited to individual property data | Comprehensive spatial and competitor insights |
| Workflow | Manually combining data in Excel/SharePoint | Integrated SaaS platform with automated processes |
| Reporting | Static PDFs and spreadsheets | Interactive, branded dashboards |
CoreCast supports underwriting for various asset classes, including multifamily, retail, and industrial, ensuring that geospatial insights directly tie into financial performance.
Upcoming Geospatial Features in CoreCast
CoreCast is gearing up to introduce AI-powered automation that will take geospatial analysis to the next level. These new features will automatically detect growth trends in micro-neighborhoods and predict key signals like permit activity and mobility patterns. By providing these automated insights, CoreCast aims to refine property analysis and forecasting, aligning with the industry's growing reliance on real-time data [1][14]. The platform will also continue integrating with third-party tools, maintaining its comprehensive approach to connecting geospatial insights across the entire deal lifecycle.
Conclusion
Geospatial data has turned real estate into a science driven by data, moving away from decisions based on gut feelings or outdated reports. With real-time insights into demographic changes, environmental risks, and mobility trends, it’s now possible to uncover market patterns that were once hidden. This evolution allows investors to shift from reactive strategies to predictive ones, gaining an edge by identifying opportunities before they become widely recognized.
The results speak for themselves: investors leveraging data-driven analytics see returns that are 15% to 20% higher compared to those relying on traditional methods [21]. This advantage underscores the value of embracing modern tools and approaches.
CoreCast simplifies the entire property analysis process with its all-in-one real estate intelligence platform. From underwriting properties and visualizing competitive landscapes to tracking pipelines and creating branded stakeholder reports, CoreCast reduces what used to take weeks into just hours [1].
As technology continues to redefine the real estate industry, tools like CoreCast are at the forefront of these changes. The industry is heading toward hyperlocal insights, climate risk assessments, and AI-powered trend analysis. With features like automated growth trend detection on the horizon, CoreCast ensures that you’re not just keeping up but staying ahead.
Geospatial data is the key to making smarter, quicker, and more profitable decisions in real estate.
FAQs
What geospatial data should I use to gauge neighborhood demand?
Understanding neighborhood demand starts with analyzing geospatial data. Key factors to consider include:
- Demographics: Look at population growth, income levels, and household composition to gauge the area's appeal.
- Mobility patterns: Study foot traffic and accessibility to see how people move through the neighborhood.
- Land use trends: Observe how the area is being developed or utilized over time.
Using mapping tools to visualize proximity to schools, transit hubs, and major job centers can also highlight which properties are more desirable. Platforms like CoreCast are especially useful for combining these datasets into a comprehensive spatial analysis, helping professionals pinpoint growth opportunities and predict demand trends with greater accuracy.
How can I combine demographics and mobility data to find micro-markets?
Combining demographics with mobility data offers a powerful way to identify micro-markets. By analyzing population traits - like age, income levels, and education - alongside movement patterns such as commuting routes or foot traffic, you can uncover valuable insights.
Tools like CoreCast make this process even more effective. They allow real estate professionals to layer these datasets, pinpointing areas where specific demographic profiles align with high mobility. This data-driven approach supports precise investment decisions and smarter marketing strategies.
It’s particularly useful for spotting neighborhoods with growth potential and rising demand for different types of properties. Whether you're looking at residential, commercial, or mixed-use developments, this method helps zero in on areas that are primed for success.
How do I factor climate risks into property underwriting with maps?
To factor climate risks into property underwriting, leverage geospatial data and climate risk analytics to assess potential hazards such as flooding, wildfires, hurricanes, and rising sea levels. By layering climate models and environmental data onto maps, you can evaluate risks tied to specific locations. For example, examine how close a property is to flood zones, wildfire-prone regions, or areas affected by sea level rise. These insights can then be integrated into the underwriting process, helping you make well-informed, risk-conscious decisions.