
How Migration Patterns Impact TOD Planning

Understanding how migration patterns influence transit-oriented development (TOD) is essential for creating thriving, transit-connected communities. TOD focuses on building compact, mixed-use neighborhoods near transit hubs, reducing car dependency while improving accessibility and housing options. But as migration shifts where people live, work, and commute, TOD strategies must adapt to meet evolving demands.
Key takeaways:
- Migration patterns - like in-migration, out-migration, regional flows, and intra-metro moves - shape housing demand, transit use, and workforce mobility.
- Challenges: Gentrification, rising rents, and displacement risks often follow TOD growth, impacting low-income residents and small businesses.
- Opportunities: Aligning TOD with migration data helps developers select sites, design suitable housing, and ensure equitable transit access.
- Tools & Data: Using sources like Census data, GTFS feeds, and platforms like CoreCast, developers can track migration trends and adjust TOD plans in real time.
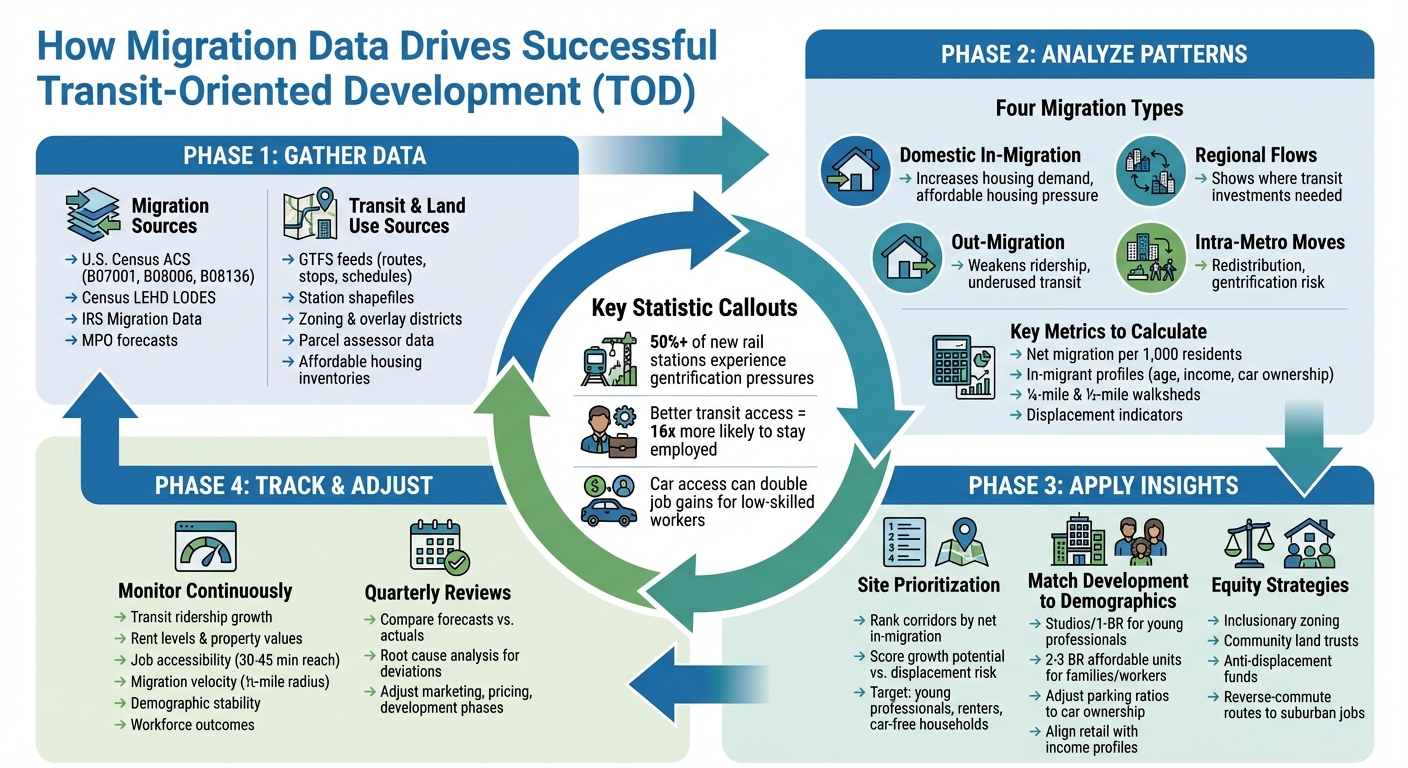
Four-Step Framework for Migration-Informed TOD Planning
Migration Trends That Affect TOD
Types of Migration Patterns
Migration plays a key role in shaping Transit-Oriented Development (TOD) strategies, with four main patterns influencing how transit systems and surrounding areas evolve: domestic in-migration, out-migration, regional flows, and intra-metro moves. Each of these patterns brings unique challenges and opportunities for transit planning and land use near stations.
- Domestic in-migration increases demand for housing near transit hubs and encourages mixed-use development. However, it also puts pressure on the availability of affordable housing.
- Out-migration reduces local populations, which can weaken transit ridership and make maintaining infrastructure more difficult. This often results in underused transit systems and challenges in sustaining vibrant, transit-friendly neighborhoods.
- Regional flows - such as shifts between suburban, rural, and urban areas - highlight where transit investments are most needed. Inflows into urban cores increase the demand for TOD, while outflows suggest a need for expanded transit corridors.
- Intra-metro moves redistribute populations within a metropolitan area. Moves toward transit-rich neighborhoods align with TOD goals but can lead to gentrification, while moves away from these areas reduce transit use and exacerbate spatial inequalities. Younger and higher-income households increasingly favor walkable, transit-accessible neighborhoods, amplifying these trends.
Understanding these migration flows is essential for aligning TOD strategies with shifting population dynamics.
How Migration Impacts TOD Goals
The effects of migration patterns extend beyond population shifts - they directly influence housing demand, transit use, workforce mobility, and equity. For instance, when more people move into transit-accessible neighborhoods, the demand for both rental and ownership housing rises. This often triggers higher-density, mixed-use development, which aligns with TOD principles. Additionally, TOD can help reduce reliance on non-work auto trips, emphasizing the importance of integrating transit with everyday living spaces [1].
Transit access plays a critical role in workforce mobility. For low-skilled workers, proximity to transit improves employment opportunities. However, car access remains a significant factor - it can double job gains and quadruple the likelihood of maintaining employment for these workers [3]. This highlights the complex interplay between transit systems, car ownership, and employment outcomes.
Demographic changes driven by migration, particularly the arrival of higher-income groups in transit-rich areas, can lead to gentrification. Historically, transit-accessible neighborhoods in the U.S. have been diverse and home to many low-income renters who rely on public transit. But new TOD projects often shift this balance, accelerating displacement and increasing housing turnover, especially in rental markets [2].
Without deliberate policy measures, TOD risks deepening income inequality and encouraging car ownership. For example, in Sun Belt and Rust Belt cities, connecting low-income urban residents to suburban job centers remains a challenge due to limited transit options and the decentralization of jobs [3]. Meanwhile, in metros like Boston and Washington, D.C., where transit systems are extensive, walkable neighborhoods near growing job hubs face significant gentrification pressures. This makes equitable TOD - ensuring that transit benefits all residents - an urgent priority [3].
Gathering Migration and Transit Data
Migration Data Sources
The first step in Transit-Oriented Development (TOD) analysis is gathering accurate migration data. A key resource is the U.S. Census Bureau's American Community Survey (ACS), which provides both 1-year and 5-year estimates. These datasets include insights on recent movers, commuting habits, and transportation modes. For instance, ACS B07001 focuses on geographical mobility, B08006 highlights transportation methods for work, and B08136 details aggregate travel times. You can download these tables in CSV format by accessing data.census.gov or using Census APIs.
Another valuable tool is the Census LEHD Origin–Destination Employment Statistics (LODES), which maps where people live and work at a granular level, such as blocks or tracts. This data is essential for understanding employment flows near transit corridors. Additionally, the IRS County-to-County and State-to-State Migration Data tracks migration patterns based on tax returns, providing insights into net migration between regions. To extend your analysis into the future, consult population and employment forecasts from state demographer offices and Metropolitan Planning Organizations (MPOs), which often align with regional transportation plans.
When working with these datasets, standardizing them is crucial. Convert files to CSV, align records by FIPS codes and timeframes, and rename columns (e.g., tract_fips or in_migrants). Be cautious with missing or suppressed data - use null values instead of zeros - and calculate metrics like net migration per 1,000 residents to enable comparisons across areas of varying sizes.
Transit and TOD Data Sources
To identify TOD opportunities, migration data should be paired with transit and land use layers. Begin with GTFS feeds (General Transit Feed Specification) from your local transit agency. These feeds provide details on routes, stops, schedules, and service frequencies, enabling calculations of headways, connectivity, and service spans near potential TOD sites. Supplement this with station shapefiles that include attributes like ridership levels, line types, and planned expansions.
Local government GIS portals are another rich source of data. Look for zoning and overlay district layers, which detail base zoning, TOD overlays, form-based codes, and parking requirements. Parcel-level assessor data - such as land use categories, assessed values, building ages, improvement-to-land ratios, and lot sizes - can help identify underutilized parcels near transit stations. Add land use and comprehensive plan layers to understand long-term policy goals for transit corridors. Lastly, incorporate employment and job location forecasts from MPO travel-demand models or state labor departments, as well as affordable housing inventories to assess existing housing options near transit.
To streamline your analysis, organize all datasets using a consistent spatial reference system, such as your local state plane coordinate system or WGS 84. Maintain a data catalog that notes the source, date, and key fields for each dataset.
Data Formats and Analysis Tools
Once you’ve collected migration and transit datasets, ensure they are formatted consistently and compatible with your analytical tools. Use CSV files for tabular data and shapefiles or GeoJSON for spatial layers. If you’re managing multiple layers, ArcGIS file geodatabases can be particularly effective.
The main geographic units for TOD analysis include census tracts and block groups (offering standardized boundaries with ACS data), traffic analysis zones (which provide detailed job and trip forecasts), and TOD walksheds - defined as ¼-mile and ½-mile network-based buffers along streets and paths. These walksheds, generated using GIS network analysis tools or routing engines, help calculate migration, population, and job metrics specific to areas influenced by transit.
"One platform consolidating all your real estate tools to provide real-time insights, streamlined operations, and smarter investment strategies."
CoreCast simplifies the integration of diverse datasets - migration tables, transit layers, zoning maps, and employment forecasts - into a single platform. It allows you to visualize spatial relationships and analyze how migration patterns intersect with transit accessibility and development potential. With real-time updates and third-party integration capabilities, CoreCast provides a centralized hub for TOD analysis, eliminating the need for extensive IT support. This unified approach ensures data-driven decisions for selecting TOD sites and prioritizing transit corridors.
Analyzing Migration Data for TOD Planning
Defining TOD Catchment Areas
The first step in Transit-Oriented Development (TOD) planning is to map out ¼-mile and ½-mile walksheds around each transit station. These represent a 5-minute and 10-minute walk, respectively, and define the core and secondary service areas. To ensure accuracy, use GIS network analysis tools like ArcGIS Network Analyst or QGIS plugins. These tools help create walksheds that reflect real-world walking routes, accounting for physical barriers like highways or rivers.
It's also critical to categorize each station area based on its development stage: existing, funded/under-construction, or conceptual/planned. This classification matters because established stations often face gentrification pressures as higher-income residents move in, while planned stations may see speculative migration patterns even before transit service begins. Additionally, classify stations by type, such as downtown employment hubs, residential neighborhoods, or park-and-ride commuter stations, since migration trends and community needs vary significantly across these categories.
Calculating Migration Metrics
To understand population changes within TOD areas, analyze ACS 5-year migration data aggregated to census tracts or block groups within the defined walksheds. Calculate net migration by subtracting out-movers from in-movers per 1,000 residents. This metric helps identify whether a TOD catchment area is gaining or losing population.
Dive deeper by segmenting in-migrant profiles based on factors like age groups, household types (e.g., family versus non-family), housing tenure (renter versus owner), and car ownership. Many thriving TOD areas attract young adult renters and households without cars, as these groups are more likely to rely on transit. Add economic data to the analysis, such as median household income, the percentage of residents earning below 60% of Area Median Income (AMI), educational attainment, and occupational mix. These details help measure how well the local workforce aligns with nearby job opportunities. Monitoring these metrics over time can reveal early signs of gentrification, such as rising incomes, a shrinking proportion of low-income residents, or changes in racial and ethnic composition. Together, these indicators not only highlight migration trends but also provide insights into transit demand and equity challenges.
Linking Migration Data to Transit Demand and Equity
By combining migration profiles with transit supply data from GTFS feeds, you can estimate potential ridership growth. Pay particular attention to workers moving into TOD areas whose jobs are accessible via the same transit line or connecting routes. This type of migration can reduce car dependency and boost all-day transit use.
However, equity concerns often arise when higher-income newcomers cluster around stations, leading to increased rents and the displacement of transit-dependent residents. For instance, more than half of new rail transit station areas in U.S. metro regions have experienced rising housing costs and higher-income in-migration compared to nearby areas, signaling gentrification pressures [2]. To counter these risks, track indicators like rent burden, eviction rates, and small business turnover within the walksheds. These metrics can guide equitable TOD strategies, such as implementing inclusionary zoning policies, establishing land banks, or creating anti-displacement funds, particularly in station areas at high risk of displacement.
Applying Migration Insights to TOD Investment and Planning
Prioritizing TOD Sites and Corridors
Once you've analyzed migration data, it's time to rank station areas based on their potential and risks. Focus on corridors with high net in-migration, especially those attracting young professionals, renters, and households without cars - these are prime candidates for transit-oriented development (TOD).
At the same time, identify areas showing signs of displacement risk. Look for indicators like rising median incomes, shrinking low-income populations, and increasing rents. These areas may require protective measures such as preserving affordable housing or implementing inclusionary zoning policies.
Develop a scoring system that balances growth potential with displacement risk. For example, areas with strong growth and minimal displacement risk could be ideal for immediate market-rate development. On the other hand, high-growth areas with significant displacement concerns might benefit from mixed-income strategies that include strong affordability measures. This balanced approach ensures TOD projects not only meet market demand but also support fair and inclusive community outcomes. These rankings help align development plans with the unique needs of each community.
Matching TOD Product Mix to Migration Profiles
Once you've prioritized TOD sites, adapt your development plans to fit the demographic trends revealed by migration data. If the data shows an influx of young professionals or single-person households, focus on smaller units like studios and one-bedroom apartments. Complement these with coworking spaces, bike storage, and practical retail options.
If families or lower-income workers are moving into the area, the development mix should include affordable two- and three-bedroom units, along with essential services like grocery stores and childcare facilities.
Parking ratios should also reflect car ownership trends. In car-free areas, lower parking ratios make sense, while car-dependent neighborhoods may require more parking spaces. Similarly, retail options should align with the preferences of incoming residents. Higher-income newcomers might support boutique fitness studios and specialty coffee shops, while working-class communities may prefer more affordable, practical retail options.
Tools like CoreCast's integrated mapping and portfolio analysis can help fine-tune these strategies. By tracking demographic trends alongside market data, you can predict demand for specific housing types and adjust your plans accordingly. This proactive approach minimizes risk and ensures TOD projects are tailored to the community's evolving needs.
Addressing Equity and Workforce Accessibility
Combining migration data with site prioritization highlights the need for equitable transit connections. While TOD growth can create economic opportunities, it also risks displacing transit-dependent residents. To address this, anti-displacement strategies should be part of the early planning process. These might include acquiring and rehabilitating affordable housing, setting inclusionary zoning requirements, or supporting community land trusts to maintain long-term affordability.
Improving transit access for workers is another critical step. Direct transit links to major employment hubs can help low- and moderate-income workers maintain jobs. Research shows that people who move to neighborhoods with better transit options are 16 times more likely to stay employed compared to those who don’t [3]. Adding reverse-commute routes from residential TOD areas to suburban job centers and coordinating transit schedules with employer shift times can help bridge the gap between where workers live and where jobs are located.
Keep a close eye on displacement indicators like eviction rates, small business turnover, and broader demographic changes within TOD areas. If early signs of displacement appear, consider increasing affordable housing, limiting parking to discourage car dependency, or introducing programs to support local businesses. The aim is to ensure that transit investments create thriving, inclusive communities that benefit both new residents and long-time locals alike.
sbb-itb-99d029f
Tracking and Adjusting TOD Strategies Over Time
Metrics for Tracking TOD Performance
The work of Transit-Oriented Development (TOD) doesn’t stop once construction wraps up. Keeping an eye on key metrics is essential to ensure the project delivers on its goals. Start by tracking transit ridership growth at each station - this reveals whether new residents are actually using public transit as expected. Keep tabs on rent levels, property values, and absorption rates to gauge market demand and pricing trends. Another critical measure is job accessibility - calculate how many employment hubs residents can reach within 30 to 45 minutes using transit [3].
Also, monitor the migration velocity - the speed at which new residents are moving into the area, typically measured within a half-mile radius of stations [4]. To spot early signs of challenges like gentrification or displacement, track demographic stability metrics such as income levels, household composition, and car ownership rates. Lastly, don’t overlook workforce outcomes; better transit access has been shown to improve employment stability over time [3].
Creating Feedback Loops
Regular review cycles - quarterly or semi-annual - are key to staying on track. Compare actual outcomes with your migration and transit usage forecasts. For example, if transit ridership is 20% lower than projected, dig into potential causes: Have migration patterns shifted? Has transit service changed? Or is parking availability affecting transit adoption [3]? Similarly, if absorption rates aren’t matching expectations, determine whether the target demographic is moving in or if competing developments are drawing them elsewhere.
When actual outcomes deviate from forecasts, conduct a root cause analysis. Ask questions like: Have economic conditions shifted migration flows? Has employment moved away from transit corridors? Are rising rents driving gentrification faster than anticipated [2]? These insights can guide adjustments to marketing strategies, future development phases, and pricing models. For example, comparing rent growth in your TOD area to citywide averages can help identify potential displacement risks early. And tracking commercial turnover can highlight whether local businesses are being replaced by higher-end retailers [1]. These findings ensure your strategy stays flexible and informed.
Using CoreCast for Continuous Improvement

Managing all these data streams can get complicated, but integrated analytics platforms like CoreCast make it easier. CoreCast consolidates critical data - such as transit ridership, migration trends, property performance, and demographic changes - into one central system. This allows you to monitor TOD performance across multiple station areas simultaneously. By pairing migration data with real-time property metrics, you can quickly pinpoint which corridors are exceeding expectations and which may need adjustments.
The platform's mapping and portfolio analysis tools let you compare migration velocity across your TOD projects, helping you decide where to accelerate development or reallocate resources. You can also create custom reports for stakeholders, showing how migration patterns are translating into ridership, property absorption, and financial returns. On top of that, CoreCast offers automated alerts that flag when key metrics deviate from projections. This turns migration analysis into an ongoing process, ensuring your TOD strategy evolves and adapts seamlessly over time.
What is Transit-Oriented Development (TOD 101)
Conclusion
The success of transit-oriented development (TOD) hinges on understanding migration patterns and transit usage. Knowing where people are moving from, who’s relocating, and why they’re choosing specific areas empowers real estate professionals to make informed decisions. This insight helps in selecting the right sites, designing housing that aligns with actual demand, and ensuring transit access supports workforce mobility. Without this crucial data, TOD projects risk missing their intended audience, resulting in lower occupancy rates, mismatched housing options, and missed chances to address equity challenges.
To keep pace with changing conditions, TOD strategies need to adapt continuously. By regularly tracking migration trends, transit ridership, demographic changes, and signs of displacement, professionals can ensure their plans remain relevant. Comparing actual results with initial projections can uncover shifts, like slower-than-expected population growth, unexpected income profiles, or early signs of gentrification. These adjustments not only improve project outcomes but also help maintain equity and access for the workforce.
For more efficient decision-making, manual data management is a time sink. Integrated tools simplify the process by combining diverse data sources into a single system. For example, CoreCast brings together migration, transit, and property data, making it easier to track TOD performance. This platform allows professionals to oversee multiple projects at once and produce branded reports that clearly show stakeholders how migration trends impact financial results and community benefits.
FAQs
How does analyzing migration data help in planning successful TOD projects?
Understanding how people move from one place to another plays a key role in planning transit-oriented development (TOD). By studying migration patterns, real estate professionals can pinpoint areas with rising demand, predict where growth is heading, and make more informed investment choices.
CoreCast makes this process easier by offering real-time data on migration trends and other essential market insights. This all-in-one platform allows users to assess opportunities, monitor project pipelines, and dive deep into portfolio analysis - all within a single, streamlined tool.
What challenges does transit-oriented development (TOD) face due to migration trends?
Migration patterns bring a unique set of challenges to transit-oriented development (TOD) planning. Changes in population demographics - like a surge in urban residents or the spread of suburban neighborhoods - can lead to mismatches between transit infrastructure and actual usage. For instance, a rapid population boom in a specific region might overwhelm existing transit systems, while areas seeing a population drop could find it hard to justify new TOD investments.
On top of that, shifts in income levels, housing preferences, and job opportunities that come with migration add another layer of complexity. To keep TOD strategies relevant and effective, real estate professionals must pay close attention to these trends. This approach helps ensure transit systems and developments remain aligned with the needs of dynamic, growing communities.
How can transit-oriented development (TOD) help reduce the risks of gentrification and displacement?
Transit-oriented development (TOD) offers a way to reduce the risks of gentrification and displacement when paired with careful planning and inclusive strategies. Some of the most effective methods include emphasizing affordable housing, enacting policies that safeguard long-term residents, and encouraging mixed-income communities around transit hubs.
Collaboration with local governments and community stakeholders is essential for TOD projects to achieve a balance between economic growth and social fairness. This approach ensures that the advantages of better transit access reach a wide range of residents, helping to build neighborhoods that are both inclusive and sustainable.