
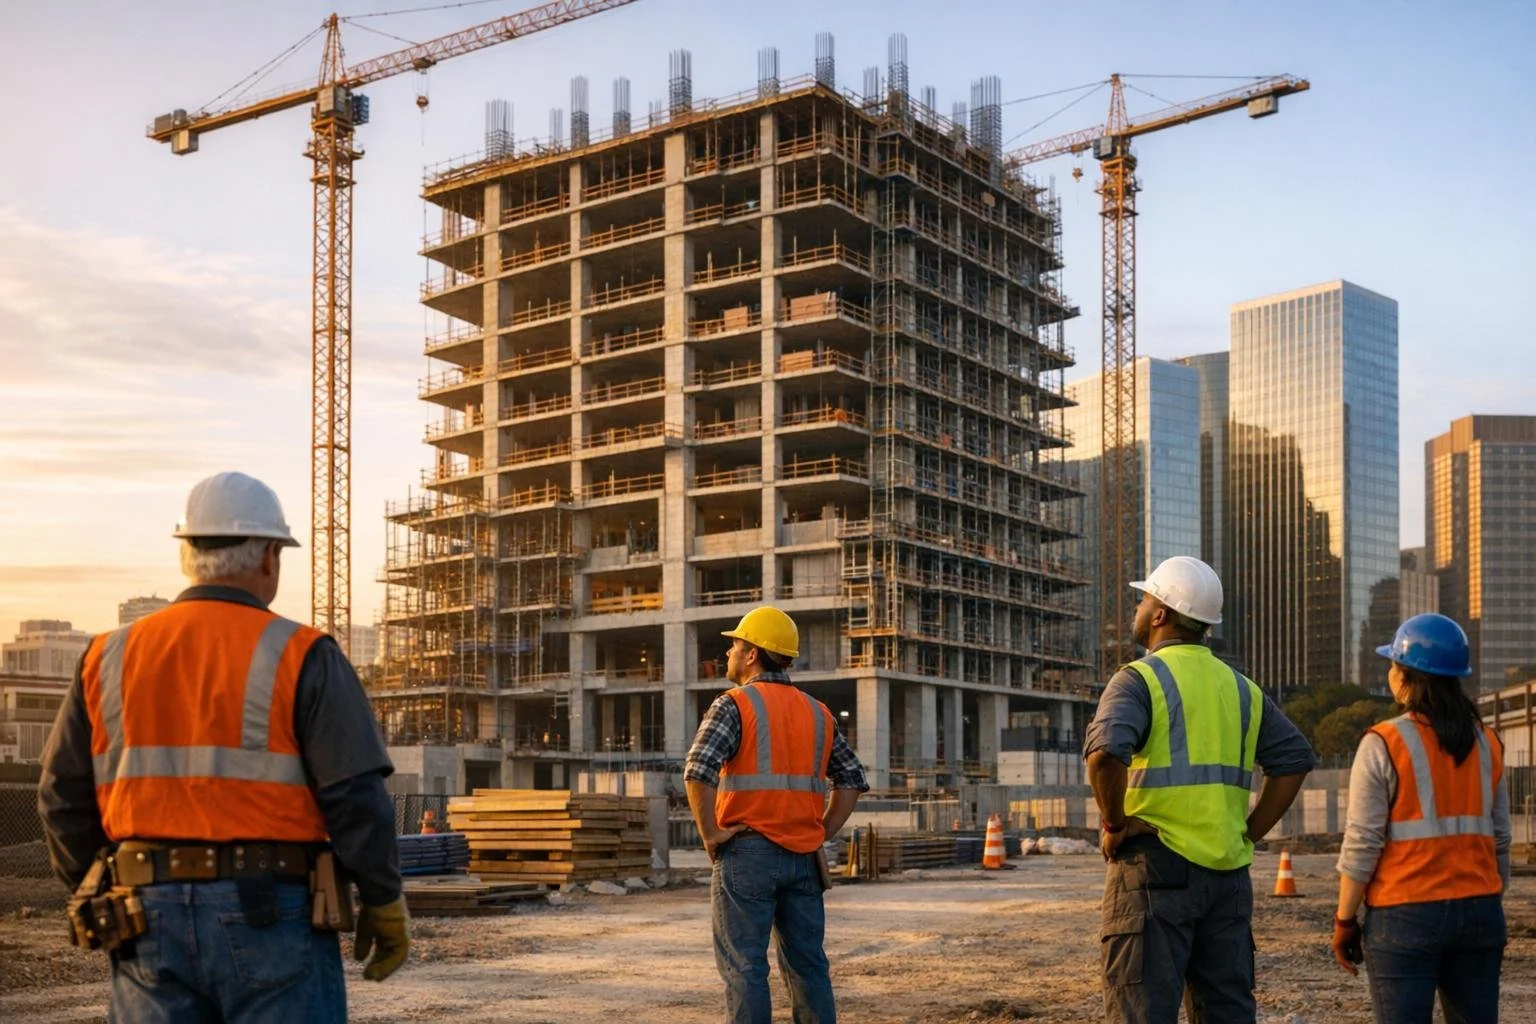
Immigration and Labor: Key Data for Real Estate Decisions
Immigration and labor trends are reshaping U.S. real estate markets. Here's the key takeaway: stricter immigration policies and reduced net migration are tightening the labor pool, slowing construction, and impacting housing demand.
Key insights:
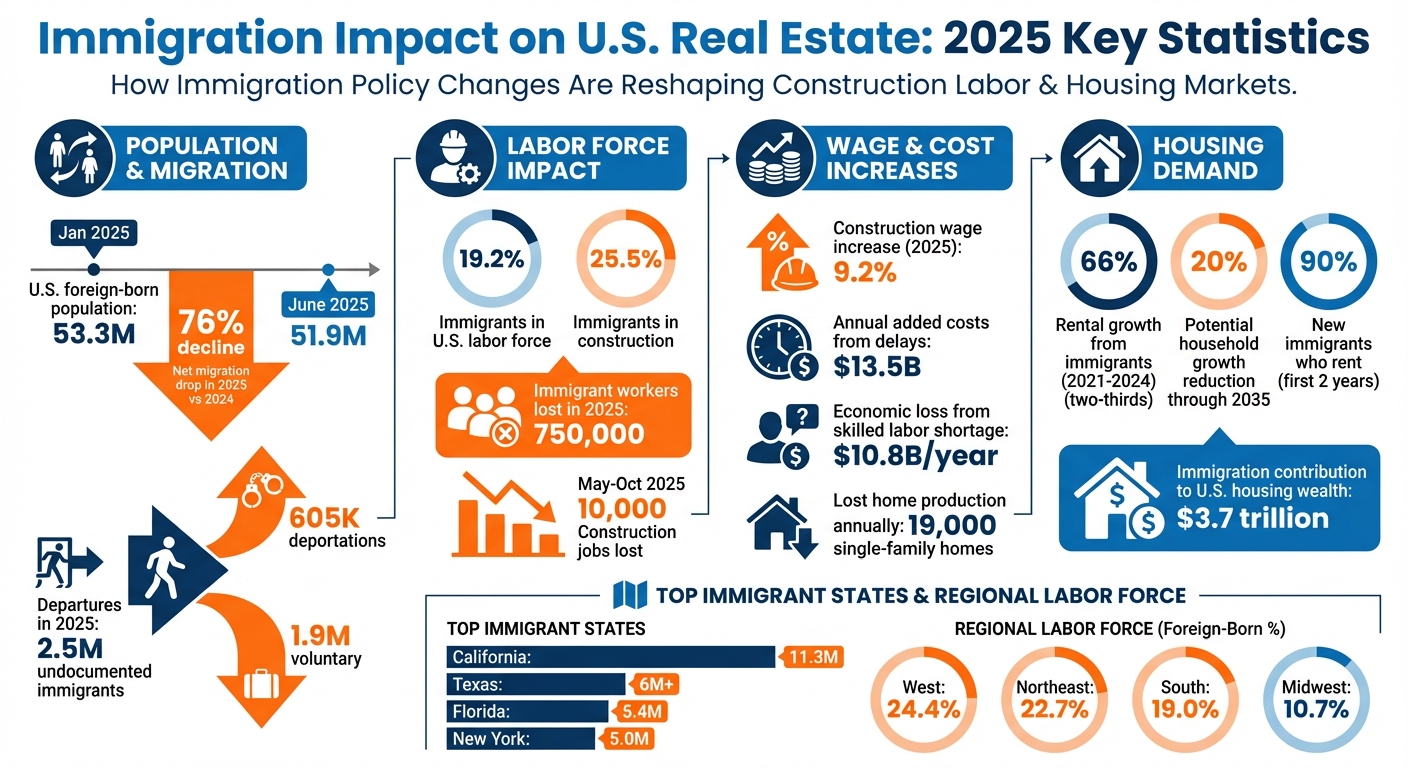
- The U.S. foreign-born population dropped from 53.3M in Jan 2025 to 51.9M by June 2025, with net migration plunging 76% in 2025 compared to 2024.
- Immigrants make up 19.2% of the labor force, with 25.5% in construction. A loss of 750,000 immigrant workers in 2025 has raised construction costs and delayed projects.
- Rental demand is heavily influenced by immigrants, who accounted for two-thirds of rental growth from 2021–2024. Lower immigration could reduce household growth by 20% through 2035.
- Wage increases: Construction wages rose 9.2% in 2025, but job losses and delays added $13.5B in annual costs.
- Regional effects: California, Texas, Florida, and New York remain immigrant hubs, while Sun Belt states face labor challenges due to migration shifts.
Real estate professionals should monitor labor market data, migration trends, and vacancy rates to make informed decisions. Tools like CoreCast simplify this by integrating labor and housing data into real-time analytics.
Immigration Impact on U.S. Real Estate: 2025 Key Statistics
Checklist: Immigration Policy and Workforce Data
Track Federal Immigration Policy Changes
During the second Trump administration, 181 executive actions were introduced within the first 100 days of 2025 to limit new arrivals and increase deportations [9]. By the end of 2025, around 579,000 individuals had been deported [8]. Additionally, deportation protections and work permits were rescinded for approximately 500,000 immigrants from Cuba, Haiti, Nicaragua, and Venezuela who had previously entered the U.S. legally [9]. The CBP One app’s scheduling feature was also removed, canceling all appointments as of January 2025 [3]. Temporary Protected Status (TPS) for Venezuelan nationals was repealed in April 2025 [3].
These policy changes had a noticeable impact on the workforce. The immigrant share of the U.S. labor force dropped from 20% to 19%, leading to a loss of over 750,000 workers. This shift has made labor costs and availability a major concern for 75% of real estate leaders heading into 2026 [9] [7]. In response, the National Association of Home Builders (NAHB) has backed the Dignity Act, a bipartisan proposal that aims to provide pathways for permanent work authorization to undocumented workers who contribute restitution fees to a skilled labor training fund [6].
Analyze State Immigration Trends
The effects of federal policies are reflected in state-level data, highlighting regional differences in immigrant populations. California remains at the top with 11.3 million immigrants, followed by Texas with over 6 million, Florida with 5.4 million, and New York with 5.0 million [9]. The foreign-born share of the labor force varies significantly by region: 24.4% in the West, 22.7% in the Northeast, 19.0% in the South, and 10.7% in the Midwest [4]. Between January and December 2025, more than 2.5 million undocumented immigrants left the U.S., including 605,000 deportations and 1.9 million voluntary departures [10].
In one example, Goodwin Living, a nonprofit senior housing provider in Alexandria, Virginia, had to lay off four Haitian employees in October 2025 after their humanitarian parole work permits were terminated. The organization, which relies on a workforce that is 60% foreign-born, has struggled to find replacements for critical roles in nursing and maintenance, according to CEO Rob Liebreich [5]. Real estate professionals are encouraged to track multifamily absorption and vacancy rates in cities with high immigrant populations, such as New York (13%), Los Angeles (9%), and Miami (6%), as these shifts could affect housing demand [9].
Review Net Migration Data
Net international migration reached 2.8 million between July 2023 and June 2024, accounting for roughly 2% of the U.S. labor force [3]. However, the Congressional Budget Office lowered its 2025 economic growth forecast from 1.9% to 1.4%, citing the impact of stricter immigration and trade policies [5]. The construction sector alone saw a loss of 10,000 jobs between May and October 2025 due to a shrinking labor pool [5].
The number of new jobs needed each month to maintain steady unemployment levels doubled from 80,000 to 160,000 by mid-2025, partly due to immigration trends [3]. Despite expectations that native-born workers would fill roles vacated by immigrants, the unemployment rate for native-born workers rose to 4.3% in 2025 [8]. Dean Baker, Senior Economist at the Center for Economic and Policy Research, explained:
"When the immigrants aren't there, [native-born workers] aren't able to do it" [8].
Using migration data from 2021 to 2025 as a baseline, it’s clear that labor shortages will likely continue to affect construction timelines and housing demand. These trends offer critical insights for assessing the construction labor market in key regions.
Checklist: Construction Labor Market Data
Evaluate Immigrant Share in Construction
Immigrant workers made up 25.5% of the total construction workforce by late 2025 [11]. This presence is more pronounced in skilled trades, where one in three craftsmen (about 33.3%) is foreign-born [11]. Regional differences play a big role, with western and northeastern areas experiencing tighter labor constraints compared to the Midwest. In 2024, 22.7% of foreign-born men worked in natural resources, construction, and maintenance jobs, compared to 14.1% of native-born men [4]. However, between January and June 2025, the foreign-born workforce dropped by more than 750,000 workers [1]. These shifts in the labor force are critical for understanding how wages and employment levels are being impacted.
Track Wage Growth and Job Openings
Labor shortages have pushed wages higher, even as construction companies shed 10,000 jobs between May and October 2025 [5][11]. For example, wages for non-supervisory home building workers jumped 9.2% in July 2025, far outpacing general inflation [11]. The shortage of skilled labor in home building has led to an annual economic loss of $10.806 billion, with delays preventing the production of around 19,000 single-family homes each year [11]. On top of that, extended construction timelines add another $2.663 billion in yearly expenses due to higher carrying costs [11].
In 2024, the unemployment rate for foreign-born workers rose to 4.2%, up from 3.6% in 2023. Meanwhile, median weekly earnings for foreign-born full-time workers were $1,001, which is 84.1% of the $1,190 earned by native-born workers [4]. To keep up with these trends, real estate professionals should regularly check the Bureau of Labor Statistics' "Labor Force Characteristics of Foreign-born Workers" reports and the "Employment Situation News Release" for updates on labor data based on nativity [4][12]. Wage increases paired with job losses emphasize the need to monitor builder cycle time reports to understand how these dynamics affect project schedules.
Monitor Builder Cycle Time Reports
The Home Builders Institute (HBI) Construction Labor Market Reports offer insights into how labor shortages impact project timelines for both residential and commercial construction [11]. These reports show that delays caused by a lack of skilled workers result in over $2.6 billion in added costs annually [11]. As HBI explains:
"The skilled labor shortage is responsible for the lost production of thousands of newly built homes... quantifies the size and impact of the skilled labor shortage at $10.8 billion per year" [11].
Policy changes have also played a role in workforce disruptions. For instance, H-1B visa fees for skilled foreign workers skyrocketed from $215 to $100,000, making it harder to access specialized labor [5]. Dany Bahar, Senior Fellow at the Center for Global Development, remarked:
"A $100,000 visa fee is not just a bureaucratic cost - it's a signal. It tells global talent: 'You are not welcome here'" [5].
Real estate professionals should review these builder cycle time reports on a quarterly basis to better understand how labor shortages are affecting project timelines and development costs in their markets.
Checklist: Housing Demand and Economic Data
Measure Immigrant Housing Demand
Between 2021 and 2024, immigration was responsible for two-thirds of the growth in U.S. rental demand [13]. A 6-million increase in the foreign-born population has significantly driven rental demand, with roughly 90% of new immigrants renting during their first two years in the country [18]. The growth rate of households led by non-citizens nearly doubled, rising from 7% (2015–2019) to 13% (2019–2023) [13].
For real estate professionals, focusing on urban outskirts and entry-level neighborhoods is key, as these are often the first areas where immigrant households settle [14][18]. Major immigrant population hubs include New York City (home to 13% of all U.S. immigrants), Los Angeles (9%), and Miami (6%) [1].
Track Vacancy Rates and Multifamily Absorption
Vacancy rates offer a critical perspective on market health alongside housing demand trends. Population shifts can dramatically impact these rates. For instance, when Arizona passed legislation targeting undocumented workers in 2007, approximately 100,000 residents left the state, causing rental vacancy rates to spike from 9.8% to 16.8% [18].
From 2020 to 2024, net international migration accounted for 83% of the total U.S. population growth [2]. The Southeast experienced the largest share of this migration, with 1.8 million net migrants, followed by the West (1.7 million) and the Northeast (1.5 million) [2]. Real estate professionals should keep an eye on the Census Bureau's Housing Vacancies and Homeownership (HVS) reports to monitor rental vacancy trends in these high-growth areas [20].
Quantify Economic Impacts
Immigration's economic influence plays a pivotal role in shaping housing markets. Immigrants have contributed an estimated $3.7 trillion to U.S. housing wealth [14]. A 1% rise in population due to immigration correlates with a 3.5% increase in median home prices and a 2.0% uptick in rental costs [16]. In areas with restrictive building permit policies and high-skilled immigrant inflows, a 1% population boost may drive shelter prices up by 6%–8% [16].
However, projections from the Harvard Joint Center for Housing Studies indicate that lower immigration levels through 2035 could reduce total household growth by about 20%, potentially dampening demand in multifamily and rental markets [17]. Currently, the U.S. faces a housing shortage of over 4.7 million homes, a deficit intensified by continued immigrant-driven demand [19]. Between 2019 and 2023, foreign-born households accounted for 25% of U.S. household growth [15]. Looking ahead to 2040, immigration is expected to be the sole driver of U.S. population growth, as natural population increases are projected to decline [15]. These economic trends are crucial for real estate professionals evaluating market opportunities and challenges.
sbb-itb-99d029f
Checklist: Real Estate Decision-Making Data
Forecast Market-Specific Trends
Recent insights into labor shortages in construction highlight the importance of the break-even employment threshold in predicting market-specific trends. This threshold serves as a key indicator of market health. With higher migration levels in 2023–2024, the number of new jobs required monthly to maintain steady unemployment has doubled - from 80,000 to roughly 160,000[3]. For real estate professionals, this metric can signal whether a local economy is heating up or cooling down. If job creation falls short of this threshold, demand across various sectors may begin to weaken.
Another critical factor is the availability of construction labor. Foreign-born workers play a significant role in this sector, being nearly twice as likely to work in construction and maintenance roles (13.9%) compared to native-born workers (7.7%)[21]. Monitoring builder cycle times and wage trends, particularly in regions like the West and South, can provide valuable insights into labor market dynamics.
These trends lay the groundwork for seamlessly incorporating data, as discussed in the next section on CoreCast tools.
Use CoreCast for Data Integration

CoreCast offers geospatial mapping tools that help visualize portfolio exposure in regions heavily influenced by migration. By mapping deal pipelines and assets, users can identify development clusters in high-immigration states such as California, Texas, Florida, and New York, which collectively account for a large share of U.S. immigrants[1].
The platform integrates with property management systems like AppFolio, Yardi, and RealPage, enabling the automatic ingestion of historical data such as T-12s and rent rolls[22]. This real-time data can be compared with pro forma projections to identify growth trends or anomalies linked to shifts in labor markets. Additionally, CoreCast's AI-powered document parsing streamlines the extraction of seller financial data, significantly reducing the time needed to update market models[22]. Its real-time Output View feature updates metrics like IRR, equity multiples, and valuations as assumptions change, making it easier to conduct sensitivity analyses for various immigration policy scenarios[22].
Analyze Regional Growth Patterns
Beyond state-level trends, regional analysis highlights how labor force composition affects market risks. The concentration of foreign-born workers varies significantly by region, influencing development feasibility. The West leads with 24.4% of its labor force being foreign-born, followed by the Northeast at 22.7%, the South at 19.0%, and the Midwest at just 10.7%[21]. This uneven distribution suggests that Sun Belt markets could face more immediate labor challenges from the anticipated immigration decline in 2025, while Rust Belt regions may experience less impact due to their historically lower reliance on immigrant labor.
Investment strategies should focus on areas with high immigrant concentrations. A majority of U.S. immigrants live in just 12 metropolitan areas, creating intensified labor market pressures in these urban hubs[1]. Understanding these dynamics can help real estate professionals navigate regional risks and opportunities more effectively.
#immigration landscape impact on #realestate #podcast
Conclusion
Immigration trends and labor dynamics play a crucial role in shaping real estate demand and supply. Recent drops in net migration have tightened the labor market, slowed construction, and directly influenced rental markets. These changes have made labor harder to find and driven up costs, creating challenges across the industry.
Stricter immigration policies further exacerbate these issues by reducing the available workforce, leading to fewer renters and more construction delays. The result? Higher costs and longer project timelines - factors that can significantly disrupt real estate development.
To navigate these complexities, CoreCast offers a streamlined solution by combining fragmented data sources into one unified intelligence platform. Instead of relying on scattered Excel sheets to track pipelines, monitor construction, and analyze markets, real estate professionals can integrate property management systems like Yardi and AppFolio. The platform also provides geospatial mapping to visualize regional exposure[22]. Its AI-powered document parsing slashes manual data entry time from hours to seconds, while real-time financial modeling allows users to instantly adjust metrics like IRR and equity multiples as assumptions around immigration and labor shift[22].
With a centralized platform, professionals can quickly adapt forecasts and communicate updates to stakeholders when labor market changes arise. Access to real-time data ensures better, faster decision-making.
These labor and migration trends highlight the growing importance of advanced data integration tools. Making informed decisions requires a clear understanding of migration patterns and workforce capabilities. Considering that immigrant-origin workers are expected to drive all growth in the U.S. working-age population through 2035[23], today’s real estate strategies must align with the labor realities of tomorrow.
FAQs
How do stricter immigration policies affect the real estate market?
Stricter immigration policies can shake up the real estate market in ways that ripple through both demand and supply. Fewer new residents mean a smaller pool of potential renters and buyers, which can slow population growth and, in turn, reduce the need for housing and commercial spaces. For developers, this could mean struggling to find tenants for newly built units, leading to less activity in the market overall.
On the flip side, the supply side isn’t immune to the effects either. A shrinking labor force - especially with fewer construction workers - can push up building costs, delay projects, and limit the availability of new properties. These issues can result in slower rental growth, higher vacancy rates, and thinner profit margins for investors, particularly in areas that have historically depended on immigration-driven growth.
To navigate these shifts, real estate professionals can turn to tools like CoreCast. This platform combines immigration and labor market data with detailed property insights, giving users a clear picture of how demographic changes might affect demand, construction expenses, and investment returns - all tailored to specific local markets.
How do immigrants contribute to the U.S. construction workforce?
Immigrants are a cornerstone of the U.S. construction industry, representing about one in four workers. Back in 2018, foreign-born individuals made up roughly 25% of all construction employees, with their presence even more pronounced in specific trades like carpentry, painting, and masonry, where they accounted for around 30%. In states with booming construction sectors, immigrants can comprise up to 40% of the workforce, playing a key role in tackling labor shortages.
When the housing market faced a downturn, more than 1.7 million native-born workers exited the industry. Yet, immigrant employment bounced back to pre-downturn levels, ensuring critical construction projects stayed on track. For real estate professionals, recognizing the importance of this workforce is essential for accurately planning project costs, timelines, and overall feasibility. Tools like CoreCast incorporate labor market insights into investment strategies, empowering developers to make smarter, data-driven decisions.
How can real estate professionals leverage immigration and labor data for better decisions?
Real estate professionals have a valuable tool in immigration and labor-market data when it comes to spotting opportunities and making smarter investments. Key areas to focus on include net international migration, labor shortages by state or industry, and broader labor-market trends. For instance, the Congressional Budget Office projects an annual net migration of 3.3 million people for 2023–2024. This influx is expected to alleviate labor shortages and influence housing demand. Regions like the Southeast and Northeast, along with industries such as healthcare, construction, and technology, are particularly dependent on foreign-born workers.
By pairing migration data with local housing supply information, developers can predict demand for rental units, multifamily housing, or senior-living communities. This strategy also helps address labor availability for construction projects, which is becoming increasingly important as the domestic workforce grows older. Tools like CoreCast simplify this process by integrating insights on labor markets, demographic trends, and real estate data, giving professionals the ability to analyze patterns, predict outcomes, and make informed decisions with greater confidence.