
How Machine Learning Predicts Real Estate Market Timing

Machine learning is reshaping how real estate professionals identify the best times to buy or sell properties. By analyzing vast datasets - like historical prices, economic indicators, and local trends - these models uncover patterns that traditional methods miss. This approach helps reduce risks and improve returns, especially in unpredictable markets.
Key Takeaways:
- Poor timing can reduce real estate returns by 5–10%.
- Machine learning models, such as Zillow's Zestimate, are 20–30% more accurate than older methods.
- Algorithms like Random Forests and Neural Networks reveal hidden trends, such as emerging hotspots or undervalued properties.
- Data sources include historical sales, economic indicators (e.g., interest rates), and local factors like school ratings or infrastructure changes.
- Predictive analytics has enabled investors to achieve up to 18% annualized returns in competitive markets like Phoenix.
Platforms like CoreCast simplify this process by offering real-time data analysis, interactive mapping, and automated forecasting, making it easier to act on market opportunities.
AI in Real Estate Systems: Machine Learning for Valuation, Risk, and Smart Assets | Uplatz

sbb-itb-99d029f
Data Sources for Market Timing Predictions
Accurate market timing predictions rely heavily on high-quality data. For real estate, three main categories stand out: historical sales records, economic indicators, and local market data. Each provides unique insights into market trends, and when combined, they offer a well-rounded view of when to make key decisions. Let’s break down how each dataset contributes to better predictions.
Historical Sales and Price Data
Historical sales and pricing data are essential for understanding market trends and making informed decisions. One critical metric is the price per square foot, which allows for consistent comparisons across properties of different sizes and locations [2]. However, raw data alone isn’t enough. It needs to be segmented into long-term trends, seasonal patterns, and cyclical behaviors to improve the accuracy of forecasts [1].
For example, a study analyzing NYC property sales from 2003 to 2015 achieved a Mean Absolute Percentage Error (MAPE) of about 8% for one-month-ahead predictions and 10% for one-year-ahead forecasts [1]. Machine learning models like XGBoost have proven to be highly effective, reducing errors by 68% compared to simple regression models and by 26% compared to multivariate regression models [1]. This level of precision is largely due to rigorous data cleaning processes, such as:
- Removing outliers (e.g., properties outside the typical 300 sq ft per bedroom threshold [2]).
- Handling missing data using techniques like K-Nearest Neighbors [1].
Economic Indicators
Economic factors like interest rates, employment levels, and GDP growth have a direct impact on real estate markets. For instance, Federal Reserve rate changes immediately influence borrowing costs and overall market activity. Employment data, on the other hand, affects absorption rates and rental demand, while building permits can hint at future shifts in housing supply.
Models like SARIMAX incorporate these external economic variables, making predictions more reliable during periods of market volatility [1].
"Incorporating indicators such as job growth, inflation, or shifts in borrowing costs makes these models more grounded in economic reality" [1].
Additionally, some models now integrate hyperlocal data, such as new business licenses or transit expansions, to identify emerging property appreciation zones before they gain widespread attention [4].
Local Market Data
Local market information adds another layer of depth to predictions. Factors like school ratings, crime statistics, and proximity to amenities can create significant value differences between seemingly similar properties. Infrastructure developments often signal future value growth, while zoning changes or regulatory updates can have immediate effects on a property’s potential.
Looking ahead, national housing inventory levels in 2026 are expected to remain 12% below pre-2020 averages, even though homes for sale are projected to rise by 8.9% [6]. Regional trends will vary: the Northeast and Midwest are likely to maintain price strength due to tight inventory, while areas in the South and West - popular during the pandemic - may face cooling due to higher insurance costs and increased supply [6]. Monitoring local building permits can provide early warnings, as a surge in permits often precedes price stabilization or declines when new inventory enters the market.
Machine Learning Algorithms for Market Timing
Once you've secured quality data, the next step is selecting the right algorithms to analyze it. Different models serve different purposes - some excel at identifying broad trends, while others specialize in uncovering subtle, hidden patterns. Choosing wisely can lead to more precise market timing predictions and better insights into real estate dynamics.
Linear Regression for Trend Analysis
Linear regression is a go-to method for analyzing real estate trends. It helps identify long-term movements (secular trends), seasonal fluctuations (like the typical uptick in spring and summer sales), and cyclical changes in property values. By examining historical prices alongside variables like square footage, location, and property age, this method provides a solid baseline for forecasting.
For more advanced datasets, ARIMA models are effective when strong trends are present, while Seasonal ARIMA (SARIMA) is ideal for markets with clear annual cycles. SARIMAX takes it a step further by factoring in external economic indicators such as interest rates or employment levels, refining long-term predictions. Before using these models, it’s essential to stabilize your data - techniques like differencing can help ensure the mean and variance remain consistent over time. This baseline analysis lays the groundwork for making informed timing decisions using real-time analytics in ever-changing markets.
Random Forest for Feature Identification
Random Forest algorithms shine when it comes to pinpointing the factors that most influence market timing. These tree-based models break data into smaller subsets using layered decision rules, making them particularly adept at capturing complex, non-linear relationships that simpler models might overlook.
One of their standout features is the ability to rank the importance of variables. For instance, a Random Forest model might reveal that proximity to transit or school ratings has a greater impact on property values than building age. It could also show that newer properties in up-and-coming neighborhoods fetch higher premiums than comparable homes in more established areas. This kind of insight can help investors spot opportunities more effectively. Visualizing these variables through real-time dashboards further enhances portfolio oversight.
Neural Networks for Pattern Detection
Neural networks are in a league of their own when it comes to identifying intricate patterns. They can detect U-shaped trends or complex interactions between property features that simpler algorithms might miss. These models excel at analyzing non-linear behaviors and uncovering emerging market signals.
"IML methods are also able to visualise how the strength and interactions of hedonic characteristics change over time, which investors could use to determine the types of assets that perform best at any given stage of the real estate investment cycle."
- Jonas Willwersch, University of Regensburg [3]
Neural networks require larger datasets and significant computing resources. However, their ability to detect subtle shifts - like emerging "hot zones" driven by new business developments, transit upgrades, or demographic changes - makes them a powerful tool for investors looking to stay ahead of the curve. When the goal is to spot nuanced market movements, neural networks can provide insights that are hard to match.
How to Build a Market Timing Prediction Model
3-Step Process to Build a Machine Learning Real Estate Market Timing Model
Creating a market timing model that delivers accurate predictions requires high-quality data, smart feature engineering, and rigorous validation. Each step in this process plays a key role in improving the model's precision and making it actionable for buy-and-sell decisions.
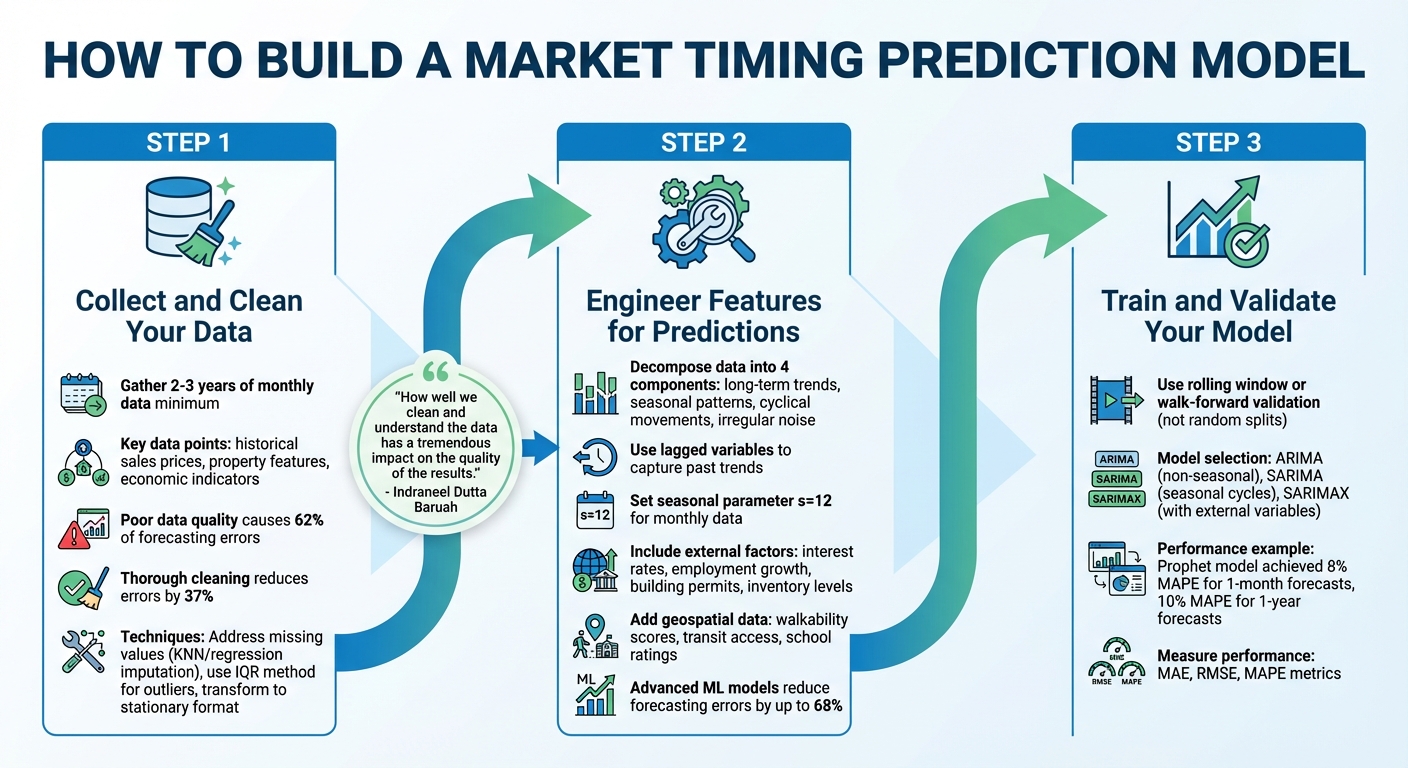
Step 1: Collect and Clean Your Data
The foundation of any reliable model lies in the data. Aim to gather at least 2–3 years of monthly data to identify seasonal trends, such as spring and summer sales spikes in residential markets [1]. Essential data points include historical sales prices, property features, and economic indicators like interest rates and employment statistics.
Data quality is critical. Research shows that poor data quality causes 62% of forecasting errors, but thorough cleaning can reduce these errors by 37% [1]. Address missing values using techniques like forward or backward filling, linear interpolation, or more advanced methods like KNN or regression-based imputation [1].
Outliers can distort your results, so use the Interquartile Range (IQR) method to detect them. Replace outliers with nulls and fill gaps through interpolation [1]. To ensure the data is ready for time series modeling, transform it into a stationary format using techniques like differencing or detrending [1].
"How well we clean and understand the data has a tremendous impact on the quality of the results." - Indraneel Dutta Baruah, Author and Data Scientist [1]
If you're merging data from various sources, such as quarterly NCREIF data with monthly employment statistics, ensure timestamps are consistent to avoid synchronization issues [1]. For example, stable mortgage rates - expected to average 6.3% in 2026 - can provide a steady baseline for your model [6]. However, in volatile interest rate periods, prioritize recent local market data, as buyer behavior can shift quickly with borrowing cost changes [6].
Step 2: Engineer Features for Predictions
After cleaning your data, focus on creating features that drive predictions. Decompose the data into four components: long-term trends, seasonal patterns, cyclical movements, and irregular noise [1].
Lagged variables are particularly useful, as they help capture how current values depend on past trends. For instance, analyzing how this month's rental rates relate to the previous three months can reveal market momentum [1]. When working with monthly data, setting a seasonal parameter (s=12) helps you account for annual cycles in residential sales [1].
External factors, or exogenous variables, are equally important. Include indicators like interest rates, employment growth, building permits, and inventory levels to identify shifts between buyer and seller markets [1]. Geospatial data, such as walkability scores, transit access, and school ratings, can also highlight neighborhood-level growth opportunities [1]. Advanced machine learning models leveraging large datasets (over 5,000 variables) have been shown to reduce forecasting errors by up to 68% compared to simpler linear regression models [5].
Step 3: Train and Validate Your Model
Time series data requires specialized validation techniques. Instead of random splits, use rolling window or walk-forward validation to ensure predictions rely only on past data [1].
Select your model based on the data's characteristics. ARIMA works well for non-seasonal trends, SARIMA handles seasonal cycles, and SARIMAX is ideal if you're incorporating external variables like interest rates [1]. For example, a study on NYC property sales from 2003–2015 found that the Prophet model achieved a Mean Absolute Percentage Error (MAPE) of 8% for one-month-ahead forecasts and 10% for one-year-ahead predictions [1].
Finally, measure your model's performance using metrics like MAE, RMSE, and MAPE. By calibrating your model with these tools, you can make data-driven decisions that reduce risks and enhance returns.
Using CoreCast for Market Timing Insights
Building machine learning models from the ground up can be a daunting task, requiring both time and specialized technical knowledge. CoreCast simplifies this process by bringing data aggregation, analysis, and forecasting together in a single, user-friendly platform.
What makes CoreCast stand out is its ability to integrate a wide range of data sources into one streamlined dashboard. With it, you can analyze any asset class or risk profile, monitor your pipeline across deal stages, visualize properties and competitive landscapes on interactive maps, and conduct in-depth portfolio analysis. This all-in-one system enables real-time analytics that reveal market opportunities quickly and effectively.
Real-Time Data Analysis
CoreCast pulls live market data from various sources - like MLS feeds, public records, and competitive intelligence - into one cohesive interface. Using machine learning algorithms, the platform generates instant forecasts, allowing you to identify opportunities before they become widely apparent.
Take Phoenix multifamily assets as an example. By inputting current inventory levels and interest rate data, CoreCast’s neural networks can pinpoint likely buy opportunities within the next six months. These insights are presented through intuitive dashboards and probability scores, making complex data easy to interpret.
Mapping Tools and Portfolio Analysis
CoreCast doesn’t stop at real-time insights. Its mapping and portfolio tools provide a clear, visual understanding of market dynamics. The mapping tool overlays machine learning predictions onto interactive maps, showing property locations, competitive landscapes, and price heatmaps. With color-coded zones highlighting high-growth areas - where prices are expected to rise based on local economic trends - it’s easier than ever to spot emerging hotspots.
The portfolio analysis tools take this a step further by using machine learning to evaluate your entire asset base. They assess risk-adjusted timings and track benchmark performance, helping you simulate scenarios like interest rate changes or shifts in rent growth. Plus, the Underwriter modeling engine is directly connected to your portfolio system, so property value forecasts automatically update as market conditions evolve.
Custom Reports for Stakeholders
CoreCast’s Stakeholder Center streamlines communication by letting you create branded reports that combine machine learning predictions, portfolio summaries, and map visualizations. These reports are fully customizable and can be scheduled for automatic email delivery, keeping investors informed and aligned on timing strategies.
For example, a report might recommend purchasing Miami condos, projecting an 18% appreciation by Q4 2026. It would include supporting data visualizations and portfolio context, turning predictive analytics into actionable insights. This efficient reporting process reduces decision-making timelines from weeks to hours, while ensuring consistent updates for your key stakeholders.
Challenges and Best Practices
Machine learning can uncover powerful insights, but real estate professionals face some tough hurdles when applying it. Problems like incomplete or delayed property data can throw off predictions, leading to poor investment decisions. Tackling these issues is critical to using machine learning effectively for timing the real estate market.
Managing Data Quality Issues
Missing or incomplete data can skew predictions in a big way. For example, a study on Hong Kong flat prices from 2003 to 2019 by researcher Indraneel Dutta Baruah revealed how gaps in data - only 4,233 records were available instead of the expected 6,173 - significantly impacted forecasting accuracy. The solution? Using the interquartile range (IQR) method to identify outliers, replacing those outliers with null values, and then applying linear interpolation to fill in the gaps[1]. Companies that prioritize strong data quality measures have been shown to reduce their forecasting errors by up to 37%[1].
"Thus, how well we clean and understand the data has a tremendous impact on the quality of the results." – Indraneel Dutta Baruah, Researcher[1]
Another issue to watch for is appraisal smoothing in private real estate returns. This happens when quarterly or annual appraisals create an illusion of stability, making the data look less volatile and more delayed than it really is[5]. To combat this, combine multiple data sources and use techniques like differencing or detrending to ensure the data reflects actual market conditions. The IQR method can also help detect and fix outliers caused by unusual sales or market disruptions, preventing them from skewing your analysis. Beyond cleaning up the data, making sure your model's outputs are easy to understand is just as important for building trust with stakeholders.
Making Models Understandable
While advanced models like XGBoost can deliver highly accurate predictions, they often lack transparency. Anh Tran from UF Warrington College of Business explains:
"ML has offered increased predictive accuracy over traditional models at the cost of difficult reasoning. It is often impossible to explain why ML produces a particular forecast other than it seems to work."[5]
To address this, present results in ways that are easy to grasp. For instance, use Mean Absolute Percentage Error (MAPE) to express accuracy as a percentage rather than raw error figures - it’s much more intuitive for stakeholders[1]. Visual aids like time series plots and error charts can also help investors identify patterns and understand where the model might fall short. And don’t forget to combine your quantitative insights with qualitative factors, such as local policy changes or supply constraints, which historical data alone can’t capture[1].
Adapting to Market Changes
Finally, models need to evolve as the market shifts. Instead of relying on random data splits, use rolling window or walk-forward validation to mimic real-world forecasting conditions[1]. This time-sensitive approach ensures your model learns from sequential patterns in the market, rather than disconnected historical snapshots.
The type of model you choose should also match the current market conditions. For instance, ARIMA works well in stable markets with straightforward trends, while SARIMA is better suited for seasonal cycles like annual sales peaks. During periods of economic fluctuation, SARIMAX can incorporate external factors like interest rate changes for more strategic forecasting[1]. Regularly retraining your model with fresh data ensures it stays aligned with current market dynamics, turning it into a flexible tool for ongoing predictions.
Conclusion
Machine learning is transforming how real estate professionals approach market timing. By tapping into varied datasets, algorithms like linear regression, random forests, and neural networks provide predictions that are 15-25% more accurate than traditional models in unpredictable markets. This accuracy translates into measurable financial gains - real estate investors using predictive analytics report an average of 15% higher ROI, according to the 2024 NAR report [7]. These tools reduce risks and unlock profit potential that manual analysis simply cannot match.
The impact of machine learning is evident in large-scale applications. Take Zillow's Zestimate model, for example. By analyzing data from over 110 million U.S. properties, it reduced its median error rate from 4.2% to 1.9%. This improvement allowed users to time sales with 25% better price accuracy, saving them $1.2 billion through optimized decisions [8]. Similarly, Reonomy (now part of Altus Group) used random forest algorithms to analyze 200 million property records, helping Blackstone identify undervalued assets. The result? An 18% boost in portfolio returns and over $500 million in acquisitions [9].
For professionals looking to harness this power without building custom models, platforms like CoreCast provide a practical solution. CoreCast offers an all-in-one real estate intelligence platform that integrates real-time data analysis, portfolio mapping, and automated forecasting. Users can underwrite assets, monitor deal pipelines, visualize competitive landscapes on interactive maps, and generate branded reports - all while benefiting from machine learning insights without the need for a dedicated data science team.
These examples highlight the tangible benefits of machine learning in real estate. To get started, focus on data collection and simple models like linear regression to build a foundation. Platforms like CoreCast can then help you scale to more advanced analytics as your needs evolve. Regularly testing and updating your models with fresh data ensures they remain relevant amidst economic changes. Pairing these insights with your local market knowledge - such as understanding regulatory shifts or supply constraints - creates a winning combination. This blend of advanced technology and on-the-ground expertise is the key to staying ahead in a competitive market.
FAQs
What data do I need to predict buy or sell timing?
To figure out the best times to buy or sell real estate, you need to dive into the numbers. Key data sources include property listings, transaction records, and local market trends. On top of that, factors like employment rates, interest rates, and historical property values play a big role in shaping market behavior.
By feeding these datasets into machine learning models, patterns start to emerge. These models can spot trends and refine predictions, giving real estate professionals the insights they need to make smarter decisions about market timing. Whether it's determining the right moment to list a property or advising buyers when to act, data-driven insights can make all the difference.
Which model should I start with for market timing?
The ARIMA model is an excellent tool for market timing, particularly when you're analyzing non-seasonal trends. However, if you're dealing with markets that show seasonal patterns, SARIMA could be a better option. ARIMA serves as a reliable method for examining real estate data and spotting trends with precision.
How do I validate forecasts without data leakage?
To ensure real estate forecasts remain accurate and free from data leakage, it's crucial to use methods that account for both time sensitivity and geographic differences. Here's how you can tackle this:
- Backtesting: Regularly evaluate your model's performance by comparing its predictions to historical data. This helps identify any weaknesses or inconsistencies.
- Scenario Testing: Simulate various market conditions to understand how your model performs under different circumstances. This approach ensures your forecasts are robust and adaptable.
- Realistic Metrics: Always validate your results against practical benchmarks like rent growth or cap rates. These metrics provide a clear picture of how well your model aligns with real-world expectations.
When it comes to model validation, choose strategies that suit your data type. For static models, k-fold cross-validation is a reliable option. For time-series data, opt for rolling-origin validation, which respects the chronological order of data and maintains the integrity of your forecasts.