
Multifamily Benchmarking: Expense Ratios Explained
Expense ratios, or Operating Expense Ratios (OER), measure how efficiently a multifamily property operates by comparing operating expenses to gross income. A typical OER falls between 35% and 50%, with lower ratios indicating efficient management and higher ratios potentially signaling inefficiencies or aging properties. Calculating OER involves dividing total operating expenses by gross operating income, excluding costs like debt service, capital expenditures, and depreciation.
Key points:
- OER Formula: (Operating Expenses ÷ Gross Income) × 100.
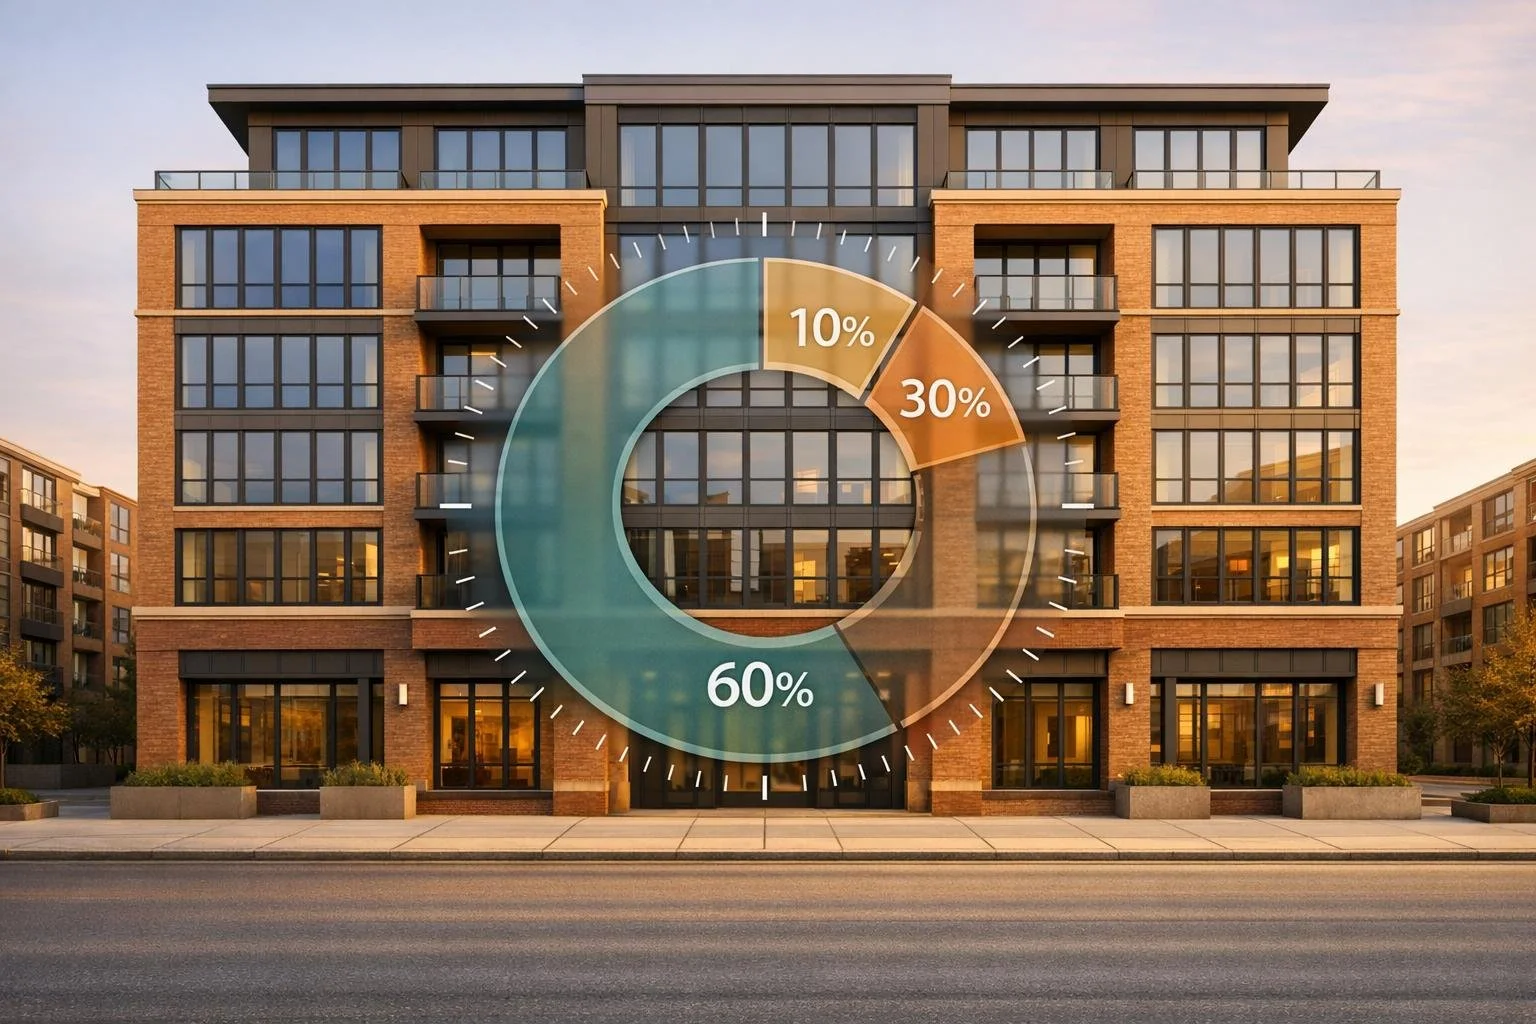
- Benchmark Ranges:
- Below 35%: Highly efficient, often newer properties.
- 35%–50%: Well-managed properties.
- Above 50%: Potential inefficiencies or older buildings.
- Included Expenses: Maintenance, taxes, insurance, utilities, management fees.
- Excluded Expenses: Debt service, capital expenditures, depreciation.
Factors like property age, class (A, B, C), location, and management efficiency heavily influence OER. Tools like AI-driven platforms can streamline analysis with a real estate deal analysis tool, helping investors identify savings and benchmark performance across portfolios.
Multifamily Operating Expense Ratio (OER) Benchmarks and Calculation Guide
What Are Multifamily Expense Ratios?
What is an expense ratio in multifamily real estate?
The Operating Expense Ratio (OER) is a key metric in multifamily real estate that measures how efficiently a property operates. It expresses total operating expenses as a percentage of gross operating income, showing how much of each dollar earned is spent on running the property versus contributing to profit [7][5]. This calculation focuses solely on operational performance, leaving out factors like debt service (mortgage payments), capital expenditures (such as major renovations), and depreciation [7][5][8].
A lower expense ratio is a sign of efficient management. It means a greater share of income is available for debt payments and investor returns [7][4].
"A lower operating expense ratio (OER) is more desirable for investors because it means that expenses are minimized relative to revenue." - Investopedia [7]
How are expense ratios calculated?
The formula for calculating the OER is straightforward:
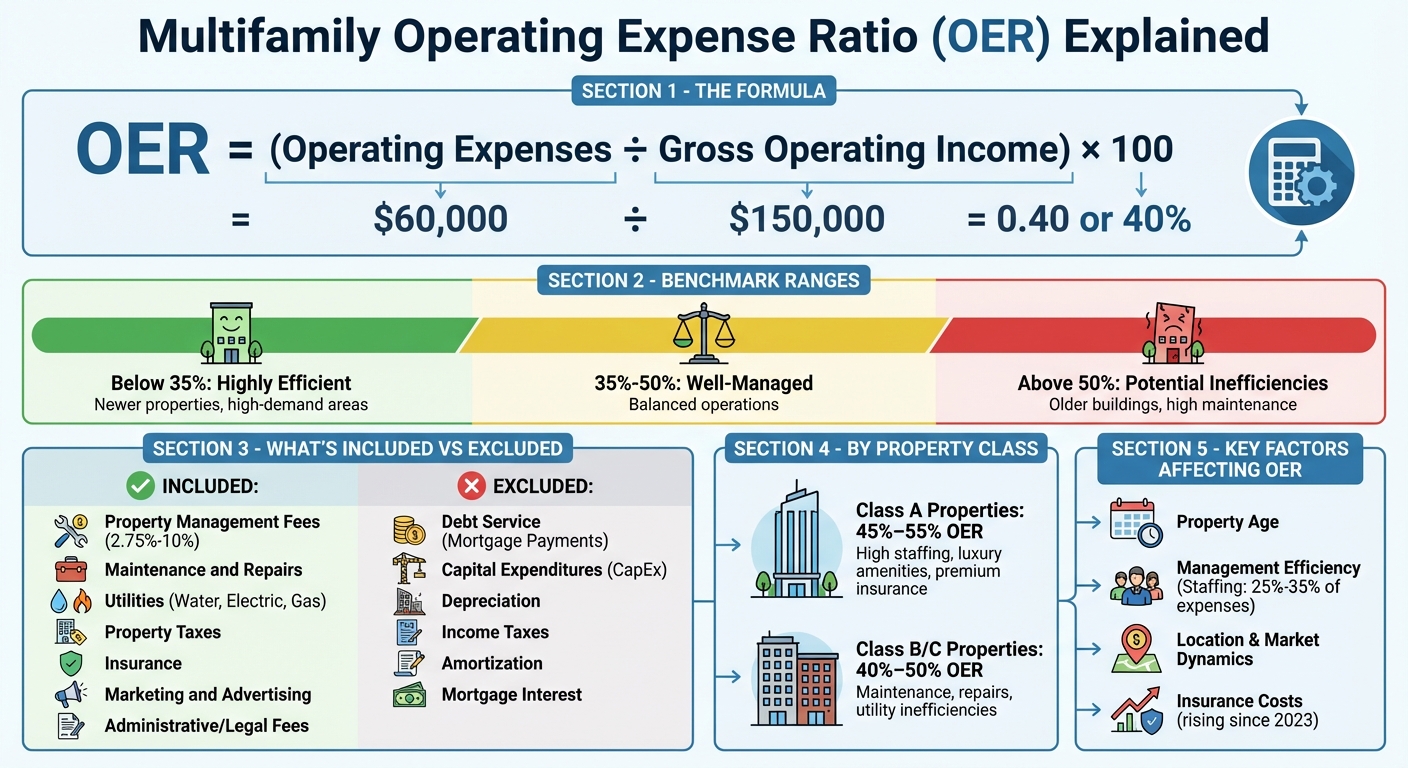
OER = (Total Operating Expenses ÷ Gross Operating Income) × 100 [5].
Here’s an example: Imagine a 100-unit property that generates $150,000 in annual gross operating income and incurs $60,000 in operating expenses. The calculation would look like this:
$60,000 ÷ $150,000 = 0.40, or 40%.
This means that 40% of every dollar earned goes toward operating costs, leaving 60% for debt payments and profit. This formula allows investors to compare operational efficiency across different properties using real-time portfolio management dashboards.
What expenses are included in the calculation?
Operating expenses refer to the recurring costs necessary to manage and maintain the property [8]. These typically include:
- Property management fees (usually 2.75% to 10% of revenue)
- Maintenance and repairs
- Utilities (water, electric, gas)
- Property taxes
- Insurance
- Administrative costs, such as legal fees
However, certain expenses are excluded from the calculation. These include capital expenditures (large, one-time improvements), debt service, depreciation, income taxes, and amortization. This exclusion ensures the focus remains on operational performance rather than financial structure [7][8][9][5].
| Included in Operating Expenses | Excluded from Operating Expenses |
|---|---|
| Property Management Fees | Debt Service (Mortgage Payments) |
| Maintenance and Repairs | Capital Expenditures (CapEx) |
| Utilities (Water, Electric, Gas) | Depreciation |
| Property Taxes | Income Taxes |
| Insurance | Amortization |
| Marketing and Advertising | Personal Property Expenses |
| Administrative/Legal Fees | Mortgage Interest |
Understanding these components is crucial for accurate benchmarking and improving the performance of your portfolio. Leveraging custom reporting tools can further streamline this process by automating data collection and analysis. Knowing how to calculate and analyze expense ratios provides a solid foundation for evaluating operational efficiency and identifying areas for improvement.
sbb-itb-99d029f
How to Use Expense Ratios for Benchmarking
What is a benchmark range for multifamily expense ratios?
For well-managed multifamily properties, operating expense ratios (OERs) typically fall between 35% and 50% [1][10]. Properties with an OER below 35% are considered highly efficient. These are often newer buildings or located in high-demand areas where elevated rental revenues help offset operating costs [10]. On the other hand, ratios exceeding 50% can indicate inefficiencies, older buildings, or properties with lower rental income relative to their upkeep needs [10].
However, these ranges can differ based on property class and location. For instance, Class A properties in expensive markets often operate with OERs between 45% and 55%, primarily due to higher staffing needs, luxury amenities, and premium insurance costs [2]. Meanwhile, Class B and C properties, especially those undergoing value-add improvements, usually fall within the 40% to 50% range [2]. Properties in prime markets tend to achieve lower OERs because higher rents offset expenses, whereas those in less desirable locations may struggle with higher ratios due to reduced income [10].
| OER Category | Range | Typical Characteristics |
|---|---|---|
| Low (Highly Efficient) | Below 35% | Newer properties, high-demand areas, high rental rates [10] |
| Average (Well-Managed) | 35% - 50% | Balanced maintenance and management [10] |
| High (Potential Red Flag) | Above 50% | Older properties, high maintenance, or inefficient management [10] |
How do you compare expense ratios across a portfolio?
To effectively compare expense ratios, a per-unit analysis is invaluable. Breaking down operating expenses on a per-unit basis helps differentiate between reasonable costs and excessive spending [6].
It's also essential to examine expense ratios over a 3–5 year period. This historical perspective can help you identify whether certain anomalies are one-time events or signs of deeper inefficiencies [2]. For example, discrepancies like low maintenance costs paired with high turnover expenses might point to deferred maintenance issues [2].
Modern tools, such as AI-driven expense analysis, can uncover potential savings of 5% to 15% during underwriting - insights that manual reviews might miss [2].
Another critical aspect is data standardization. Always exclude capital expenditures (CAPEX) from operating expense calculations, as including them can distort the ratio [6]. When benchmarking, ensure you're comparing properties with similar attributes, such as building type, age, and unit count (e.g., garden-style versus high-rise) [6]. These practices provide clarity on what drives variations in expense ratios.
What factors influence expense ratios?
Expense ratios are shaped by several factors, with older properties often facing higher costs. Aging systems, outdated infrastructure, and the absence of submetering contribute to increased utility and maintenance expenses [2].
Management efficiency also plays a crucial role. Staffing and payroll, which account for 25% to 35% of operating expenses, require careful oversight [2]. Property management fees, typically ranging from 3% to 10% of rental income, further affect costs [4].
Location and market dynamics have a significant impact as well. Local property tax assessments and regional risks, such as those in hurricane-prone areas like coastal Florida, can drive up fixed expenses [2]. Since 2023, rising insurance premiums have become a growing concern, requiring more frequent updates to quotes during underwriting [2].
| Factor | Class A Properties | Class B/C Properties |
|---|---|---|
| Typical Expense Ratio | 45% – 55% [2] | 40% – 50% [2] |
| Primary Cost Drivers | High staffing, luxury amenities, premium insurance [2] | Maintenance, repairs, utility inefficiencies [2] |
Understanding these factors allows for targeted adjustments, especially when leveraging advanced benchmarking tools to refine operational strategies.
39.6 Ep 123 - Multifamily Financials - T12, Above/Below the Line, Expense Ratio
How to Interpret Expense Ratio Variations
Expense ratios can reveal a lot about a property's operations, but understanding what those numbers mean requires a closer look at the context behind them.
When is a low expense ratio a positive sign?
An expense ratio below 35% often points to efficient operations. This is common in newer buildings with modern systems that need less upkeep or properties in high-demand areas where strong rental income naturally reduces the ratio [10]. Larger complexes can also achieve this due to economies of scale, like shared management resources [5].
However, an unusually low ratio isn’t always good news. It could indicate deferred maintenance or underfunding of key services. For example, in 2024, a property saw its expense ratio jump from 30% to 45.6% after correcting for understated taxes, insurance, and repair costs, which also hurt its valuation [8].
"A low OER may not always indicate a well-performing property, as it could be the result of deferred maintenance or insufficient investment in the property." - Dulan Perera, Director of Growth, Re-Leased [5]
If you see a ratio that’s far below market averages, dig deeper. Check maintenance records and verify that payroll, insurance, and tax expenses are realistic. In some cases, net lease structures or RUBS (Ratio Utility Billing Systems) may explain lower ratios because tenants share operating costs [5]. Careful due diligence ensures that the numbers reflect actual performance, not hidden issues.
What does a high expense ratio reveal?
Ratios above 50% often point to operational inefficiencies or structural challenges. These could stem from poor vendor contracts, overstaffing, or a lack of automation that inflates labor costs [5][6]. Older Class C buildings, for instance, tend to have higher ratios due to frequent repairs for aging systems like HVAC, plumbing, or roofs [2][5].
Another factor is insufficient submetering or RUBS, which leaves property owners covering tenant utility bills [2]. Fixed costs can also push ratios higher. For example, property tax reassessments after a sale or rising insurance premiums in disaster-prone areas have become significant issues since 2023 [2][8]. Inflation has also played a role - U.S. consumer prices rose 3.3% year-over-year as of May 2024, adding 1–2 percentage points to average expense ratios compared to pre-pandemic levels [5].
That said, not all high ratios are bad. Class A properties often operate with ratios between 45% and 55%, reflecting the cost of premium amenities, specialized staff, and higher service levels needed to maintain their status [2]. The key is determining whether the ratio matches the property's class and market standards, separating routine costs from deeper operational problems.
How do market and asset class affect expense ratios?
Expense ratios are shaped not just by how a property is run but also by its market and asset class. For instance, Class A properties, with their extensive amenities and premium services, typically fall in the 45%–55% range [2][6]. Class B and C properties usually range from 40% to 50%, though Class C buildings may lean higher due to aging infrastructure and repair needs [2][6].
Location also plays a big role. A 1980s Class B property in Phoenix will have very different costs compared to a 2020 Class A property in Seattle, thanks to differences in climate and infrastructure [2]. Properties in coastal Florida or wildfire-prone areas face higher insurance premiums for disaster risks [2][8].
When comparing expense ratios, normalize the data by focusing on similar property types and market conditions. For example, comparing a townhome-style property (where tenants often pay utilities) to a high-rise (where owners cover utilities) will skew the results [6]. Also, separate controllable costs, like payroll and marketing, from non-controllable ones, such as taxes and insurance. This helps pinpoint areas where management can make meaningful improvements [6][8].
Using Technology for Expense Ratio Analysis
Tracking expense ratios manually can be time-consuming and prone to errors. Today, modern technology platforms simplify this process, giving real estate professionals instant insights into how their properties compare to industry benchmarks and one another. By automating these tasks, technology ensures a smoother, more precise benchmarking process.
How can technology improve benchmarking?
Technology platforms consolidate and standardize financial data, allowing expense ratios to be calculated across an entire portfolio in real time. This eliminates the risk of formula errors and provides consistency when comparing properties of different sizes and types.
AI-driven tools take this a step further by identifying potential savings during underwriting. For instance, if a property's expense ratio significantly deviates from market norms, the system flags it. This could indicate either strong operational efficiency or potential issues like deferred maintenance, prompting a closer look.
What role does CoreCast play in expense ratio analysis?

CoreCast integrates expense ratio tracking directly into your investment workflow. It allows you to filter ratios by property attributes and compare initial projections with actual performance. For example, if you estimated a 42% expense ratio during underwriting but operations are running at 48%, CoreCast highlights that discrepancy immediately.
The platform also supports portfolio-wide analysis, enabling you to model scenarios like a 1% interest rate hike or a 10% drop in rental income to see how these changes would affect expense ratios and ROI. For teams managing multiple properties, CoreCast offers branded reports that make it easy to share benchmarks with investors or lenders. These reports clearly show how each property measures up against the typical multifamily benchmark of 40% to 45% [3][11]. This functionality ensures precise, real-time benchmarking remains at the forefront.
What additional insights can expense ratio analysis provide?
Expense ratio analysis goes beyond simple calculations. Tools like CoreCast help answer critical portfolio-level questions. Which properties are exceeding a 50% expense ratio and may need operational adjustments? Are expense ratios rising faster than rental income year-over-year? CoreCast tracks these patterns across your portfolio, offering a broader perspective beyond individual assets.
You can also compare expense ratios across asset classes. For example, if your industrial properties have an expense ratio of 18% - well within the 15% to 25% industry range - but your multifamily assets are closer to 47%, it becomes clear where operational improvements are most needed [11]. With features like integrated mapping and pipeline tracking, CoreCast provides a real-time, comprehensive view of portfolio health. These insights enhance your benchmarking strategy by uncovering operational trends that drive better decision-making.
Conclusion
Expense ratios play a crucial role in determining the gap between gross revenue and net operating income, making them one of the most important factors in property valuation - second only to rental income [2]. For multifamily properties, the typical expense ratio ranges from 35% to 50% [1]. However, an unusually low ratio might hint at deferred maintenance or underreported expenses, while a higher ratio could reflect essential investments like upgraded amenities or market-specific cost demands, rather than inefficiency [2].
Advancements in technology have streamlined the way real estate professionals analyze expense ratios. Tasks that once required 3–5 hours of manual spreadsheet work can now be completed in just 15–30 minutes using AI-powered platforms. These tools also help investors identify potential operating savings of 5% to 15% during the underwriting process [2]. CoreCast simplifies this further by integrating real-time portfolio comparisons, scenario modeling, and branded reporting into the investment workflow, making it easier to communicate benchmarks to stakeholders.
This combination of real-time analysis and scenario modeling highlights the importance of detailed expense ratio evaluations. By using these benchmarks, real estate professionals can improve portfolio performance and enhance property value. These insights ultimately lead to smarter, more informed investment decisions.
As The AI Consulting Network points out, accurate expense analysis is the foundation of successful underwriting [2]. Standardizing data collection, aligning analytical insights with physical inspections, and using platforms designed for comprehensive portfolio analysis can directly boost property value and investment returns.
FAQs
Should I use gross potential rent or collected income for OER?
When calculating the Operating Expense Ratio (OER), it's better to rely on collected income rather than gross potential rent. Why? Gross potential rent is purely hypothetical - it assumes every unit is rented out and all tenants pay on time. But in reality, factors like vacancies and collection losses come into play, making gross potential rent an unrealistic measure.
On the other hand, collected income reflects the actual income received. This makes it a much more accurate and practical figure for determining the OER, as it accounts for real-world conditions like tenant turnover and payment issues.
How can I tell if a low OER is just deferred maintenance?
A low Operating Expense Ratio (OER) might seem appealing at first glance, but it can sometimes signal deferred maintenance if certain costs are being overlooked or delayed. For instance, if a property has a history of underinvestment, sudden spikes in expenses, or costs that don't align with market norms, it could mean that hidden or upcoming maintenance needs are being ignored.
To get a clearer picture, it's important to dig deeper. Start by reviewing the property's maintenance records to spot any gaps or patterns. Conduct a thorough property inspection to uncover any signs of neglect. Finally, analyze expense trends over time - this helps determine whether the low OER is the result of efficient management or if it's masking underlying maintenance concerns.
What’s the best way to benchmark OER across different markets and asset classes?
Benchmarking the Operating Expense Ratio (OER) means comparing a property's operating costs to its revenue and then measuring those ratios against industry norms or market averages. For multifamily properties, the OER generally falls between 35% and 50%.
To get accurate results, it's crucial to collect precise data on expenses such as utilities and taxes while also factoring in local market conditions. Tools like CoreCast make this process easier by offering real-time analysis across various markets and asset types. This helps property owners and managers make informed decisions quickly.