
How Data Analytics Transforms Student Housing Management
Managing student housing is complex. You’re dealing with tight leasing windows, frequent tenant turnover, and fluctuating demand tied to academic cycles. But today, data analytics is reshaping how properties are managed.
Here’s what’s happening:
- Real-time occupancy tracking: Instantly monitor leasing performance and adjust strategies.
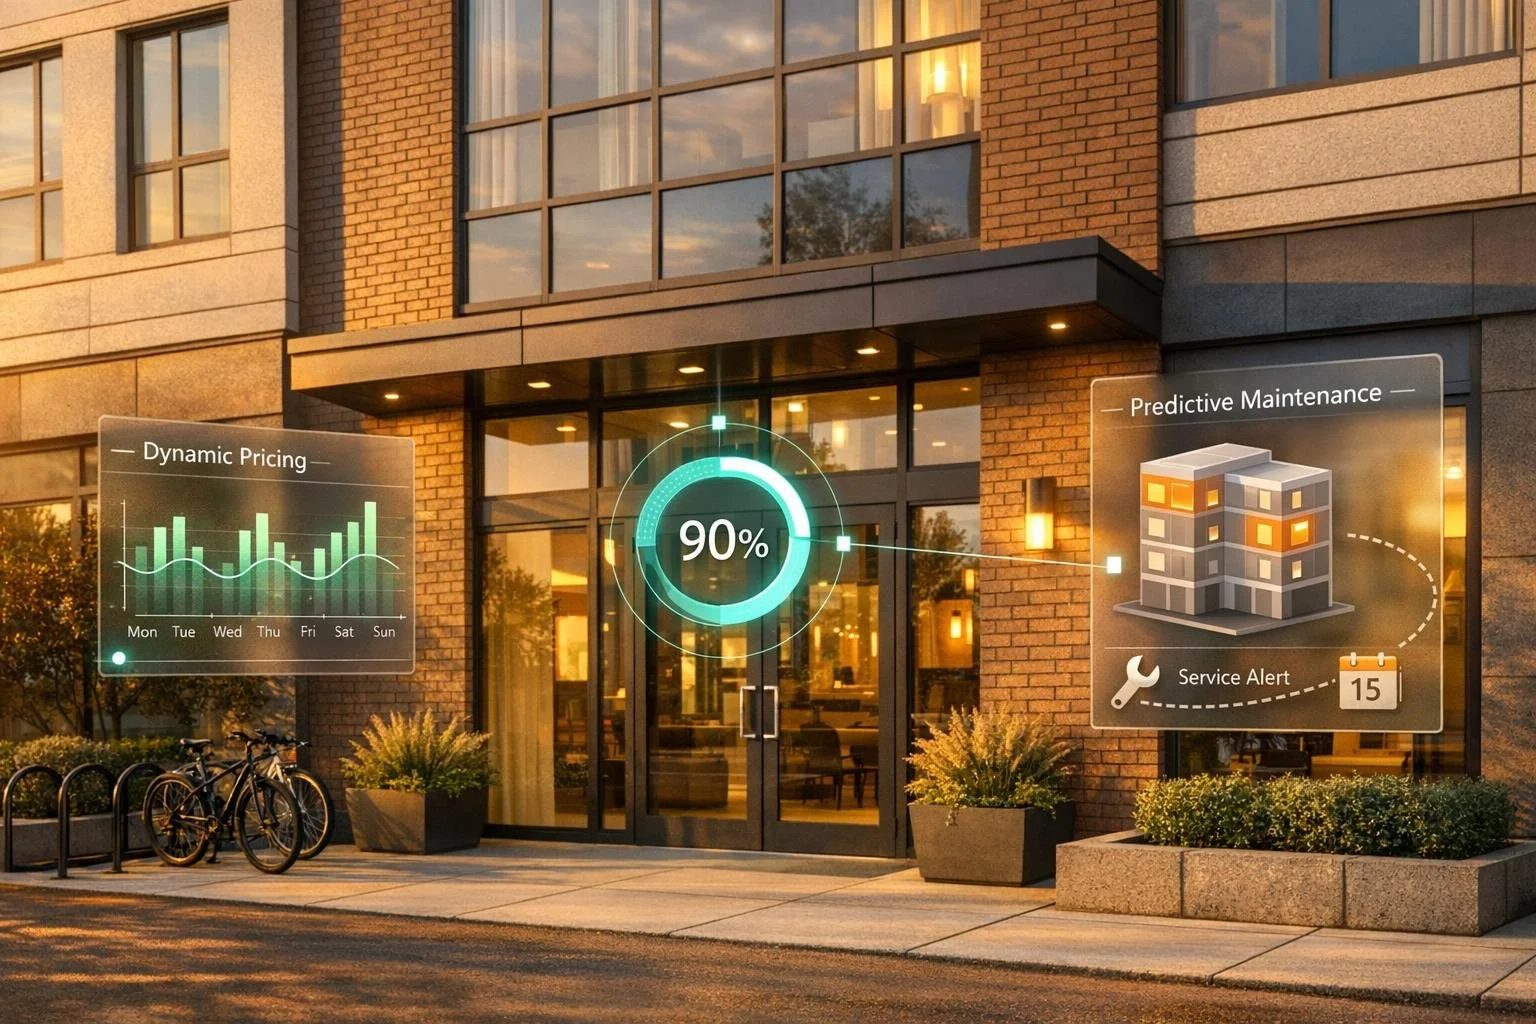
- Predictive maintenance: Use repair data to prevent costly emergencies.
- Dynamic pricing: Adjust rent based on demand and competitor trends.
- Tenant insights: Analyze preferences and behaviors to improve retention.
- Forecasting tools: Predict future demand and optimize leasing schedules.
Platforms like CoreCast consolidate data from multiple sources, offering tools for financial planning, market analysis, and decision-making. The result? Faster leasing, higher retention, and better overall management.
If you’re not leveraging analytics, you risk falling behind.
Student Housing Analytics: Key Performance Metrics and Impact Statistics
Tracking Occupancy and Performance Metrics
Monitoring Occupancy in Real Time
Managing student housing means filling hundreds of beds quickly, especially before the fall semester kicks off. Instead of relying on outdated monthly reports, real-time data analytics now offers instant updates on occupancy rates, lease expirations, and market trends.
With integrated dashboards pulling data from property management systems, CRMs, and accounting tools, managers get a clear, consolidated view of how their properties are performing. These dashboards make it easy to spot which floor plans are leasing quickly and which ones need attention. Armed with this information, managers can adjust marketing efforts or tweak pricing strategies on the fly to minimize vacancies.
By comparing current fill rates against historical patterns and competitor data, managers gain valuable context. AI-powered tools simplify the process by turning complex datasets into actionable insights, while IoT devices can even predict tenant turnover by tracking unit usage patterns.
This real-time visibility directly supports key performance indicators, helping property managers make informed decisions that keep operations running smoothly.
Key Performance Indicators for Student Housing
Real-time occupancy data is just the start - managers also rely on key performance indicators (KPIs) to fine-tune their operations. For example, tracking rent collection rates is critical, especially during semester transitions when students might delay payments or leave unexpectedly. Maintenance request volumes are another important metric, as they reflect tenant satisfaction and can highlight properties that may need extra staffing or resources ahead of busy move-in periods.
Another essential KPI is the capture rate, which measures how well a property converts available demand compared to the broader market. If a property’s capture rate drops while the market remains strong, it could point to internal issues like pricing or marketing missteps. Keeping an eye on lease expirations is equally important, as it helps managers stagger move-outs and maintain a steady cash flow. Automated alerts make this easier by flagging drops in occupancy or clusters of upcoming lease expirations, allowing for proactive planning.
Together, these metrics provide a roadmap for effective student housing management.
sbb-itb-99d029f
Analyzing Resident Data for Better Outcomes
Understanding What Tenants Want
Understanding tenant preferences starts with analyzing amenity usage. Data often reveals surprising trends that challenge assumptions. For instance, if your fitness center is buzzing with activity but the study lounge sits mostly unused, it's clear where maintenance funds should go and where budget cuts make sense.
Tracking the popularity of unit types is equally important. If students consistently choose two-bedroom units over four-bedroom options, it’s a sign to adjust your housing inventory to match demand. Similarly, knowing which booking platforms bring in the most qualified applicants can help fine-tune your marketing spend, focusing on channels that deliver the best results [3].
Student reviews are another goldmine for identifying overlooked issues. Complaints about poor move-in experiences, unclean common areas, or slow maintenance responses often show up in satisfaction ratings. Housing.Cloud emphasizes the importance of this kind of data:
"Data tells a story you can follow to achieve more of your housing goals, regardless of whether you want to improve resident retention, increase overall occupancy rates, or achieve other student housing solutions." [3]
Even security data can provide actionable insights. By tracking when and where incidents occur, you can implement targeted solutions - like adding cameras in high-risk areas or increasing monitoring during peak hours - that can directly enhance resident satisfaction [3]. These steps not only improve the living experience but also help reduce turnover, as discussed next.
Predicting Tenant Turnover
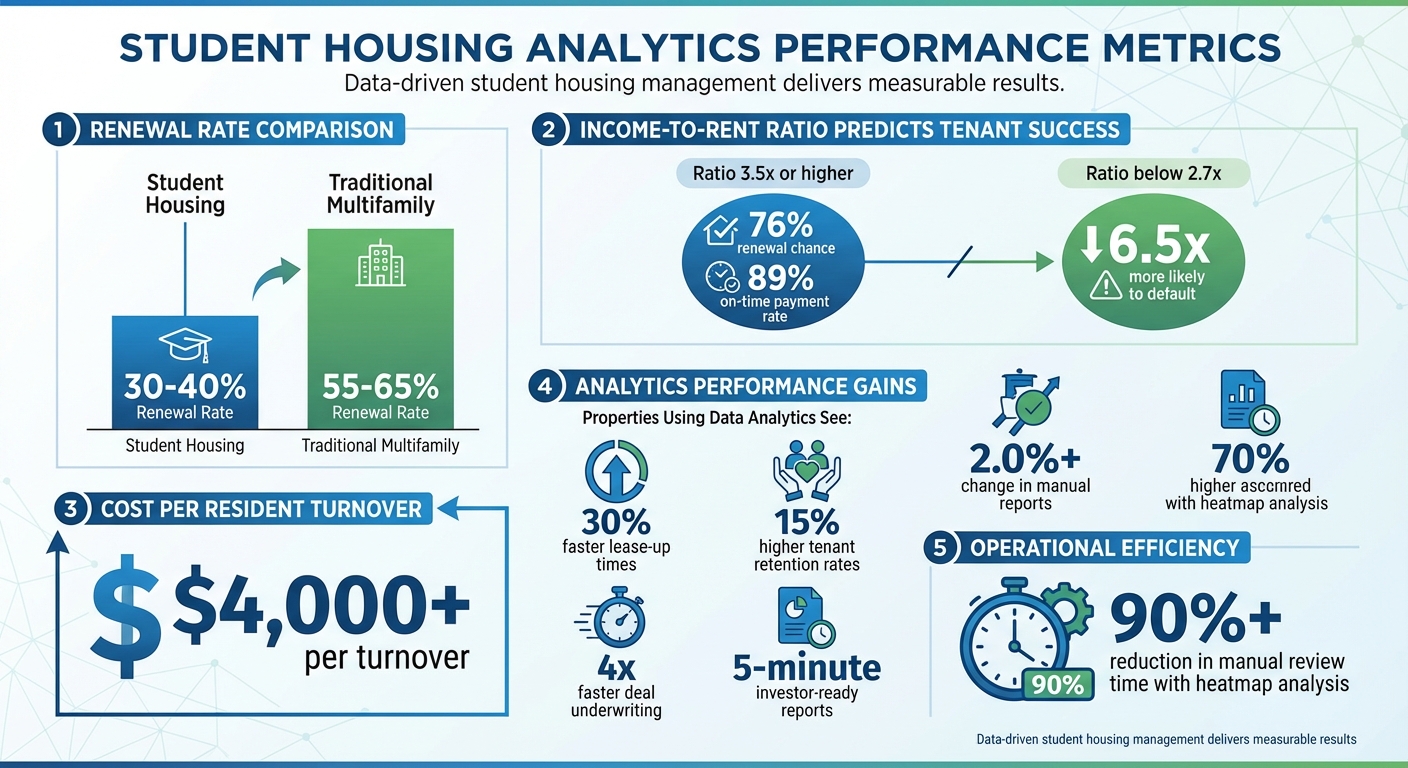
Student housing tends to have higher turnover rates, with renewal rates hovering around 30%–40%, compared to 55%–65% in traditional multifamily housing. Behavioral data can help identify tenants at risk of leaving [4]. For example, income-to-rent ratios at lease signing are a strong predictor of renewal likelihood: tenants with a ratio of 3.5x or higher have a 76% chance of renewing and an 89% on-time payment rate. In contrast, those with a ratio below 2.7x are 6.5 times more likely to default [4].
Other early warning signs include late payments, which often signal a tenant may vacate within six to twelve months [4]. Maintenance issues also play a big role - frequent requests or slow resolution times can lead to dissatisfaction and eventual turnover. Noise complaints, property damage charges, and roommate conflicts are additional red flags, as social tensions frequently drive residents to leave [4].
Considering that each resident turnover costs more than $4,000, identifying these risks early is crucial. Proactive measures - like offering lease renewal incentives, clearing maintenance backlogs, or resolving roommate disputes - can make a big difference in retaining tenants and minimizing these costly turnovers [4].
AI in Student Housing: Threat or Massive Opportunity?
Forecasting Trends with Predictive Analytics
Predictive analytics is taking student housing management to the next level by combining occupancy tracking and tenant insights with tools to forecast demand and fine-tune pricing strategies.
Using Historical and Market Data
To effectively forecast demand in student housing, managers need to blend internal data with external market insights. For instance, pairing historical occupancy data with trends like university enrollment projections, competitive housing stats, and regional student population growth provides a more accurate view of future demand.
Advanced platforms simplify this process by aligning data with academic calendars, automating demand forecasts, and renewal predictions. This reduces manual work while increasing precision [6]. With these insights, managers can anticipate bed needs and make proactive adjustments - like boosting leasing office staff or scheduling maintenance - before peak demand hits [10].
Some analytics tools even dive deeper, offering detailed student housing benchmarks to help operators stay ahead during high-demand periods, such as the start of the fall semester [7]. These forecasts also enable real-time adjustments to rental rates, ensuring that managers are prepared to meet market demand effectively.
Dynamic Pricing Strategies
Dynamic pricing takes these insights a step further by adjusting rental rates to match current market conditions. AI-driven tools analyze demand signals, historical pricing trends, and competitor rates to optimize pricing in real time. This approach is especially useful during peak periods, like the beginning of an academic term, allowing operators to secure higher yields [6].
Generative AI tools add another layer of sophistication by examining leasing patterns and market trends to predict occupancy levels and pinpoint which amenities students value most [9]. This data-driven method not only improves rent recovery but also enhances property value by syncing rate changes with academic cycles and market positioning.
Practical application involves integrating property management system data with market feeds, setting AI rules for rate adjustments (like increasing rates by 10–15% during high-demand periods), and testing these strategies before fully implementing them [8]. This ensures a smooth rollout and maximizes returns during critical leasing windows.
Optimizing Operations with Analytics Platforms
Modern analytics platforms are transforming how businesses handle operations by combining real-time insights with predictive trends. These platforms bring together leasing systems, maintenance logs, and market feeds into a single, centralized hub. This integration provides instant access to key metrics like occupancy rates, rent collection, and maintenance performance, all in real time [11]. With this streamlined approach, teams can respond swiftly to changes and eliminate the need for time-consuming manual reporting. The result? A more efficient way to track occupancy and forecast property values.
Portfolio Analysis and Competitive Mapping
Interactive mapping tools within these platforms offer a fresh way to analyze student housing portfolios alongside competitors. For example, Article Student Living uses heatmaps to see where residents gather most often. This approach cuts down manual review time by over 90% and helps guide decisions on site planning and resource allocation [9]. These visual insights feed directly into detailed reports, making it easier to share findings with stakeholders.
Creating Reports for Stakeholders
Analytics platforms simplify reporting by automating the creation of branded, professional reports. These reports combine leasing, maintenance, and market data, saving hours of manual effort while ensuring stakeholders receive accurate and timely updates [8, 17].
CoreCast as an End-to-End Analytics Platform
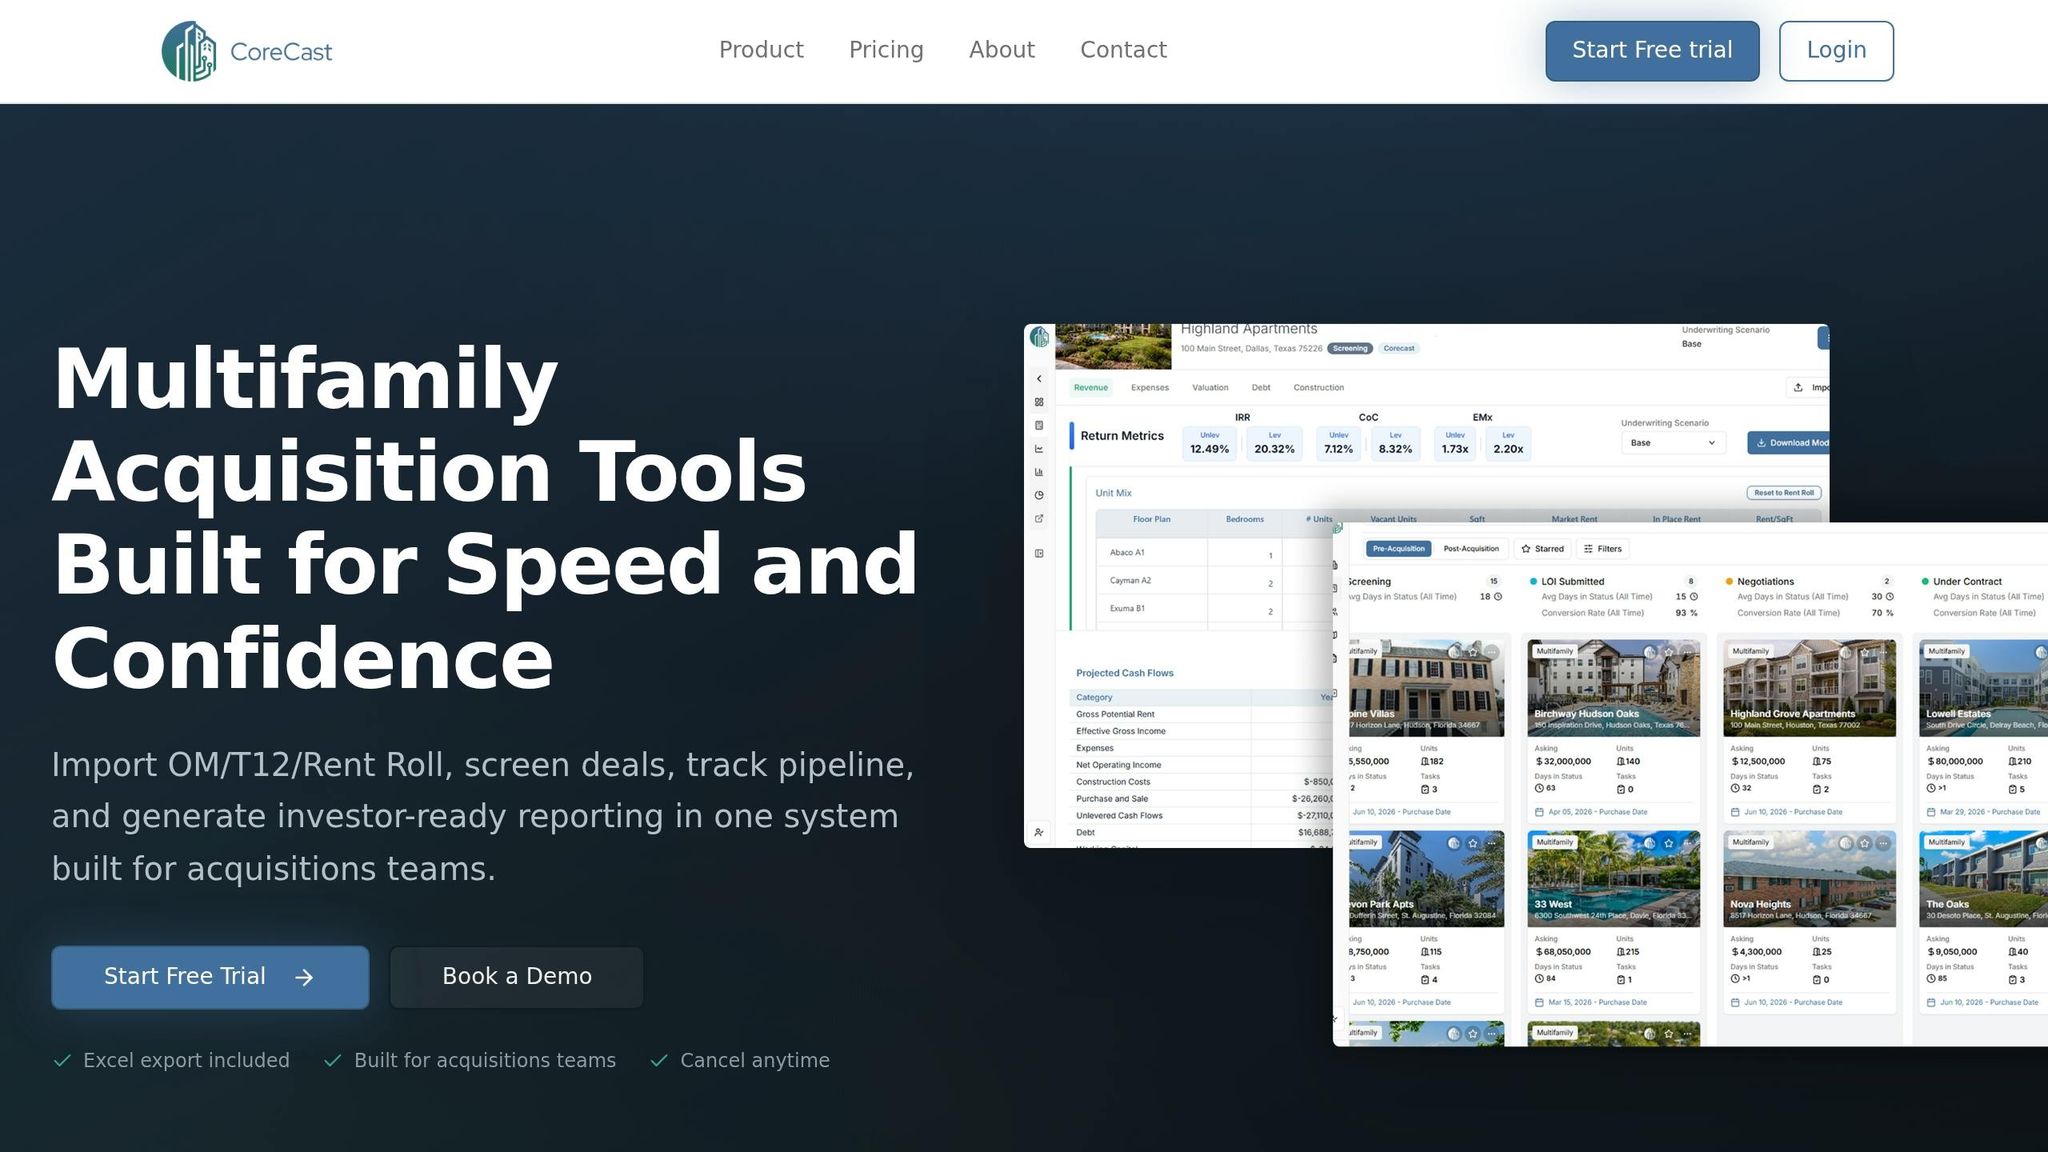
CoreCast stands out as a comprehensive analytics platform designed to handle the entire real estate intelligence process. It allows managers to underwrite assets across various classes, monitor deal pipelines, analyze portfolios, and even map out properties and competitors. The platform also features a stakeholder center for seamless communication and supports branded reporting. While CoreCast integrates with property management systems to provide real-time data, its primary focus is on analytics and intelligence rather than daily management tasks. For student housing, this platform is particularly aligned with operational needs, syncing data with academic calendars and automating forecasts to minimize administrative workload [6].
Conclusion
Data analytics has reshaped the student housing industry, moving it away from guesswork and toward actionable insights. By analyzing tenant behavior, market trends, and operational inefficiencies, property managers can uncover patterns that others might overlook, adapt quickly to market shifts, and make decisions based on real-time data instead of relying solely on intuition [2].
For example, properties that integrate data analytics often see impressive results - up to 30% faster lease-up times and 15% higher tenant retention rates [5]. These gains stem from a deeper understanding of tenant preferences, the ability to predict turnover before it occurs, and the flexibility to adjust pricing strategies based on live market data. As Jason Fort, EVP at Asset Living, succinctly states:
"I can confidently say that if you're not leveraging their comprehensive student housing data platform, you're getting lapped and left behind by your competition" [1].
Platforms like CoreCast take this a step further by streamlining operations. They allow users to underwrite deals up to four times faster and produce investor-ready reports in just five minutes [12]. These tools break down data silos and cut through the administrative hurdles that often slow decision-making.
To fully benefit from analytics, start by focusing on key metrics like occupancy rates and maintenance forecasts. Test new tools on a small scale - one or two properties - before rolling them out across your portfolio. This approach not only builds staff confidence but also ensures that the value of these tools is evident before scaling up.
Today, student housing management is about staying ahead of challenges rather than scrambling to respond. With the right analytics platform, you can streamline operations, improve tenant satisfaction, and achieve better results for all stakeholders involved.
FAQs
What data should I track first in student housing?
When it comes to student housing, there are a few key metrics that can provide valuable insights:
- Occupancy rates: This metric tells you how effectively the available beds are being filled. High occupancy rates typically indicate strong demand and efficient operations.
- Pre-leasing velocity: This measures how quickly units are being leased before the academic year begins. It’s a great way to gauge early interest and demand.
- Student-to-bed ratios: By tracking this, you can identify potential housing shortages or oversupply in a given market.
- Rent growth: Keeping an eye on rent increases helps you stay on top of market trends and adjust pricing strategies accordingly.
By focusing on these metrics, you can make more informed decisions and improve overall operational performance.
How can I forecast demand around the academic calendar?
To predict demand effectively, it’s essential to dive into historical enrollment data, leasing trends, and broader regional patterns. Using data analytics tools, you can blend metrics like pre-leasing velocity, occupancy rates, and enrollment growth to anticipate demand cycles with greater accuracy.
For instance, monitoring early occupancy rates allows you to tweak strategies in real-time, ensuring properties hit full occupancy during critical periods. Additionally, predictive analytics can simulate various scenarios, helping refine resource allocation and develop leasing strategies that align perfectly with the academic calendar.
How do I roll out analytics without disrupting operations?
To implement analytics effectively, begin with a step-by-step approach. Focus on specific areas, such as tracking occupancy or forecasting rent, to keep things manageable. Leverage your existing data to reduce disruptions and integrate tools like CoreCast into your current systems for smooth operations. Make sure to train your team, so they understand how analytics can help and can monitor progress effectively. This way, you can adopt analytics without disrupting daily workflows.